Optical Communication and Networking Market Size & Overview:
Get more information on Optical Communication and Networking Market - Request Sample Report
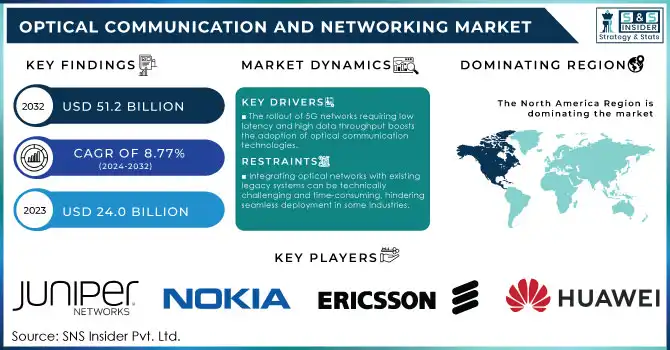
The Optical Communication and Networking Market was valued at USD 24.0 billion in 2023 and is expected to reach USD 51.2 billion by 2032, growing at a CAGR of 8.77% over 2024-2032.
The Optical Communication and Networking Market is witnessing robust growth, fueled by the rising demand for high-speed data transmission, the rollout of 5G networks, and the widespread adoption of cloud computing. Leveraging light to transmit data through optical fibers, optical communication systems are integral to high-performance networks due to their ability to deliver low latency, high bandwidth, and long-distance connectivity. Widely utilized across sectors such as telecommunications, data centers, enterprise networks, and healthcare, this technology provides scalable and efficient solutions for handling data-intensive operations. The global surge in internet consumption, driven by trends like remote work, online education, and digital entertainment, has further amplified the need for reliable optical networking solutions. A significant growth driver is the rapid deployment of 5G networks, which necessitate advanced optical communication systems to support their high-speed data requirements and ultra-reliable low-latency performance. For instance, the global demand for optical transceivers—vital components in these systems—has surged, with sales surpassing USD 10 billion in 2023, reflecting the substantial investments in this technology. The growing adoption of data centers and hyperscale infrastructure also fuels market expansion. As applications such as artificial intelligence (AI), machine learning (ML), and big data analytics become mainstream, data centers are increasingly adopting optical technologies to manage higher data volumes more efficiently. Recent figures reveal that leading operators like Google and Amazon significantly increased spending on optical networking equipment, with global investments in optical transport equipment exceeding USD 16 billion in 2023, underscoring the critical role of optical communication in powering cloud services.
The market is further bolstered by the integration of optical technologies in smart cities and IoT ecosystems. Optical fiber serves as the backbone for high-speed connectivity in applications like smart grids, intelligent transportation, and video surveillance. Governments worldwide are prioritizing investments in fiber optic infrastructure, such as India’s BharatNet initiative, aimed at delivering high-speed optical connectivity to rural areas. Advancements in wavelength-division multiplexing (WDM), photonic integrated circuits (PICs), and coherent optical solutions continue to drive innovation, making optical communication systems more efficient and cost-effective. Coupled with the global push for digital transformation, these technological breakthroughs are set to propel the market's sustained growth in the coming years.
Optical Communication and Networking Market Dynamics
Drivers
-
The rollout of 5G networks requiring low latency and high data throughput boosts the adoption of optical communication technologies.
-
Development of smart cities and IoT ecosystems relies on optical fiber for high-speed connectivity in applications such as smart grids and surveillance.
-
Growing use of data-intensive technologies like AI, ML, and cloud computing necessitates optical networking for efficient data transmission.
The proliferation of data-intensive technologies such as Artificial Intelligence (AI), Machine Learning (ML), and cloud computing has emerged as a key driver of growth in the Optical Communication and Networking Market. These technologies generate and process enormous volumes of data, necessitating robust, efficient, and reliable networks for seamless storage, computation, and transmission. Optical communication systems, known for their exceptional bandwidth and low latency, are essential to meet these requirements. AI and ML applications demand real-time data processing, which relies on networks capable of rapidly and securely transmitting large datasets. For instance, training complex machine learning models requires high-performance computing infrastructures supported by optical networking to ensure smooth data exchange across distributed data centers. Similarly, cloud computing heavily relies on optical communication to facilitate efficient data transfer between geographically dispersed servers, enabling services like video streaming, SaaS platforms, and collaborative online tools.
Data centers, which form the backbone of AI, ML, and cloud computing operations, are increasingly adopting advanced optical technologies such as wavelength-division multiplexing (WDM) and photonic integrated circuits (PICs). These innovations allow data centers to scale efficiently by enabling multiple data streams to travel through a single optical fiber, reducing costs and enhancing performance. Furthermore, the rapid expansion of hyperscale data centers by leading cloud providers such as AWS, Microsoft Azure, and Google Cloud has resulted in significant investments in optical transport equipment, further fueling market development. The demand for secure, energy-efficient, and high-speed data transmission has reinforced the importance of optical networking. Businesses are turning to optical communication systems for faster, more reliable, and scalable connectivity, meeting the growing need for data-driven services in enterprise and consumer domains.
| Technology | Data Requirement | Optical Networking Role | Example Use Case |
|---|---|---|---|
| AI & ML | High-speed data transfer for model training | Supports distributed data centers with low latency | Training neural networks |
| Cloud Computing | Large-scale data storage and sharing | Enables seamless connectivity between servers | SaaS platforms like Office 365 |
| Big Data Analytics | Real-time data analysis | Facilitates high-throughput data transmission | Market trend analysis |
| Video Streaming | High-bandwidth demand | Ensures smooth content delivery | Platforms like Netflix |
Restraints
-
Integrating optical networks with existing legacy systems can be technically challenging and time-consuming, hindering seamless deployment in some industries.
-
A shortage of skilled professionals for the installation, maintenance, and operation of advanced optical systems poses challenges to market growth.
-
Optical fiber networks are prone to physical damage such as fiber cuts during construction, leading to service disruptions and increased maintenance costs.
The availability of skilled professionals for the installation, maintenance, and operation of advanced optical systems acts as a major hindrance to the Optical Communication and Networking Market. With the development of new technologies for optical communication, such as wavelength-division multiplexing (WDM), photonic integrated circuits (PICs), and coherent optical solutions, the need for skilled professionals to design, deploy, and troubleshoot such systems has been significantly expanded. Nonetheless, a skills gap exists, with a small number of professionals qualified to operate contemporary optical networks. Fiber splicing, connectorization, and testing of optical communication systems must be carried out with precision and require specialized training. The increasing density of high bandwidth as business and service providers extend optical networks to meet the ongoing demand for fast, high-capacity connectivity without the professionals required to deploy them can lead to delays and increased operating expenses.
Further, they often require sophisticated network monitoring, analysis, and fault management tools to operate high-performance optical systems. Insufficient workforce counts affect network reliability and effectiveness, which, in turn, negatively influences the user experience. In emerging markets, this problem is particularly severe, as the investment in programs for training and technical education was not at the same pace as the adoption of lattice technology and other optical technologies. In response, companies and governments are focusing on upskilling, creating certification programs, and partnering with universities to create a better workforce.
Optical Communication and Networking Market Segment Analysis
By Component
The Optical Fiber segment dominated the Optical Communication and Networking Market and represented a significant revenue share of 39.9% in 2023, due to its vital role in data transmission. With the growing demand for high-speed internet and the ongoing expansion of 5G networks, optical fiber remains the foundation of these advanced communication infrastructures. The segment is set for continuous growth, driven by the increasing adoption of cloud computing, AI, and IoT, all of which require high-performance, efficient networks. Additionally, global initiatives like fiber-to-the-home (FTTH) will contribute to sustained demand. The segment is expected to maintain a stable CAGR, with continued investments in fiber infrastructure supporting global digital transformation.
The Optical Transceivers segment is anticipated to experience the highest CAGR in the Optical Communication and Networking Market. As data centers and telecom networks place greater reliance on high-capacity optical systems to manage expanding data traffic, the need for optical transceivers—key components for converting electrical to optical signals—is rising. The growth of 5G networks, hyperscale data centers, and the increasing demand for low-latency, high-speed communication are primary drivers for this segment. Advances in more compact, efficient transceivers, coupled with the growing adoption of 100G and 400G transceivers, will further boost growth. As these technologies advance, the optical transceivers segment is expected to capture a greater share of the market.
By Technology
The Wavelength Division Multiplexing (WDM) segment dominated the Optical Communication and Networking Market and accounted for 41.0% in 2023, primarily due to its ability to transmit multiple data streams over a single optical fiber using different wavelengths. This technology enables telecom operators and data centers to maximize fiber utilization, significantly increasing network capacity without additional physical infrastructure. With the surging demand for higher bandwidth driven by 5G expansion, cloud computing, and data-heavy applications like AI and IoT, WDM adoption continues to rise. As the need for high-speed, scalable communication solutions grows, WDM is expected to maintain its strong position, efficiently managing vast data traffic in the coming years.
The SONET/SDH segment is projected to register the highest CAGR within the Optical Communication and Networking Market. SONET (Synchronous Optical Network) and SDH (Synchronous Digital Hierarchy) technologies are known for their high-capacity, reliable, and scalable data transmission capabilities over long distances. The segment’s growth is driven by the increasing demand for robust, high-speed backbone networks, especially in telecom infrastructure. With internet traffic continually growing, telecom providers are modernizing their infrastructure with SONET/SDH solutions to ensure reliable communication. As telecom services evolve and digitalization increases, SONET/SDH is expected to experience significant growth, particularly in emerging markets.
By Vertical
The IT & Telecom segment dominated the optical communication and networking Market with a significant revenue share of more than 36.0% in 2023. Both telecom operators as well as vendors are adopting optical communication technologies due to growing demand for higher bandwidth and low-latency data transmission. The quick 5G rollout and growing data centers and telecom infrastructure have provided significant funds to optical networks. Continuous digital transformation along with the demand for ever-faster and more reliable communication services is expected to drive steady growth in this sector. High data traffic globally is expected to grow in the future, therefore, the IT & Telecom sector is again expected to retain its stronghold in the optical communication market due to continued investments.
The Healthcare segment is expected to experience the highest CAGR during the forecast period. As telemedicine, electronic health records (EHR), and remote monitoring grows, the need for swift and secure data transmission continues to expand. Optical communication technologies play a crucial role in facilitating the safe and efficient transfer of medical data between hospitals, clinics, and remote care settings. Innovative healthcare technologies, including telehealth, AI diagnostics, patient data analytics, and others will continue to emerge, leading to increased demand for high-bandwidth, low-latency networks. As the investments in digital healthcare keep on building, the healthcare sector looks designed for a robust growth trajectory in the years to return.
Optical Communication and Networking Market Regional Analysis
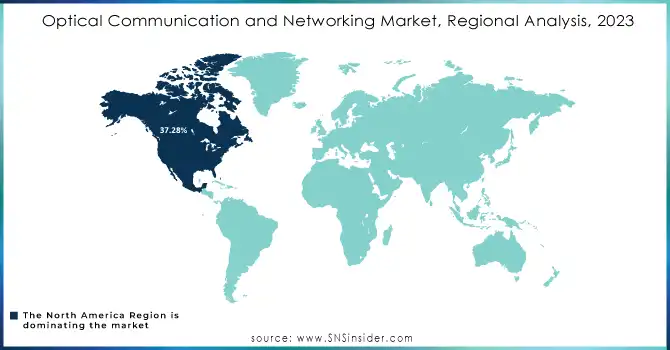
In 2023, North America dominated the market and represented a significant revenue share of more than 37.28%, due to early adoption of innovative technologies along with the presence of major telecom and data center operators. The rapid roll-out of 5G networks, combined with the growing expansion of cloud and IoT services, has driven strong investments in optical communications infrastructure. With ongoing infrastructure expansion, technological innovations, and growing demand for high bandwidth–low latency solutions, North America is projected to continue as the market leader. The region is continued to dominate with the expansion of 5G networks and data centers due to stable government policies.
The Asia-Pacific (APAC) region is anticipated to grow at the highest CAGR during the forecast period, driven by rapid digitalization, growing telecom networks, and rising 5G demand among countries, such as China, India, and Japan. The demand for more advanced communication infrastructure is largely being driven by APAC, due to its growing population and increasing internet penetration. Increasing demand for optical communication technologies due to factors such as growth in cloud computing, IoT, and smart city projects. The continuous investment in telecom infrastructure as well as the accelerated pace in technology adoption by telecom operators in the APAC region is likely to enable the region to witness significant growth in the issue of high-speed internet access expanding its role in the global transition towards optical networks.
Need any customization research on Optical Communication and Networking Market - Enquiry Now
Key Players
The major key players along with their products are
-
Cisco Systems – Cisco Optical Networking Solutions
-
Huawei Technologies – Huawei OptiXtrans DC908
-
Ericsson – Ericsson Optical Transport Network
-
Juniper Networks – Juniper MX Series 5G Routers
-
Nokia Corporation – Nokia 1830 Photonic Service Engine
-
Ciena Corporation – Ciena WaveLogic Ai
-
Infinera Corporation – Infinera ICE6
-
ZTE Corporation – ZTE 5G Optical Transport Network Solution
-
ADVA Optical Networking – ADVA FSP 3000
-
Corning Inc. – Corning Optical Fiber Solutions
-
Fujitsu Ltd. – Fujitsu Flashwave 9500
-
Neos Networks – Neos Networks Optical Transport Solutions
-
Broadcom Inc. – Broadcom Optoelectronics
-
Mellanox Technologies (acquired by NVIDIA) – Mellanox InfiniBand
-
Lumentum – Lumentum Optical Components
-
Viavi Solutions – Viavi ONX Optical Network Monitoring Solutions
-
Keysight Technologies – Keysight Optoelectronic Test Equipment
-
Nexans – Nexans Optical Cables
-
Sumitomo Electric Industries – Sumitomo Electric’s Optical Fiber Cables
-
II-VI Incorporated – II-VI Photonic Components
Recent Developments in the Optical Communication and Networking Market
-
January 2024 – Precision OT highlighted key trends shaping optical networking in 2024, including the rising adoption of XGS-PON technology in FTTH (Fiber to the Home) networks and the push toward DOCSIS 4.0 in HFC (Hybrid Fiber Coaxial) networks. The company noted that operators are increasingly seeking integrated systems and engineering support to meet the growing demand for fiber-based connectivity, especially in rural areas.
-
February 2024 – Nokia expanded its efforts in high-speed optical networks by launching its 400G coherent optics solutions. This technology is expected to enhance bandwidth capabilities, reduce latency, and improve overall network efficiency, catering to the rising demands for faster data transmission.
| Report Attributes | Details |
| Market Size in 2023 | US$ 24.0 Bn |
| Market Size by 2031 | US$ 51.2 Bn |
| CAGR | CAGR of 8.77% from 2024 to 2032 |
| Base Year | 2023 |
| Forecast Period | 2024-2032 |
| Historical Data | 2020-2022 |
| Report Scope & Coverage | Market Size, Segments Analysis, Competitive Landscape, Regional Analysis, DROC & SWOT Analysis, Forecast Outlook |
| Key Segments | • By Component (Optical Fiber, Optical Transceivers, Optical Amplifiers, Optical Switches, Optical Circulators, Others) • By Technology (WDM, SONET/SDH, Fiber Channel, Others) • By Application (Data Center, Telecom, Enterprise, Others) • By Vertical (IT & Telecom, BFSI, Government and Aerospace & Defense, Healthcare, Energy & Utilities, Others) |
| Regional Analysis/Coverage | North America (US, Canada, Mexico), Europe (Eastern Europe [Poland, Romania, Hungary, Turkey, Rest of Eastern Europe] Western Europe] Germany, France, UK, Italy, Spain, Netherlands, Switzerland, Austria, Rest of Western Europe]), Asia Pacific (China, India, Japan, South Korea, Vietnam, Singapore, Australia, Rest of Asia Pacific), Middle East & Africa (Middle East [UAE, Egypt, Saudi Arabia, Qatar, Rest of Middle East], Africa [Nigeria, South Africa, Rest of Africa], Latin America (Brazil, Argentina, Colombia, Rest of Latin America) |
| Company Profiles | Cisco Systems, Huawei Technologies, Ericsson, Juniper Networks, Nokia Corporation, Ciena Corporation, Infinera Corporation, ZTE Corporation, ADVA Optical Networking, Corning Inc, Fujitsu Ltd, Neos Networks, Broadcom Inc, Mellanox Technologies, Lumentum, Viavi Solutions, Keysight Technologies, Nexans, Sumitomo Electric Industries, II-VI Incorporated |
| Key Drivers | • The rollout of 5G networks requiring low latency and high data throughput boosts the adoption of optical communication technologies. • Development of smart cities and IoT ecosystems relies on optical fiber for high-speed connectivity in applications such as smart grids and surveillance. • Growing use of data-intensive technologies like AI, ML, and cloud computing necessitates optical networking for efficient data transmission. |
| Market Restraints | • Integrating optical networks with existing legacy systems can be technically challenging and time-consuming, hindering seamless deployment in some industries. • A shortage of skilled professionals for the installation, maintenance, and operation of advanced optical systems poses challenges to market growth • Optical fiber networks are prone to physical damage such as fiber cuts during construction, leading to service disruptions and increased maintenance costs. |
Frequently Asked Questions
Some of the challenges in the Optical Communication and Networking Market are:
-
Integrating optical networks with existing legacy systems can be technically challenging and time-consuming, hindering seamless deployment in some industries.
-
A shortage of skilled professionals for the installation, maintenance, and operation of advanced optical systems poses challenges to market growth.
-
Optical fiber networks are prone to physical damage such as fiber cuts during construction, leading to service disruptions and increased maintenance costs.
Some of the major growth drivers of the Optical Communication and Networking Market are:
-
The rollout of 5G networks requiring low latency and high data throughput boosts the adoption of optical communication technologies.
-
Development of smart cities and IoT ecosystems relies on optical fiber for high-speed connectivity in applications such as smart grids and surveillance.
-
Growing use of data-intensive technologies like AI, ML, and cloud computing necessitates optical networking for efficient data transmission.
The North American region dominated the Optical Communication and Networking Market.
The Optical Communication and Networking Market is expected to grow at a CAGR of 8.77% during the forecast period of 2024-2032.
The Optical Communication and Networking Market was valued at USD 24.0 billion in 2023 and is expected to reach USD 51.2 billion by 2032.
Get in Touch
