Orphan Drugs Market Size Analysis:
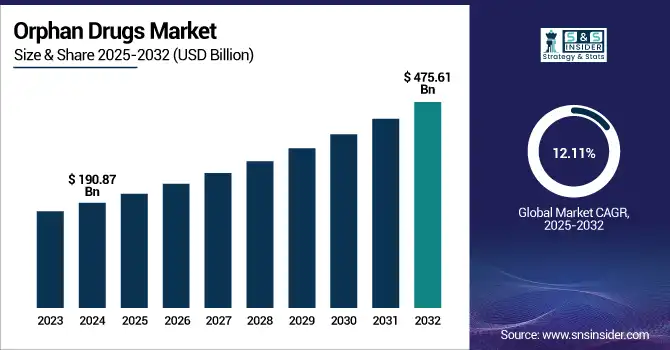
The Orphan Drugs Market size was valued at USD 190.87 billion in 2024 and is expected to reach USD 475.61 billion by 2032, growing at a CAGR of 12.11% over 2025-2032.
The global orphan drugs market is undergoing a strong evolution due to an increasing number of rare disease diagnoses, research funding, and regulatory pathways. With more than 7,000 known rare diseases and an estimated 400 million individuals affected globally, there is increasing demand for precision therapies addressing unmet needs among marginalized populations. The U.S. continues to lead the orphan drugs industry, driven in part by the speed and efficiency of the FDA’s ODD program, which has greenlit more than 600 treatments.
To Get more information on Orphan Drugs Market - Request Free Sample Report
For instance, Avidity Biosciences has received orphan drug designation in Japan for delpacibart etedesiran to treat myotonic dystrophy type 1, as Asian activity in rare disease therapies continues to accelerate.
Significantly, investment is already underway based on incentives, such as 7 years of market exclusivity, tax credits, and fee waivers. Applications for ODD soared by more than 35% from 2021 to 2024, with a new wave of biopharma involvement. Companies including Sanofi, Zydus, Beam Therapeutics, and Biodexa bagged recent ODDs for indications including sickle cell disease, ALS, and familial adenomatous polyposis. Growing R&D investment (over 40% of the pipeline budgets of large pharmaceutical companies) is also driving the orphan drugs market. A 2023 analysis by NORD finds that investment in rare disease R&D has been increasing at a compound annual growth rate of 15%. In addition, coordination of regulation among the U.S., EU, Japan, and other countries is promoting cross-border access and commercialization.
In May 2025, Sanofi’s Rilzabrutinib was granted FDA ODD for the treatment of sickle cell disease, its approval indicating the development of BTK inhibitors into rare blood diseases.
Global Orphan Drugs Market Dynamics:
Drivers:
-
Strategic Incentives, Innovation, and Increasing Rare Disease Diagnosis Propel Market Growth
The orphan drugs industry is driven by increased regulatory and financial incentives coupled with diagnostic advancements and investment in R&D. The FDA’s Orphan Drug Act, and corresponding policies in the EU and Japan, provide important incentives including seven to ten years market exclusivity, fast-track review, tax credits of up to 25% of clinical costs. These have spurred more than 1,100 orphan drug designations in the past decade. Additionally, improvements in diagnosis, such as genome sequencing, have facilitated the identification of rare genetic diseases that were previously undetectable.
For instance, if you are screening newborns genetically, the rate of detection of unusual metabolic diseases has risen by 30% in the last five years. Reportedly, more than 95% of rare diseases remain without an FDA-approved treatment, representing a high unmet medical need, according to Global Genes. 50% purchase a replay within 30 days. Novel modalities such as gene editing and RNA therapeutics are additionally driving pipeline diversity. These programmes include the National Institutes of Health’s (NIH) Rare Diseases Clinical Research Network (RDCRN), which has funded over 23 groups to focus on individual rare diseases, helping to drive growth in the global orphan drugs market.
Restraints:
-
High Development Costs, Limited Patient Populations, and Commercial Viability Concerns Hamper Market Expansion
The cost of developing orphan drugs can exceed USD 1 billion per molecule, reflecting the challenges of addressing patient groups that are rare and heterogeneous and that, with abridged clinical data, make for a challenging development pathway. An analysis in JAMA in 2023 found that orphan drugs, by the time of their approval, were about 4.5 times more expensive per patient per year than non-orphan drugs and that consequently, they faced access and reimbursement problems. Without significant patient numbers, large trials are difficult to organize, and long-term outcomes are hard to predict, something that can make investors nervous.
Despite that, it is also worth noting that even with speeding up regulations, over one-third of these orphan-designated drugs do not make it through Phase II/III due to a lack of efficacy and safety signals. Access is also not equal; patients in poor regions are not insured or are left waiting for a long time for therapies, as prices are negotiated. The supply chain complexity in orphan precision medicines, particularly in gene and cell therapies, exacerbates the challenge. Furthermore, as high-barrier-to-entry products, the life cycle of these products is lengthened by registration and approval regulations and REMS (Risk Evaluation and Mitigation Strategies). A lack of commercial infrastructure enables a disease model that is challenging for companies with fewer commercial assets to ramp production of niche therapies, limiting overall orphan drugs market growth and market share.
Orphan Drugs Market Segmentation Analysis:
By Therapy Type
The oncology segment dominated the market in 2024 and accounted for 38.7% of the orphan drugs market share. This is mainly attributed to the increasing prevalence of rare cancers such as glioblastoma, acute lymphoblastic leukemia, and neuroendocrine tumors, where treatment options are few and unmet needs are high. That also helped fuel growth in this segment, along with several approvals of precision oncology drugs, such as antibody-drug conjugates and CAR-T treatments.
Secondly, regulatory authorities, including the FDA and European Medicines Agency (EMA), have focused on providing orphan oncology drugs with fast-track designations, which shorten the time to market and scale of the same. The neurology segment, on the contrary, will be the fastest-growing segment, on account of the rise in the number of rare neurological disorders such as Duchenne muscular dystrophy and spinal muscular atrophy. New treatments in this realm are accelerating due to the advances in gene therapy, particularly with new AAV-vector technologies, and more clinical trials from companies including Biogen and Novartis.
By Drug Type
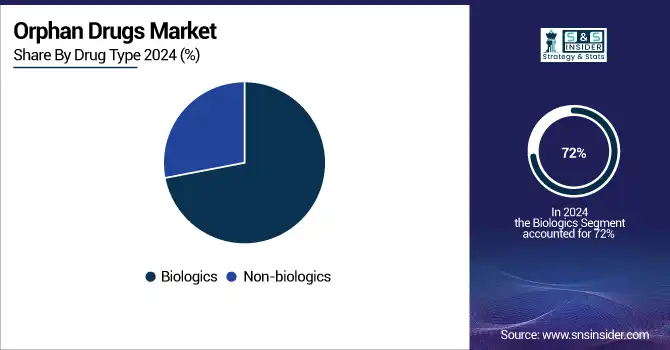
The biologics sector dominated the global orphan drugs market in 2024, accounting for around 72% of the market. This dominance is driven by the changing focus on monoclonal antibodies, gene therapies, enzyme replacement therapy, and the diseases associated with rare genetic and immunologic deficiencies. Although subject to 12 years of marketing exclusivity, and often difficult to manufacture due to their complex nature, biologics are the option of choice for orphan drug sponsors.
In the meantime, the fastest growing segment continues to be biologics, driven by ongoing innovations in protein engineering, cell therapy, and nucleic acid-based drugs, which are increasingly being utilized across a range of orphan indications, such as neuromuscular and hematological diseases.
By Distribution Channel
The hospital pharmacy segment dominated the orphan drugs market globally in 2024, with more than 58% share of the total market. The latter dominance can be attributed to the administration complexity and extensive monitoring of most OMPs, particularly the biologics and products requiring injection, which must be delivered in specialized care settings. Hospital pharmacies manage expensive medications through managed care programs, including proper management, reimbursement, and patient monitoring. The online pharmacy market is estimated to be the fastest-growing part of the market, though, with expanding patient demand for convenient services, increased digital health take-up, and DTP delivery models. Enhanced regulations and digital infrastructure, the improved regulations and digital infrastructure, and safe supply of some orally administered or at-home-administered orphan drugs will be facilitated through e-pharmacy platforms.
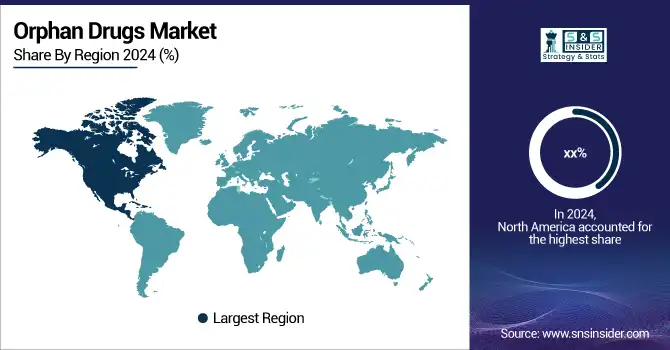
Regional Insights:
North America was the leading regional market in 2024, owing to its established regulatory framework, high level of healthcare expenditure, and extensive research and development (R&D) base. The U.S. orphan drugs market size was valued at USD 56.25 billion in 2024 and is expected to reach USD 123.48 billion by 2032, growing at a CAGR of 10.38% over 2025-2032. The U.S. is in the lead due to the Orphan Drug Act from the FDA, which has given more than 1,100 designations during the past 10 years. The U.S. biopharma firms are consuming diluted orphan drug pipelines, with more than 40% of new drug approvals in 2023 to be for orphan indications. Market penetration is further driven by favorable reimbursement and patient access programs. Canada is also increasingly developing rare diseases frameworks, such as its National Strategy for Drugs for Rare Diseases, introduced in 2023. Mexico is also starting to increase access to RRDD treatments by means of regulatory concordance and orphan diseases registries.
Europe is estimated to experience a high CAGR over the forecast period owing to the favorable EMA regulations and involvement of the EU Orphan Regulation. Some countries, such as Germany and France, lead the European ODNs market as they are equipped with well-developed reimbursement mechanisms and investment in public-private R and D. In Germany, approved orphan drugs are reimbursed over 90%. The U.K. is also broadening access post-Brexit with its independent MHRA fast-track pathways. In addition, efforts, such as the European Joint Programme on Rare Diseases (EJP RD), are promoting cross-border research that is speeding up early diagnosis and therapy development in Poland, Italy, and Spain, where disease registries and funding schemes are increasing.
The Asia Pacific region is the fastest-growing market globally, driven by a greater incidence of diseases, an increase in the number of clinical trials, and government support. Japan is still the biggest market in the region with a full and developed regulatory system and the incentives of support of the Ministry of Health, Labour and Welfare (MHLW) (10 years or market exclusivity and R&D support). In 2023, Japan contributed more than 40 orphan designations. China is the fastest growing, becoming only the second to add more than a couple of hundred rare diseases to its national essential drugs list, and new guidelines to encourage quicker regulatory review. India is moving ahead with a national rare disease policy and funds for research on orphan drugs, and countries such as South Korea, Singapore, and others are ramping up early access programs and rare disease databases.
Get Customized Report as per Your Business Requirement - Enquiry Now
Orphan Drugs Market Key Players:
Amgen Inc., Bayer AG, F. Hoffmann-La Roche Ltd, Alexion Pharmaceuticals Inc., Novo Nordisk A/S, Novartis AG, Bristol-Myers Squibb Company, AstraZeneca, Daiichi Sankyo Company, Limited, and GlaxoSmithKline plc are key players in the orphan drugs market.
Recent Developments in the Orphan Drugs Market:
In March 2025, the FDA granted orphan drug designation to radiprodil, developed by GRIN Therapeutics, for the treatment of GRIN-related neurodevelopmental disorder (NDD). Radiprodil acts as a negative allosteric modulator targeting the NMDA receptor subtype 2B and is set to enter a pivotal Phase 3 trial in 2025.
In August 2024, the FDA granted orphan drug designation to NXP800, a novel GCN2 kinase activator developed by Nuvectis Pharma, for the treatment of ARID1a-deficient ovarian, fallopian tube, and primary peritoneal cancers.
| Report Attributes | Details |
|---|---|
| Market Size in 2024 | USD 190.87 billion |
| Market Size by 2032 | USD 475.61 billion |
| CAGR | CAGR of 12.11% From 2025 to 2032 |
| Base Year | 2024 |
| Forecast Period | 2025-2032 |
| Historical Data | 2021-2023 |
| Report Scope & Coverage | Market Size, Segments Analysis, Competitive Landscape, Regional Analysis, DROC & SWOT Analysis, Forecast Outlook |
| Key Segments | • By Therapy Type (Oncology, Hematology, Neurology, Endocrinology, Cardiovascular, Respiratory, Immunotherapy, Infectious Diseases, and Others) • By Drug Type (Biologics, Non-biologics) • By Distribution Channel (Hospital Pharmacy, Retail Pharmacy, Online Pharmacy, and Others) |
| Regional Analysis/Coverage | North America (US, Canada, Mexico), Europe (Germany, France, UK, Italy, Spain, Poland, Turkey, Rest of Europe), Asia Pacific (China, India, Japan, South Korea, Singapore, Australia, Rest of Asia Pacific), Middle East & Africa (UAE, Saudi Arabia, Qatar, South Africa, Rest of Middle East & Africa), Latin America (Brazil, Argentina, Rest of Latin America) |
| Company Profiles | Amgen Inc., Bayer AG, F. Hoffmann-La Roche Ltd, Alexion Pharmaceuticals Inc., Novo Nordisk A/S, Novartis AG, Bristol-Myers Squibb Company, AstraZeneca, Daiichi Sankyo Company, Limited, and GlaxoSmithKline plc |
Frequently Asked Questions
Ans: North America dominated the orphan drugs market.
Ans: The cost of developing orphan drugs can exceed USD 1 billion per molecule, reflecting the challenges of addressing patient groups that are rare and heterogeneous and that, with abridged clinical data, make for a challenging development pathway.
Ans: The orphan drugs industry is driven by increased regulatory and financial incentives coupled with diagnostic advancements and investment in R&D.
Ans: The market is expected to reach USD 475.61 billion by 2032, increasing from USD 190.87 billion in 2024.
Ans: The Orphan Drugs market is anticipated to grow at a CAGR of 12.11% from 2025 to 2032.
Get in Touch
