Get More Information on OTR Tires Market- Request Sample Report
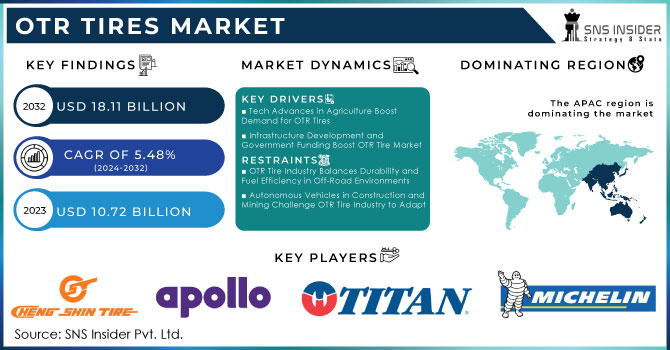
The OTR Tires Market size was valued at USD 10.72 billion in 2023, and is expected to reach USD 18.11 billion by 2032, and grow at a CAGR of 5.48% over the forecast period of 2024-2032.
The growing construction and mining industries are important, with a projected 15% rise in equipment needs anticipated in emerging economies. This leads to a significant rise in the need for tires designed specifically to endure the tough conditions present in these sectors. The increase in the global population has led to a higher demand for food production, causing a 40% rise in the utilization of heavy machinery on farms. This rise demands dependable OTR tires that can withstand tough agricultural environments. As per industry experts, remanufacturing old tires can greatly extend their lifespan, providing the opportunity to save as much as 70% in comparison to buying new tires. The focus on retreading shows a growing trend towards more cost-effective choices in the OTR tire sector.
SNS Insider predicts a strong 6.7% increase in construction spending in the United States in 2024, which could lead to higher demand for off-the-road (OTR) tires. On the other hand, changes in worldwide commodity prices have a substantial effect on the level of demand. An increase of 12% in rubber prices in Q2 2024 could encourage consumers to postpone replacing tires, affecting immediate demand. Government regulations also have a part to play. Strict regulations on emissions for off-road vehicles are driving manufacturers to develop fuel-efficient off-the-road tires. It is projected that by 2027, this shift will make up more than 30% of the automotive off-the-road tire market, influenced by regulations such as the EU's Stage EV emission standards. In conclusion, extreme weather events have the potential to interrupt the demand for OTR tires. For instance, an increase in floods and hurricanes may cause a temporary rise in the need for new tires for emergency vehicles and equipment used for disaster relief.
Drivers:
OTR tires are used on tractors, harvesters, and sprayers in the agricultural industry. Advancements in technology in agriculture, such as precision farming and self-driving equipment, continue to increase the need for OTR tires in the sector.
OTR tires are essential in various infrastructure projects such as roads, bridges, and buildings. Government funding for infrastructure development presents substantial growth potential for the OTR tire market.
Advancements could reduce downtime for equipment operators and improve productivity levels.
Enhancements in materials and construction methods have resulted in a notable 30% boost in tire lifespan, greatly cutting down on the time spent on repairs and replacements. Furthermore, advanced tread patterns with increased depth and self-cleaning capabilities have improved traction on various terrains by 25%, reducing slipping and increasing efficiency. Moreover, improvements in compounds with low rolling resistance have led to fuel efficiency increases of up to 10%, resulting in significant savings for operators. In addition to these fundamental enhancements, there is great potential for further innovative technologies in the future. Exciting advancements in self-repairing features and built-in tire monitoring technologies will continue to transform the OTR tire industry.
Restrains:
The OTR tire industry constantly struggle with maintaining durability for challenging off-road environments while also prioritizing fuel efficiency for budget-conscious operators.
The fast progress in autonomous vehicles in construction and mining poses a challenge for the OTR tire industry, prompting the need to adjust to potential changes in usage patterns.
Changes in the prices of raw materials, specifically rubber, lead to uncertain cost challenges for manufacturers of OTR tires.
Rubber, which is the main ingredient, goes through major changes because of factors such as weather affecting its growth in Southeast Asia, the leading region for production, and varying demand from the automotive industry. In North America, profit margins for OTR tire companies were squeezed as prices increased by an average of 9.39% in Q1 2024. Forecasting production costs and setting stable prices becomes challenging due to this volatility. Nevertheless, the sector is taking comfort in progress. The creation of High Flexural Strength (HFS) compounds is decreasing the dependence on natural rubber by integrating recycled materials such as tire crumb, reducing the dependency on unstable natural resources.
By Vehicle Type
Construction & Industrial Equipment has a significant market share of about 40%, mainly because loaders, dozers, and forklifts are in high demand in these industries. Mining is a close second at approximately 35%, since large haul trucks need unique OTR tires for heavy loads and tough conditions. About 20% of agricultural vehicles consist of tractors that require tires capable of navigating different terrains and weather conditions. The remaining 5% is represented by the segment known as "Others," which includes ATVs and specialty vehicles.
Progress is constantly transforming the off-the-road tire industry. Solid tires, which are especially favoured in the mining industry for their ability to resist punctures, are now being enhanced to provide better shock absorption, resulting in a more comfortable ride. Researchers are investigating biodegradable materials for a more sustainable future, as well as improving retreading technologies to prolong tire lifespan and decrease waste.
By Distribution Channel
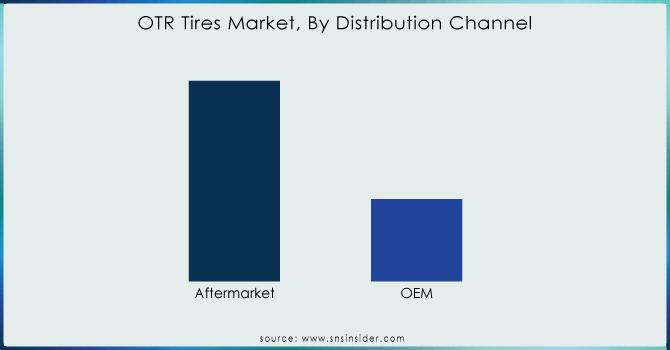
Controlling approximately 70% of the market, the aftermarket sector holds a strong advantage. The reason for OTR tires' dominance is the fact that they have a short lifespan due to the tough conditions they endure. These tires undergo regular testing in mining, agriculture, and construction settings, leading to a high demand for replacements. The OEM industry provides tires already mounted on new heavy equipment and makes up roughly 30% of the market. Experiencing rapid growth alongside increased investments in new machinery for construction, mining, and agriculture, this sector aligns with the production schedules of equipment manufacturers.
Need any customization research on OTR tires market - Enquiry Now
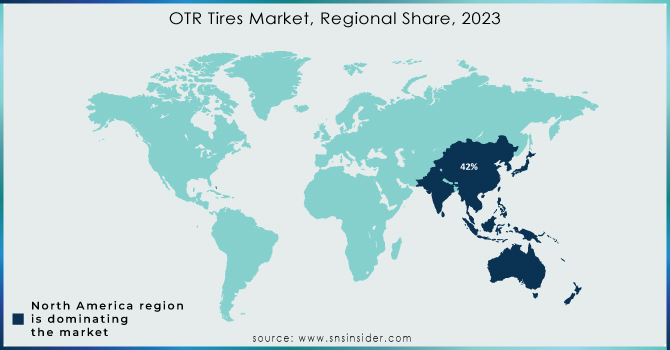
APAC region held the dominant share of 42% in 2023 in OTR tires market. China, a dominant force in the construction and mining industries, accounts for 40% of the demand due to its abundant mineral reserves and the "Made in China 2025" program. India is right behind at 25%, driven by a thriving agricultural industry and increasing infrastructure projects that are boosting the use of OTR tires. Nevertheless, the aftermarket sector is successful alongside the original equipment manufacturer sector with a share of almost 45%, underscoring the important function of post-purchase maintenance in maintaining the large fleet of machinery operational. Innovation is playing a prominent role as well, with developments such as self-repairing tires using sealants to fix punctures automatically, cutting down on downtime and expenses for operators of OTR vehicles.
Government spending on infrastructure projects such as road and building construction has seen a significant increase, with some countries reaching up to 70%. This results in a significant requirement for large equipment, driving the need for OTR tires. Additionally, progress in agriculture in these areas is causing a 60% increase in high-powered tractors, which is also boosting the demand for agricultural OTR tires. It is intriguing that there is an increasing trend towards retreading, where new rubber tread is added to old tires, resulting in potential cost savings of up to 50%. This tendency shows not only economic factors but also an increasing environmental awareness in the sector.
Michelin, Titan International, Apollo Tyres Ltd, Cheng Shin Tire, Bridgestone, Toyo Tire Corp, Goodyear, Continental AG, Pirelli & C S .P.A and others.
Michelin: Announced a significant investment of USD 750 million in their Lexington, South Carolina plant to expand radial earthmover tire production, targeting the growing construction equipment market in the Americas. This highlights their focus on radial tires, a trend gaining traction due to superior performance and durability.
Report Attributes | Details |
Market Size in 2023 | US$ 10.72 billion |
Market Size by 2032 | US$ 18.11 billion |
CAGR | CAGR of 5.48% From 2024 to 2032 |
Base Year | 2023 |
Forecast Period | 2024-2032 |
Historical Data | 2020-2022 |
Report Scope & Coverage | Market Size, Segments Analysis, Competitive Landscape, Regional Analysis, DROC & SWOT Analysis, Forecast Outlook |
Key Segments | • by Vehicle Type (Mining, Agricultural Vehicle, Construction & Industrial Equipment, Others) • by Construction Type (Radial, Bias, Belted Bias) • by Distribution Channel (Aftermarket, OEM) |
Regional Analysis/Coverage | North America (US, Canada, Mexico), Europe (Eastern Europe [Poland, Romania, Hungary, Turkey, Rest of Eastern Europe] Western Europe] Germany, France, UK, Italy, Spain, Netherlands, Switzerland, Austria, Rest of Western Europe]), Asia Pacific (China, India, Japan, South Korea, Vietnam, Singapore, Australia, Rest of Asia Pacific), Middle East & Africa (Middle East [UAE, Egypt, Saudi Arabia, Qatar, Rest of Middle East], Africa [Nigeria, South Africa, Rest of Africa], Latin America (Brazil, Argentina, Colombia, Rest of Latin America) |
Company Profiles | Cheng Shin Tire, Michelin, Titan International, Apollo Tyres Ltd, Continental AG, Bridgestone, Toyo Tire Corp, Goodyear, Pirelli & C S .P.A and others |
Key Drivers | • OTR tires are used on tractors, harvesters, and sprayers in the agricultural industry. Advancements in technology in agriculture, such as precision farming and self-driving equipment, continue to increase the need for OTR tires in the sector. • OTR tires are essential in various infrastructure projects such as roads, bridges, and buildings. Government funding for infrastructure development presents substantial growth potential for the OTR tire market. |
RESTRAINTS | • The OTR tire industry constantly struggle with maintaining durability for challenging off-road environments while also prioritizing fuel efficiency for budget-conscious operators. • The fast progress in autonomous vehicles in construction and mining poses a challenge for the OTR tire industry, prompting the need to adjust to potential changes in usage patterns. |
Ans: The OTR Tires Market size was valued at USD 10.72 billion in 2023, and is expected to reach USD 18.11 billion by 2032
Ans: Advancements have the potential to decrease the amount of time equipment operators are offline and enhance overall productivity.
Ans: Changes in the prices of raw materials, specifically rubber, lead to uncertain cost challenges for manufacturers of OTR tires.
Ans: The OTR tires market is studied in three segments by construction type, by vehicle type, and by distribution channel.
Ans: The OTR tires market is expected to grow at a CAGR of 5.48% over the forecast period of 2024-2032.
TABLE OF CONTENTS
1. Introduction
1.1 Market Definition
1.2 Scope
1.3 Research Assumptions
2. Industry Flowchart
3. Research Methodology
4. Market Dynamics
4.1 Drivers
4.2 Restraints
4.3 Opportunities
4.4 Challenges
5. Porter’s 5 Forces Model
6. Pest Analysis
7. OTR Tires Market Segmentation, By Construction Type
7.1 Introduction
7.2 Radial
7.3 Bias
7.4 Belted Bias
8. OTR Tires Market Segmentation, By Vehicle Type
8.1 Introduction
8.2 Mining
8.3 Agricultural Vehicle
8.4 Construction & Industrial Equipment
8.5 Others
9. OTR Tires Market Segmentation, By Distribution Channel
9.1 Introduction
9.2 Aftermarket
9.3 OEM
10. Regional Analysis
10.1 Introduction
10.2 North America
10.2.1 Trend Analysis
10.2.2 North America OTR Tires Market by Country
10.2.3 North America OTR Tires Market By Construction Type
10.2.4 North America OTR Tires Market By Vehicle Type
10.2.5 North America OTR Tires Market By Distribution Channel
10.2.6 USA
10.2.6.1 USA OTR Tires Market By Construction Type
10.2.6.2 USA OTR Tires Market By Vehicle Type
10.2.6.3 USA OTR Tires Market By Distribution Channel
10.2.7 Canada
10.2.7.1 Canada OTR Tires Market By Construction Type
10.2.7.2 Canada OTR Tires Market By Vehicle Type
10.2.7.3 Canada OTR Tires Market By Distribution Channel
10.2.8 Mexico
10.2.8.1 Mexico OTR Tires Market By Construction Type
10.2.8.2 Mexico OTR Tires Market By Vehicle Type
10.2.8.3 Mexico OTR Tires Market By Distribution Channel
10.3 Europe
10.3.1 Trend Analysis
10.3.2 Eastern Europe
10.3.2.1 Eastern Europe OTR Tires Market by Country
10.3.2.2 Eastern Europe OTR Tires Market By Construction Type
10.3.2.3 Eastern Europe OTR Tires Market By Vehicle Type
10.3.2.4 Eastern Europe OTR Tires Market By Distribution Channel
10.3.2.5 Poland
10.3.2.5.1 Poland OTR Tires Market By Construction Type
10.3.2.5.2 Poland OTR Tires Market By Vehicle Type
10.3.2.5.3 Poland OTR Tires Market By Distribution Channel
10.3.2.6 Romania
10.3.2.6.1 Romania OTR Tires Market By Construction Type
10.3.2.6.2 Romania OTR Tires Market By Vehicle Type
10.3.2.6.4 Romania OTR Tires Market By Distribution Channel
10.3.2.7 Hungary
10.3.2.7.1 Hungary OTR Tires Market By Construction Type
10.3.2.7.2 Hungary OTR Tires Market By Vehicle Type
10.3.2.7.3 Hungary OTR Tires Market By Distribution Channel
10.3.2.8 Turkey
10.3.2.8.1 Turkey OTR Tires Market By Construction Type
10.3.2.8.2 Turkey OTR Tires Market By Vehicle Type
10.3.2.8.3 Turkey OTR Tires Market By Distribution Channel
10.3.2.9 Rest of Eastern Europe
10.3.2.9.1 Rest of Eastern Europe OTR Tires Market By Construction Type
10.3.2.9.2 Rest of Eastern Europe OTR Tires Market By Vehicle Type
10.3.2.9.3 Rest of Eastern Europe OTR Tires Market By Distribution Channel
10.3.3 Western Europe
10.3.3.1 Western Europe OTR Tires Market by Country
10.3.3.2 Western Europe OTR Tires Market By Construction Type
10.3.3.3 Western Europe OTR Tires Market By Vehicle Type
10.3.3.4 Western Europe OTR Tires Market By Distribution Channel
10.3.3.5 Germany
10.3.3.5.1 Germany OTR Tires Market By Construction Type
10.3.3.5.2 Germany OTR Tires Market By Vehicle Type
10.3.3.5.3 Germany OTR Tires Market By Distribution Channel
10.3.3.6 France
10.3.3.6.1 France OTR Tires Market By Construction Type
10.3.3.6.2 France OTR Tires Market By Vehicle Type
10.3.3.6.3 France OTR Tires Market By Distribution Channel
10.3.3.7 UK
10.3.3.7.1 UK OTR Tires Market By Construction Type
10.3.3.7.2 UK OTR Tires Market By Vehicle Type
10.3.3.7.3 UK OTR Tires Market By Distribution Channel
10.3.3.8 Italy
10.3.3.8.1 Italy OTR Tires Market By Construction Type
10.3.3.8.2 Italy OTR Tires Market By Vehicle Type
10.3.3.8.3 Italy OTR Tires Market By Distribution Channel
10.3.3.9 Spain
10.3.3.9.1 Spain OTR Tires Market By Construction Type
10.3.3.9.2 Spain OTR Tires Market By Vehicle Type
10.3.3.9.3 Spain OTR Tires Market By Distribution Channel
10.3.3.10 Netherlands
10.3.3.10.1 Netherlands OTR Tires Market By Construction Type
10.3.3.10.2 Netherlands OTR Tires Market By Vehicle Type
10.3.3.10.3 Netherlands OTR Tires Market By Distribution Channel
10.3.3.11 Switzerland
10.3.3.11.1 Switzerland OTR Tires Market By Construction Type
10.3.3.11.2 Switzerland OTR Tires Market By Vehicle Type
10.3.3.11.3 Switzerland OTR Tires Market By Distribution Channel
10.3.3.12 Austria
10.3.3.12.1 Austria OTR Tires Market By Construction Type
10.3.3.12.2 Austria OTR Tires Market By Vehicle Type
10.3.3.12.3 Austria OTR Tires Market By Distribution Channel
10.3.3.13 Rest of Western Europe
10.3.3.13.1 Rest of Western Europe OTR Tires Market By Construction Type
10.3.3.13.2 Rest of Western Europe OTR Tires Market By Vehicle Type
10.3.3.13.3 Rest of Western Europe OTR Tires Market By Distribution Channel
10.4 Asia-Pacific
10.4.1 Trend Analysis
10.4.2 Asia-Pacific OTR Tires Market by Country
10.4.3 Asia-Pacific OTR Tires Market By Construction Type
10.4.4 Asia-Pacific OTR Tires Market By Vehicle Type
10.4.5 Asia-Pacific OTR Tires Market By Distribution Channel
10.4.6 China
10.4.6.1 China OTR Tires Market By Construction Type
10.4.6.2 China OTR Tires Market By Vehicle Type
10.4.6.3 China OTR Tires Market By Distribution Channel
10.4.7 India
10.4.7.1 India OTR Tires Market By Construction Type
10.4.7.2 India OTR Tires Market By Vehicle Type
10.4.7.3 India OTR Tires Market By Distribution Channel
10.4.8 Japan
10.4.8.1 Japan OTR Tires Market By Construction Type
10.4.8.2 Japan OTR Tires Market By Vehicle Type
10.4.8.3 Japan OTR Tires Market By Distribution Channel
10.4.9 South Korea
10.4.9.1 South Korea OTR Tires Market By Construction Type
10.4.9.2 South Korea OTR Tires Market By Vehicle Type
10.4.9.3 South Korea OTR Tires Market By Distribution Channel
10.4.10 Vietnam
10.4.10.1 Vietnam OTR Tires Market By Construction Type
10.4.10.2 Vietnam OTR Tires Market By Vehicle Type
10.4.10.3 Vietnam OTR Tires Market By Distribution Channel
10.4.11 Singapore
10.4.11.1 Singapore OTR Tires Market By Construction Type
10.4.11.2 Singapore OTR Tires Market By Vehicle Type
10.4.11.3 Singapore OTR Tires Market By Distribution Channel
10.4.12 Australia
10.4.12.1 Australia OTR Tires Market By Construction Type
10.4.12.2 Australia OTR Tires Market By Vehicle Type
10.4.12.3 Australia OTR Tires Market By Distribution Channel
10.4.13 Rest of Asia-Pacific
10.4.13.1 Rest of Asia-Pacific OTR Tires Market By Construction Type
10.4.13.2 Rest of Asia-Pacific OTR Tires Market By Vehicle Type
10.4.13.3 Rest of Asia-Pacific OTR Tires Market By Distribution Channel
10.5 Middle East & Africa
10.5.1 Trend Analysis
10.5.2 Middle East
10.5.2.1 Middle East OTR Tires Market by Country
10.5.2.2 Middle East OTR Tires Market By Construction Type
10.5.2.3 Middle East OTR Tires Market By Vehicle Type
10.5.2.4 Middle East OTR Tires Market By Distribution Channel
10.5.2.5 UAE
10.5.2.5.1 UAE OTR Tires Market By Construction Type
10.5.2.5.2 UAE OTR Tires Market By Vehicle Type
10.5.2.5.3 UAE OTR Tires Market By Distribution Channel
10.5.2.6 Egypt
10.5.2.6.1 Egypt OTR Tires Market By Construction Type
10.5.2.6.2 Egypt OTR Tires Market By Vehicle Type
10.5.2.6.3 Egypt OTR Tires Market By Distribution Channel
10.5.2.7 Saudi Arabia
10.5.2.7.1 Saudi Arabia OTR Tires Market By Construction Type
10.5.2.7.2 Saudi Arabia OTR Tires Market By Vehicle Type
10.5.2.7.3 Saudi Arabia OTR Tires Market By Distribution Channel
10.5.2.8 Qatar
10.5.2.8.1 Qatar OTR Tires Market By Construction Type
10.5.2.8.2 Qatar OTR Tires Market By Vehicle Type
10.5.2.8.3 Qatar OTR Tires Market By Distribution Channel
10.5.2.9 Rest of Middle East
10.5.2.9.1 Rest of Middle East OTR Tires Market By Construction Type
10.5.2.9.2 Rest of Middle East OTR Tires Market By Vehicle Type
10.5.2.9.3 Rest of Middle East OTR Tires Market By Distribution Channel
10.5.3 Africa
10.5.3.1 Africa OTR Tires Market by Country
10.5.3.2 Africa OTR Tires Market By Construction Type
10.5.3.3 Africa OTR Tires Market By Vehicle Type
10.5.3.4 Africa OTR Tires Market By Distribution Channel
10.5.3.5 Nigeria
10.5.3.5.1 Nigeria OTR Tires Market By Construction Type
10.5.3.5.2 Nigeria OTR Tires Market By Vehicle Type
10.5.3.5.3 Nigeria OTR Tires Market By Distribution Channel
10.5.3.6 South Africa
10.5.3.6.1 South Africa OTR Tires Market By Construction Type
10.5.3.6.2 South Africa OTR Tires Market By Vehicle Type
10.5.3.6.3 South Africa OTR Tires Market By Distribution Channel
10.5.3.7 Rest of Africa
10.5.3.7.1 Rest of Africa OTR Tires Market By Construction Type
10.5.3.7.2 Rest of Africa OTR Tires Market By Vehicle Type
10.5.3.7.3 Rest of Africa OTR Tires Market By Distribution Channel
10.6 Latin America
10.6.1 Trend Analysis
10.6.2 Latin America OTR Tires Market by country
10.6.3 Latin America OTR Tires Market By Construction Type
10.6.4 Latin America OTR Tires Market By Vehicle Type
10.6.5 Latin America OTR Tires Market By Distribution Channel
10.6.6 Brazil
10.6.6.1 Brazil OTR Tires Market By Construction Type
10.6.6.2 Brazil OTR Tires Market By Vehicle Type
10.6.6.3 Brazil OTR Tires Market By Distribution Channel
10.6.7 Argentina
10.6.7.1 Argentina OTR Tires Market By Construction Type
10.6.7.2 Argentina OTR Tires Market By Vehicle Type
10.6.7.3 Argentina OTR Tires Market By Distribution Channel
10.6.8 Colombia
10.6.8.1 Colombia OTR Tires Market By Construction Type
10.6.8.2 Colombia OTR Tires Market By Vehicle Type
10.6.8.3 Colombia OTR Tires Market By Distribution Channel
10.6.9 Rest of Latin America
10.6.9.1 Rest of Latin America OTR Tires Market By Construction Type
10.6.9.2 Rest of Latin America OTR Tires Market By Vehicle Type
10.6.9.3 Rest of Latin America OTR Tires Market By Distribution Channel
11. Company Profiles
11.1 Michelin
11.1.1 Company Overview
11.1.2 Financial
11.1.3 Product/ Services Offered
11.1.4 The SNS View
11.2 Titan International
11.2.1 Company Overview
11.2.2 Financial
11.2.3 Product/Services Offered
11.2.4 The SNS View
11.3 Apollo Tyres Ltd
11.3.1 Company Overview
11.3.2 Financial
11.3.3 Product/Services Offered
11.3.4 The SNS View
11.4 Cheng Shin Tire
11.4.1 Company Overview
11.4.2 Financial
11.4.3 Product/Services Offered
11.4.4 The SNS View
11.5 Bridgestone
11.5.1 Company Overview
11.5.2 Financial
11.5.3 Product/Services Offered
11.5.4 The SNS View
11.6 Toyo Tire Corp
11.6.1 Company Overview
11.6.2 Financial
11.6.3 Product/Services Offered
11.6.4 The SNS View
11.7 Goodyear
11.7.1 Company Overview
11.7.2 Financial
11.7.3 Product/Services Offered
11.7.4 The SNS View
11.8 Continental AG
11.8.1 Company Overview
11.8.2 Financial
11.8.3 Product/Services Offered
11.8.4 The SNS View
11.9 Pirelli & C S .P.A
11.9.1 Company Overview
11.9.2 Financial
11.9.3 Product/Services Offered
11.9.4 The SNS View
11.10 Others
11.10.1 Company Overview
11.10.2 Financial
11.10.3 Product/Services Offered
11.10.4 The SNS View
12. Competitive Landscape
12.1 Competitive Benchmarking
12.2 Market Share Analysis
12.3 Recent Developments
12.3.1 Industry News
12.3.2 Company News
12.3.3 Mergers & Acquisitions
13. Use Case and Best Practices
14. Conclusion
An accurate research report requires proper strategizing as well as implementation. There are multiple factors involved in the completion of good and accurate research report and selecting the best methodology to compete the research is the toughest part. Since the research reports we provide play a crucial role in any company’s decision-making process, therefore we at SNS Insider always believe that we should choose the best method which gives us results closer to reality. This allows us to reach at a stage wherein we can provide our clients best and accurate investment to output ratio.
Each report that we prepare takes a timeframe of 350-400 business hours for production. Starting from the selection of titles through a couple of in-depth brain storming session to the final QC process before uploading our titles on our website we dedicate around 350 working hours. The titles are selected based on their current market cap and the foreseen CAGR and growth.
The 5 steps process:
Step 1: Secondary Research:
Secondary Research or Desk Research is as the name suggests is a research process wherein, we collect data through the readily available information. In this process we use various paid and unpaid databases which our team has access to and gather data through the same. This includes examining of listed companies’ annual reports, Journals, SEC filling etc. Apart from this our team has access to various associations across the globe across different industries. Lastly, we have exchange relationships with various university as well as individual libraries.
Step 2: Primary Research
When we talk about primary research, it is a type of study in which the researchers collect relevant data samples directly, rather than relying on previously collected data. This type of research is focused on gaining content specific facts that can be sued to solve specific problems. Since the collected data is fresh and first hand therefore it makes the study more accurate and genuine.
We at SNS Insider have divided Primary Research into 2 parts.
Part 1 wherein we interview the KOLs of major players as well as the upcoming ones across various geographic regions. This allows us to have their view over the market scenario and acts as an important tool to come closer to the accurate market numbers. As many as 45 paid and unpaid primary interviews are taken from both the demand and supply side of the industry to make sure we land at an accurate judgement and analysis of the market.
This step involves the triangulation of data wherein our team analyses the interview transcripts, online survey responses and observation of on filed participants. The below mentioned chart should give a better understanding of the part 1 of the primary interview.
Part 2: In this part of primary research the data collected via secondary research and the part 1 of the primary research is validated with the interviews from individual consultants and subject matter experts.
Consultants are those set of people who have at least 12 years of experience and expertise within the industry whereas Subject Matter Experts are those with at least 15 years of experience behind their back within the same space. The data with the help of two main processes i.e., FGDs (Focused Group Discussions) and IDs (Individual Discussions). This gives us a 3rd party nonbiased primary view of the market scenario making it a more dependable one while collation of the data pointers.
Step 3: Data Bank Validation
Once all the information is collected via primary and secondary sources, we run that information for data validation. At our intelligence centre our research heads track a lot of information related to the market which includes the quarterly reports, the daily stock prices, and other relevant information. Our data bank server gets updated every fortnight and that is how the information which we collected using our primary and secondary information is revalidated in real time.
Step 4: QA/QC Process
After all the data collection and validation our team does a final level of quality check and quality assurance to get rid of any unwanted or undesired mistakes. This might include but not limited to getting rid of the any typos, duplication of numbers or missing of any important information. The people involved in this process include technical content writers, research heads and graphics people. Once this process is completed the title gets uploader on our platform for our clients to read it.
Step 5: Final QC/QA Process:
This is the last process and comes when the client has ordered the study. In this process a final QA/QC is done before the study is emailed to the client. Since we believe in giving our clients a good experience of our research studies, therefore, to make sure that we do not lack at our end in any way humanly possible we do a final round of quality check and then dispatch the study to the client.
By Construction Type
Radial
Bias
Belted Bias
By Vehicle Type
Mining
Agricultural Vehicle
Construction & Industrial Equipment
Others
By Distribution Channel
Aftermarket
OEM
Request for Segment Customization as per your Business Requirement: Segment Customization Request
Regional Coverage:
Regional Coverage
North America
US
Canada
Mexico
Europe
Eastern Europe
Poland
Romania
Hungary
Turkey
Rest of Eastern Europe
Western Europe
Germany
France
UK
Italy
Spain
Netherlands
Switzerland
Austria
Rest of Western Europe
Asia Pacific
China
India
Japan
South Korea
Vietnam
Singapore
Australia
Rest of Asia Pacific
Middle East & Africa
Middle East
UAE
Egypt
Saudi Arabia
Qatar
Rest of Middle East
Africa
Nigeria
South Africa
Rest of Africa
Latin America
Brazil
Argentina
Colombia
Rest of Latin America
Request for Country Level Research Report: Country Level Customization Request
Available Customization
With the given market data, SNS Insider offers customization as per the company’s specific needs. The following customization options are available for the report:
Product Analysis
Criss-Cross segment analysis (e.g. Product X Application)
Product Matrix which gives a detailed comparison of product portfolio of each company
Geographic Analysis
Additional countries in any of the regions
Company Information
Detailed analysis and profiling of additional market players (Up to five)
The Electric Forklift Market size is expected to reach USD 134.28 Billion by 2031, the value for the year 2023 was recorded USD 43.3 Billion and the CAGR is expected to be 15.2% over the forecast year 2024-2031.
The Automotive NVH Materials Market Size was valued at USD 10.3 billion in 2023 and is expected to reach USD 16.76 billion by 2032 and grow at a CAGR of 5.5 % over the forecast period 2024-2032.
The Automotive Radiator Fan Market Size was valued at USD 8.3 billion in 2023 and is expected to reach USD 12.72 billion by 2031 and grow at a CAGR of 5.48% over the forecast period 2024-2031.
The Automotive Data Logger Market size was valued at USD 3.94 billion in 2023 and is expected to reach USD 7.80 billion by 2032 and grow at a CAGR of 7.89% over the forecast period 2024-2032.
The Automotive USB Power Delivery System Market Size was valued at USD 512.26 million in 2023 and is expected to reach USD 1925.51 million by 2031 and grow at a CAGR of 18% over the forecast period 2024-2031.
The Shared Mobility Market size was valued at USD 255.96 Billion in 2023 and is expected to reach USD 1167.54 Billion by 2032 and grow at a CAGR of 17.3% over the forecast period 2024-2032.
Hi! Click one of our member below to chat on Phone