Automotive Smart Tire Market Report Scope & Overview:
Get more information on Automotive Smart Tire Market - Request Sample Report
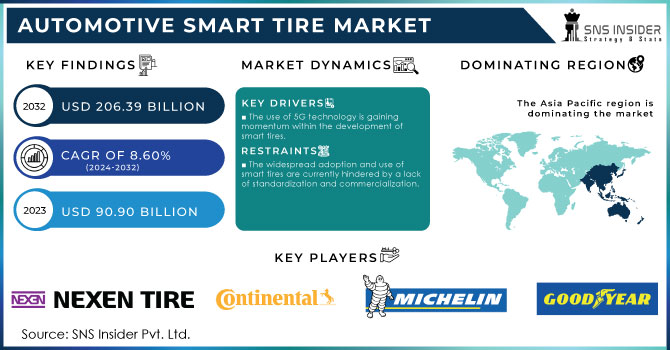
The Automotive Smart Tire Market Size was valued at USD 90.90 billion in 2023 and is expected to reach USD 206.39 billion by 2032 and grow at a CAGR of 8.60% over the forecast period 2024-2032.
The growth of the Automotive Smart Tire Market has been driven by vehicle telematics and the trend to shift toward electric vehicles. These have mainly stemmed from the increasing market need for real-time monitoring systems of tire conditions that lead to enhanced safety and improved performance efficiencies for vehicles. Smart tires with a tread-or-wear monitor are expected to reduce tire-related accidents by up to 30%. Moreover, there are regulatory mandates on tire performance and safety, especially in the U.S. and Europe, which are pushing manufacturers to include smart tire technologies; more than 40% of their new vehicles are expected to have these features by 2027. Another important fact is fuel efficiency, which is a growing concern. Smart tires can be created to enhance fuel savings from 5% to 10% using optimized tire pressure and minimum rolling resistance. The growing demand for connected and autonomous vehicles into the market also propels the growth of the next-generation tire market, since such vehicles require advanced technology in their tires to provide data-driven insights and predictive maintenance. By 2030, across the globe, more than 25% of the vehicle population is likely to have taken up smart tire capability, driven by these technological and regulatory trends.
The Automotive smart tire market is starting to race ahead, and 65% of new vehicles would carry real-time monitoring systems in the next decade. Such advances will offer improved safety and save fuel by 10-15%. Over the market share of 40% is now focusing on advanced sensors for data collection with respect to tread wear, temperature, and pressure. Close to 55% of manufacturers are making investments in smart tire solutions that can be integrated into connected vehicle ecosystems. AI-driven predictive maintenance is expected to decrease the occurrences of tire-related accidents by 20%, while sustainability efforts could stretch the life of tires by 30-40% by a decrease in environmental impact.
MARKET DYNAMICS:
KEY DRIVERS:
-
The use of 5G technology is gaining momentum within the development of smart tires.
-
The increasing use of connected vehicles is leading to a growing adoption of fleet management systems.
Government safety regulations have nailed the growth of the automotive smart tire market these regulations have pressurized manufacturers to adopt advanced technologies in tires, augment operations related to the overall safety and improved fuel efficiency. Thus, smart tires with real-time monitoring enabled by sensors are becoming standard in vehicles due to regulatory mandates. From the information, it is observed that approximately 65% of smart tire technologies will come with new vehicles features by 2026. Smart tire integration with improved handling and stability grew by 40% in advanced driver assistant systems. OEMs increased demand by 55% to comply with the set stringent standards. In general, smart tire technology plays an important role in improving road safety and regulatory needs, fueling market growth.
RESTRAINTS:
-
The widespread adoption and use of smart tires are currently hindered by a lack of standardization and commercialization.
Commercialization and the further prospering of smart tire technology in the automotive market are seriously challenged by a lack of standardization. High integration costs developing intelligent tire solutions that will slow down developments and inconsistent standards are keeping it to a small 15%-20% of the global automotive industry. Some 25-30% of potential adopters are discouraged by the lack of standardized protocols, while commercialization problems including supply chain limitations and high prices rank among key obstacles for 20-25%. Lacking a single set of regulations and cost reduction, this market stays fragmented and blocks the broader adoption levels clocked by other automotive innovations.
KEY MARKET SEGMENTS:
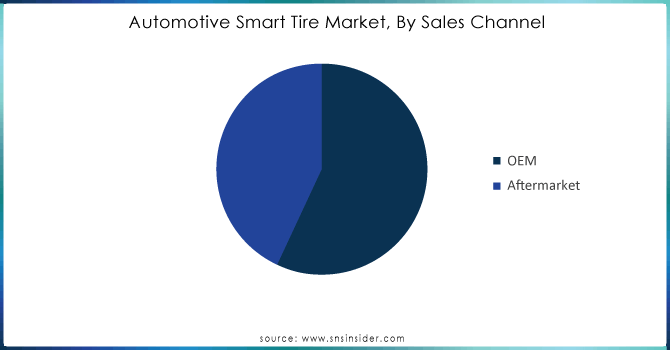
By Sales Channel:
Original Equipment Manufacturer (OEM) is the dominating sub-segment in the Automotive Smart Tire Market by sales channel holding between 60-70% of share. New car sales, a significant driver of the market, often come equipped with smart tires pre-installed by the manufacturer. This integration ensures compatibility with the vehicle's existing systems and optimizes performance from the start. Additionally, OEMs leverage economies of scale to negotiate better prices for smart tires, making them a more attractive option during vehicle production.
Get Customized Report as per your Business Requirement - Request For Customized Report
By Technology:
Pneumatic Tires is the dominating sub-segment in the Automotive Smart Tire Market by technology. Pneumatic tires, filled with compressed air, are the current industry standard for most vehicles. The existing infrastructure for manufacturing, maintenance, and repair is well-established for pneumatic tires. Additionally, the technology for integrating sensors and functionalities into pneumatic tires is more mature compared to non-pneumatic alternatives.
By Vehicle Type:
Passenger Cars is the dominating sub-segment in the Automotive Smart Tire Market by vehicle type holding above 60% of market share. Passenger cars constitute the largest segment within the overall automotive market. This naturally translates to a higher demand for smart tires in passenger vehicles compared to other segments.
Growing consumer awareness of safety and fuel efficiency benefits associated with smart tires further drives adoption in passenger cars.
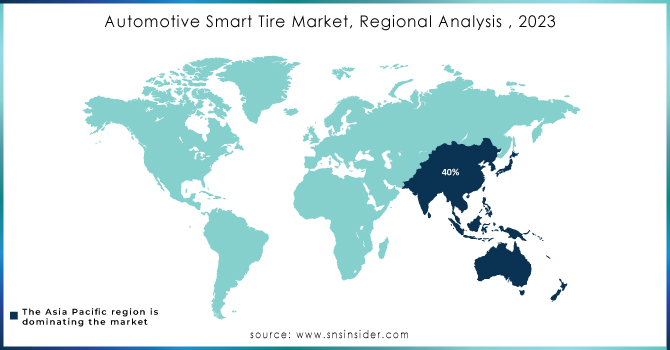
REGIONAL ANALYSES
The Asia Pacific is the dominating region in the Automotive Smart Tire Market holding approx. 40% of market share fueled by rapid economic growth and a burgeoning middle class with increasing purchasing power. Countries like China and India contribute significantly to this dominance. The rising demand for new vehicles and growing awareness of safety features are key drivers in this region.
North America is the second highest region in this market holding approx. 30% of market share which boasts a well-established automotive industry and a high adoption rate of new technologies. The presence of major car manufacturers and a strong focus on safety regulations contribute to its significant market share.
KEY PLAYERS
The major key players are Goodyear Tire & Rubber Co (USA), NEXEN TIRE Corporation (Korea), Continental AG (Germany), Michelin Group (France), Bridgestone Corporation (Japan), Sumitomo Rubber Industries, Ltd. (Japan), and Pirelli & C. S.p.A. (Italy) are other key players.
RECENT DEVELOPMENTS:
In June 2021 - Goodyear finalized the acquisition of Cooper Tire, merging two leading tire companies. This strengthens their global leadership with a broader product portfolio, enhanced services, and combined capabilities. The focus remains on prioritizing customers, cutting-edge technologies, and delivering high-quality tire solutions.
| Report Attributes | Details |
|---|---|
| Market Size in 2023 | US$ 90.90 Billion |
| Market Size by 2032 | US$ 206.39 Billion |
| CAGR | CAGR of 8.60% From 2024 to 2032 |
| Base Year | 2023 |
| Forecast Period | 2024-2032 |
| Historical Data | 2020-2022 |
| Report Scope & Coverage | Market Size, Segments Analysis, Competitive Landscape, Regional Analysis, DROC & SWOT Analysis, Forecast Outlook |
| Key Segments | • by Sales Channel (OEM, Aftermarket) • by Technology (Pneumatic Tire, Run-Flat Tire, Non-Pneumatic Tire) • by Vehicle Type (Commercial vehicles, Passenger cars, BEVs, HEVs, Plug-in Hybrid Vehicles) |
| Regional Analysis/Coverage | North America (US, Canada, Mexico), Europe (Eastern Europe [Poland, Romania, Hungary, Turkey, Rest of Eastern Europe] Western Europe] Germany, France, UK, Italy, Spain, Netherlands, Switzerland, Austria, Rest of Western Europe]), Asia Pacific (China, India, Japan, South Korea, Vietnam, Singapore, Australia, Rest of Asia Pacific), Middle East & Africa (Middle East [UAE, Egypt, Saudi Arabia, Qatar, Rest of Middle East], Africa [Nigeria, South Africa, Rest of Africa], Latin America (Brazil, Argentina, Colombia, Rest of Latin America) |
| Company Profiles | The Goodyear Tire & Rubber Co (USA), NEXEN TIRE Corporation (Korea), Continental AG (Germany), Michelin Group (France), Bridgestone Corporation (Japan), Sumitomo Rubber Industries, Ltd. (Japan), and Pirelli & C. S.p.A. (Italy) |
| Key Drivers | • The use of 5G technology is gaining momentum within the development of smart tires. • The increasing use of connected vehicles is leading to a growing adoption of fleet management systems. |
| RESTRAINTS | • The widespread adoption and use of smart tires are currently hindered by a lack of standardization and commercialization. |
Get in Touch
