Paper Chemicals Market Size & Overview:
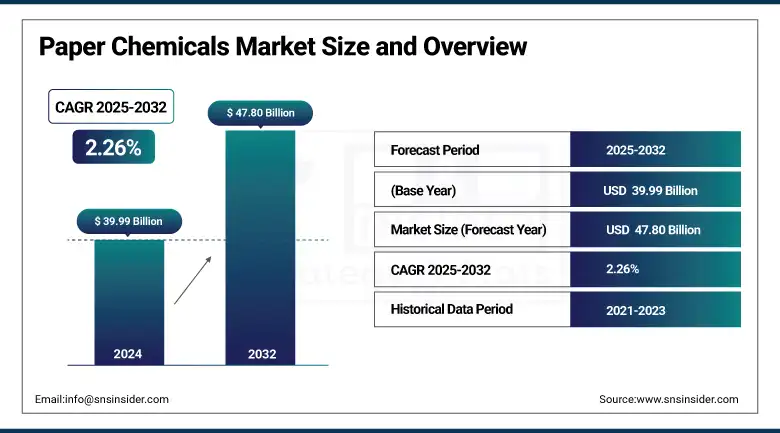
The Paper Chemicals Market size was valued at USD 39.99 billion in 2024 and is expected to reach USD 47.80 billion by 2032, growing at a CAGR of 2.26% over the forecast period of 2025-2032.
The paper chemicals market is changing with sustainability and digitalization influencing paper processing chemicals, paper surface treatment chemicals. Increased pressure from customers looking for more sustainable solutions is pushing paper chemicals players such as Kemira to develop environmentally-friendly offerings, such as the company’s introduction of ISCC-certified biomass-balanced wet-strength resins in 2020. Trends in the pulp and paper chemical industry are also affected by PFAS regulations, leading to collaborations like 2025´s Kemira-IFF partnership on renewable products. Specialty pulp & paper chemicals industry is upscaling courtesy of the growing e-commerce and on-demand printing.
To Get more information On Paper Chemicals Market - Request Free Sample Report
According to the American Forest & Paper Association, for paper and paperboard, the 2024 operating rate was 87.5%, and production grew 3.2%. In 2022, U.S. paper recycling achieved 67.9%, while old corrugated container recovery hit 93.6%.
These trends highlight the strong growth of the paper chemicals industry, based on the strong paper chemicals industry share and continued developments in the paper chemicals market research.
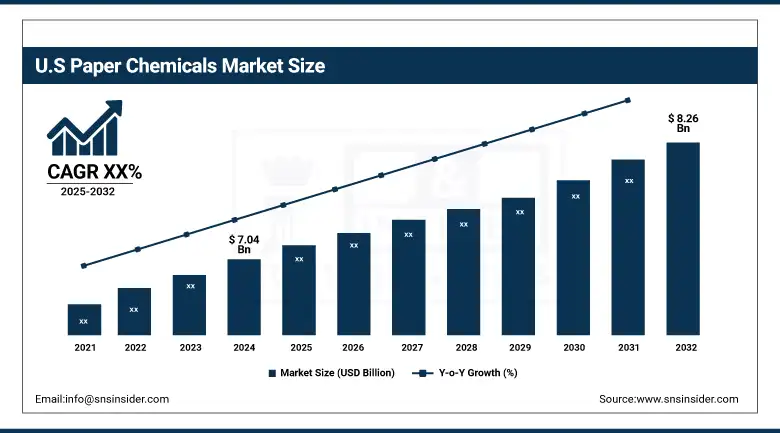
The United States leads North America’s paper chemicals market with a market size valued at USD 7.04 billion and is projected to reach a value of USD 8.26 billion by 2032 with a market share of 72.4%. The growth is supported by the presence of leading Paper Chemicals companies like Ecolab. In May 2025, Ecolab announced a 5% trade surcharge to address raw material cost volatility, showcasing the dynamic Paper Chemicals Market trends. This example illustrates the country’s influence on the regional market, with ongoing investments in sustainable paper processing chemicals and pulp and paper chemicals market segments driving market share expansion.
Paper Chemicals Market Drivers:
-
Expansion of sustainable packaging accelerates demand for specialty paper chemicals globally
Sustainable packaging movements are driving demand for the paper chemicals market by replacing non-recyclable products with recyclable ones. Key paper chemicals companies, including Kemira, introduced ISCC-certified renewable-based wet-strength resins in 2024, highlighting sustainable paper processing chemicals. The U.S. paperboard output grew 3.2% in 2024 on the back of packaging, the American Forest & Paper Association reports. These transitions in the specialty pulp and paper chemical market, and paper surface treatment chemicals, are leading to the growing share in the paper chemicals market globally.
-
Technological advancements in paper chemicals improve performance and recyclability
The key innovating chemicals & automation for surface treatment in paper is changing the market scenario of paper chemicals. That means day one for bio-based solutions for Kemira is 2024; it’s an indication of how paper chemicals companies are opening the recyclability without compromising on quality. American Forest & Paper Association and American Forest Foundation. U.S. paper recycling rose to 67.9% in 2022, fueled by enhanced paper processing chemicals. These trends are expanding the market of specialty pulp and paper chemical industry and increasing the size of the paper chemicals market, all of which are contributing to the progress of environmental legislation.
Paper Chemicals Market Restraints:
-
Increasing use of alternative materials restricts the paper chemicals market expansion
Growth in plastic and bioplastic packaging is slowing the paper chemicals market size. According to the U.S. Environmental Protection Agency, plastics represent nearly 30% of packaging waste but are evolving through biodegradable innovations. This trend diverts demand from paper-based products, impacting the pulp and paper chemicals market and reducing the paper chemicals market share in packaging. Paper chemicals companies must adapt quickly to compete with alternative materials.
Paper Chemicals Market Segmentation Analysis:
By Raw Material
Synthetic chemicals held a dominant position in the paper chemicals market in 2024, capturing 58.8% market share, driven by widespread industrial adoption and consistent performance in coating and sizing. The American Forest & Paper Association reported an 87.5% operating rate at us paper and paperboard mills in 2024, underscoring strong demand for these synthetic pulp and paper chemicals. This dominance reflects reliable supply chains and performance, reinforcing synthetic sizing and coating agents as core components in paper processing chemicals production.
Natural chemicals achieved the highest CAGR of 2.51% within raw materials in 2024, reflecting accelerating demand for biodegradable, eco‑friendly paper surface treatment chemicals. Regulatory phase-outs of PFAS in North America and Europe are catalyzing the adoption of biomass‑based solutions. Companies like Kemira are expanding sustainable pulp and paper chemicals solutions to meet this shift, driving paper chemicals market growth. This trend aligns with evolving environmental standards and consumer expectations, fueling innovation in the specialty pulp and paper chemical market.
By Type
Pulp chemicals dominated the paper chemicals market in 2024, accounting for 43.5% of market share, with bleaching agents as the key subsegment. The American Forest & Paper Association reported a 3.2% increase in containerboard and paperboard production last year, highlighting increased pulping activity and demand for bleaching chemicals. Bleaching remains essential in paper processing chemicals, and growth in packaging applications reinforces pulp chemicals’ role as a foundational driver in the pulp and paper chemicals market.
Functional chemicals posted the highest CAGR at 2.62% in 2024, propelled by wet‑strength resins and surface treatment additives. Kemira’s 2024 launch of ISCC‑certified biomass‑balanced wet‑strength resins illustrates the trend toward sustainable, high-performance solutions. These paper surface treatment chemicals enhance durability and recyclability in packaging and tissue paper applications. This dynamic reflects broader paper chemicals market trends emphasizing eco‑innovation, driving the specialty pulp and paper chemical market toward customized functional solutions.
By Form
Specialty chemicals commanded a 53.9% share in 2024, propelled by tailored coatings and additives for packaging and printing papers. U.S. paper recycling reached 67.9% in 2022, and evolving quality standards are increasing reliance on high-performance chemical solutions that support recyclability. This shift underscores specialty chemicals’ dominance in enhancing paper surface treatment chemicals and processing capabilities. These advanced formulations meet market demands for lightweight, high-strength papers, reinforcing trends in the paper chemicals market analysis toward specialty innovation.
Commodity chemicals achieved a 2.37% CAGR in 2024, propelled by widespread use of bulk bleaching agents and caustic materials. The AF&PA reported an 87.5% operating rate in U.S. mills and stable containerboard production, highlighting consistent consumption of high-volume processing chemicals. These reliable, cost‑effective raw materials maintain core operations in pulp and paper manufacturing. Continued demand for commodity-grade bleaching and pulping aids underscores the segment’s importance in supporting large-scale paper processing chemicals production.
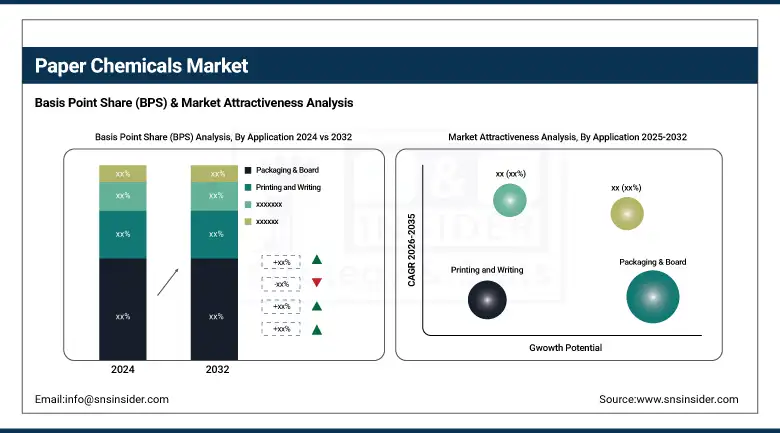
By Application
Packaging & board dominated with a 48.7% share in 2024, supported by growing demand for containerboard coatings and strength additives. As reported by AF&PA, us containerboard production rose 3.2% in 2024, reflecting e‑commerce expansion. Advanced paper processing chemicals enhance packaging durability, moisture resistance, and printability. Packaging’s leading position highlights its role in driving the paper chemicals market share and aligns with regulatory and consumer preferences for sustainable, high-performance paper-based packaging solutions.
Hygiene products achieved the highest CAGR of 3.05% in 2024, led by absorbency and softening additives for tissue and towel applications. Rising consumer hygiene standards and pandemic awareness boosted demand for advanced paper surface treatment chemicals. The AF&PA reported strong tissue sector investments and increasing tissue capacity utilization. These trends confirm hygiene’s role as the quickest-growing application, reinforcing the specialty pulp and paper chemical market’s focus on functional innovation.
Paper Chemicals Market Regional Outlook:
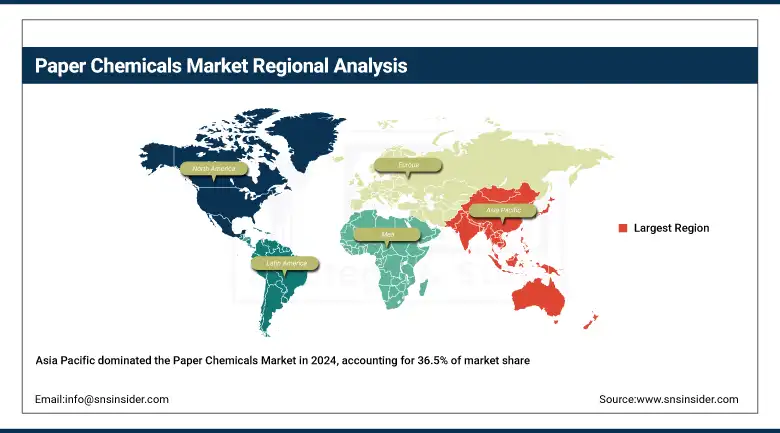
Asia Pacific is the dominating and fastest-growing region in the Paper Chemicals Market, commanding a 36.5% share with the highest CAGR of 2.54%. Rapid industrialization, government incentives for eco-friendly paper processing chemicals, and increased demand for packaging and hygiene products drive the region’s pulp and paper chemicals market. Countries here are adopting sustainable practices that align with global Paper Chemicals Market trends.
Get Customized Report as per Your Business Requirement - Enquiry Now
China is the leading country within the Asia Pacific’s Paper Chemicals Market. Suzano, a major pulp producer, was recognized in the 2025 Fortune China ESG Impact List for its sustainability efforts, reflecting strong commitments to specialty pulp and paper chemicals. This recognition underlines China’s accelerating market growth and its influence on shaping global Paper Chemicals Market trends through sustainable practices and innovative paper surface treatment chemicals.
North America is the second-dominant region in the Paper Chemicals Market, holding a significant market share of 24.3%. The region benefits from advanced manufacturing capabilities and a strong emphasis on sustainable paper processing chemicals and paper surface treatment chemicals. The region’s regulatory environment supports innovation in the specialty pulp and paper chemicals market, enhancing overall market growth. For instance, the U.S. Environmental Protection Agency (EPA) continues to promote eco-friendly industrial practices, aiding market growth.
Europe holds the third dominating position with a significant paper chemicals market share of 21.8%. The region’s strong environmental regulations and push for sustainable packaging solutions promote growth in the specialty pulp and paper chemical market. European initiatives, such as the EU Green Deal, stimulate demand for eco-friendly paper processing chemicals, positively impacting the Paper Chemicals Market size.
Germany stands out as the dominant country in Europe’s Paper Chemicals Market due to its well-established pulp and paper industry. For example, Mondi’s €400 million investment in a new paper machine at its Štětí mill in May 2025 highlights the country’s focus on modernizing production with sustainable pulp and paper chemicals. This investment demonstrates Germany’s pivotal role in Europe’s paper chemicals market growth and evolving trends.
Paper Chemicals Market Companies are:
The major paper chemicals market competitors include Kemira Oyj, BASF SE, Solenis, Ecolab Inc. (via Nalco Water), Ashland Global Holdings Inc., Buckman Laboratories International Inc., Harima Chemicals Group, Inc., Archroma, SNF Group, and Clariant AG.
Recent Developments:
-
In March 2025, Kemira announced a capacity expansion in Thailand to produce 100,000 tons of paper chemicals annually by 2026, aiming to enhance supply across Southeast Asia and India with sustainable solutions.
-
In June 2024, Solenis partnered with PhaBuilder Biotechnology to develop PHA-based biodegradable paper packaging solutions, advancing eco-friendly innovations in response to rising global sustainability demands.
| Report Attributes | Details |
|---|---|
| Market Size in 2024 | USD 39.99 billion |
| Market Size by 2032 | USD 47.80 billion |
| CAGR | CAGR of 2.26% From 2025 to 2032 |
| Base Year | 2024 |
| Forecast Period | 2025-2032 |
| Historical Data | 2021-2023 |
| Report Scope & Coverage | Market Size, Segments Analysis, Competitive Landscape, Regional Analysis, DROC & SWOT Analysis, Forecast Outlook |
| Key Segments | •By Raw Material (Natural Chemicals, Synthetic Chemicals) •By Type (Pulp Chemicals, Process Chemicals, Functional Chemicals) •By Form (Specialty Chemicals, Commodity Chemicals) •By Application (Packaging & Board, Printing and Writing, Hygiene Products, Newsprint, Others) |
| Regional Analysis/Coverage | North America (US, Canada, Mexico), Europe (Germany, France, UK, Italy, Spain, Poland, Turkey, Rest of Europe), Asia Pacific (China, India, Japan, South Korea, Singapore, Australia, Rest of Asia Pacific), Middle East & Africa (UAE, Saudi Arabia, Qatar, South Africa, Rest of Middle East & Africa), Latin America (Brazil, Argentina, Rest of Latin America) |
| Company Profiles | Kemira Oyj, BASF SE, Solenis, Ecolab Inc. (via Nalco Water), Ashland Global Holdings Inc., Buckman Laboratories International Inc., Harima Chemicals Group, Inc., Archroma, SNF Group, and Clariant AG |
Frequently Asked Questions
Prominent Paper Chemicals Market companies include Kemira, Solenis, Ecolab, BASF, Buckman, and Clariant, all driving innovation in specialty pulp and paper chemicals globally.
Asia Pacific led the Paper Chemicals Market in 2024 with a 36.5% share and the highest CAGR of 2.54%, driven by packaging, e-commerce, and regulatory eco-initiatives.
Synthetic chemicals led the Paper Chemicals Market in 2024 with 58.8% share, supported by consistent performance in coating, sizing, and pulp and paper chemical processes.
The Paper Chemicals Market is expected to reach USD 47.80 billion by 2032, driven by innovation in paper surface treatment chemicals and sustainable processing solutions.
The Paper Chemicals Market size in 2024 was valued at USD 39.99 billion, reflecting strong demand across the packaging, hygiene, and specialty pulp and paper chemicals segments.
Get in Touch
