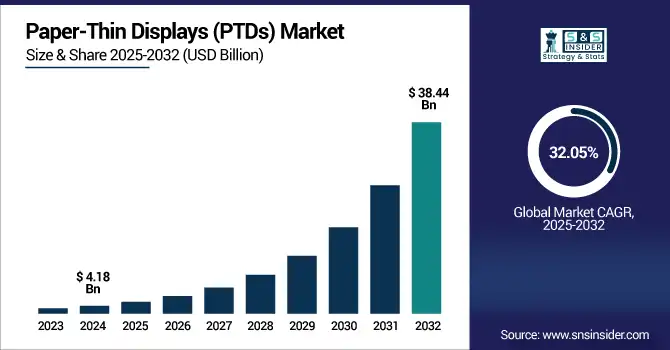
The Paper-Thin Displays (PTDs) Market size was valued at USD 4.18 billion in 2024 and is expected to reach USD 38.44 billion by 2032, growing at a CAGR of 32.05% over the forecast period of 2025-2032.
Paper-Thin Displays (PTDs) Market Trends are leading innovation in foldable and rollable smartphones, smart wearables, and automotive infotainment dashboards. Sustainable, lightweight materials and transparent e‑paper solutions boost adoption across consumer electronics.
Paper-Thin Displays (PTDs) market growth is attributed to rapidly developing innovations particularly in OLED and e‑paper that allow for extremely lightweight, bendable, energy-conserving monitors. The growing consumer demand for slim and compact electronics such as foldable phones, tablets, wearables, and IoT devices is propelling adoption. Complemented by ongoing design trends, such as automotive infotainment and smart packaging, and healthcare applications, and sustainable trends, these drivers will accelerate PTD penetration across multiple industries for new use cases. in thin, lightweight and durable displays.
Global shipments of wearables, such as smartwatches and smart rings increased steadily in 2024, with smart rings alone growing over 30% year-over-year.
The U.S Paper-Thin Displays (PTDs) Market size was valued at USD 1.29 billion in 2024 and is expected to reach USD 11.56 billion by 2032, growing at a CAGR of 31.62% over the forecast period of 2025-2032. The U.S. Paper-Thin Displays (PTDs) Market Growth fueled by rapid advancements in flexible OLED &E-PAPER technologies, increasing integration in wearables, smart packaging, automotive infotainment and energy-efficient digital signage.
Drivers:
OLED and E-Paper Advancements Accelerate Adoption of Paper-Thin Displays Across Consumer Automotive and Healthcare Sectors
Rising developments in the OLED (organic light-emitting diode) and e-paper technologies to facilitate ultra-light, bendable, & energy-efficient display solutions is the leading driving factor for the global Paper-Thin Displays (PTDs) market. The increasing need for the compact and thin form factor in consumer electronics including foldable smartphones, smartwatches, tablets, and e-readers is accelerating the adoption of PTDs. These displays are also being used in various industries, such as automotive and healthcare for next-gen infotainment systems, wearable health monitors, and digital dashboards.
Flexible and foldable OLED panels achieved 24 million shipments in 2024, with another projection of 38 million units in 2025, marking a 27% rise in foldable OLED adoption.
Restraints:
Environmental Sensitivity and Display Limitations Restrain Broader Adoption of Paper-Thin Displays in Demanding Applications
The global Paper-Thin Displays (PTDs) market has few restraints and limited durability in extreme environmental conditions is one of the crucial restraints for global Paper-Thin Displays (PTDs) market. These conditions are effective in result of high humidity, high UV light, or mechanical stress, which this condition could degrade PTDs especially if the PTDs based on organic and flexible materials. This limits their use in outdoor and industrial situations, where performance must be uncompromised. Also, the difficulties in hardware to achieve a high-resolution and colors make it difficult for e-paper displays to be used in media-rich applications.
Opportunities:
Emerging Applications and Innovations Driving Widespread Adoption of Paper-Thin Displays Across Multiple Growing Sectors
Expansion of Paper-Thin Displays (PTDs) deployment in nascent applications, such as intelligent packaging, light-guiding transparent retail signage, and future resolvable IoT interfaces reviews the opportunities. Logistics, retail, and education are on the rise due to the rising focus on sustainability and low power consumption of e-paper displays. In addition, innovative materials science coupled with developing printed electronics will allow the mass production of cost-effective PTD in a variety of sectors.
As of June 2025, China’s postal system is aiming for 1 billion recyclable e‑paper packaging sheets in use, each supporting up to 100,000 refreshes, saving over 10 tonnes of paper annually at outlets.
Challenges:
Challenges Hindering Seamless Integration and Scalable Adoption of Paper-Thin Displays in Modern Electronics
Integration of PTDs into current electronic systems, such as oscillators and logic gates presents some challenges in terms of matching traditional circuitry with Paper-Thin Displays (PTDs) and are particularly challenging when attaching to existing connectors. Scalability of manufacturing ultra-thin and flexible displays is still difficult, especially regarding the uniformity of materials and devices over large areas. Additionally, emerging materials face regulatory and recycling challenges that also limit more widespread usage.
By Technology
OLED held the Paper-Thin Displays (PTDs) market share of 46.4% in 2024 and is projected to experience the highest CAGR over 2025-2032. OLED's unmatched flexibility, ultra-thin form factor, and low power consumption make it the ideal choice for foldable smartphones, tablets, and the next wave of wearables, ensuring its dominance. The technology helps to provide high-contrast images with deep blacks and wide viewing angles, which in turn drives demand in consumer electronics. In addition, OLED displays are further gaining in adoption across a breadth of end-products including vehicle infotainment systems and high-end medicals owing to their optical performance.
By Application
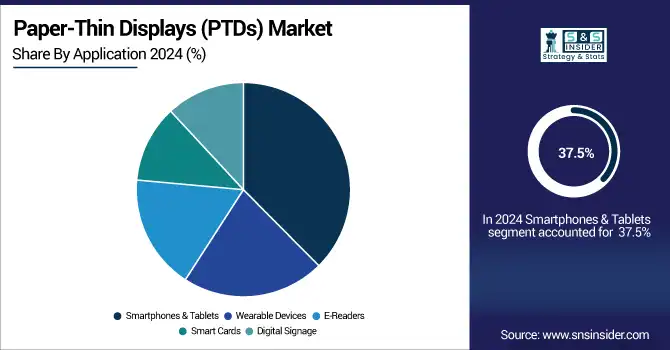
The Paper-Thin Displays (PTDs) market share by product in 2024 is dominated by Smartphones & Tablets with 37.5% due to the increasing adoption of foldable and ultra-slim devices. Flexible OLED and e-paper technologies, which promise to make devices remarkably portable, boost display durability, and conserve power are also being integrated in today’s leading smartphones. Rising consumer demand for sleek and thin gadgets with a high screen-to-body ratio is resulting in higher integration of PTD into flagship models.
The Wearable Devices are anticipated to grow at the highest CAGR during the forecast period of 2025–2032, attributed to the growing health awareness and increasing continuous monitoring needs. PTDs are being adopted by smartwatches, fitness bands, and medical wearables due to their flexible, light-weight structure and battery-saving properties.
By Material
Plastic Substrates accounted about 43.5% of the market share in 2024 and most likely to witness the fastest CAGR from 2025 to 2032. Apart from being light-weight, they have properties of great flexibility and ease of manufacturing at low costs which is why they have taken over most of the domain of use in foldable smartphones, wearables, and e-paper. Thin, flexible and shatter-proof plastic substrates give manufacturers the opportunity to create mechanically strained displays, a perfect match for next-generation CE. Furthermore, it enables large-scale production of Paper-Thin Displays (PTDs) due to their compatibility with roll-to-roll fabrication processes.
By End-Use Industry
Consumer electronics maintained its position at the top with 51.5% share of the global Paper-Thin Displays (PTDs) market in 2024 due to the substantial adoption in foldable smartphones, tablets, smartwatches, e-readers, and other small-sized digital products. Consumer's demands for light weight, minimum energy consumption and flexible display solutions is making it more toward sleek and sophisticated shape with good visual features.
The automotive segment is estimated to register the highest CAGR over 2025-2032 due to the increasing deployment of sophisticated infotainment systems, digital dashboards, and head-up displays. Flexible and curved PTDs offer automakers the ability to boost the aesthetic, functionality, and safety of in-vehicle displays, paving the way for next-generation cockpit designs.
Regional Analysis:
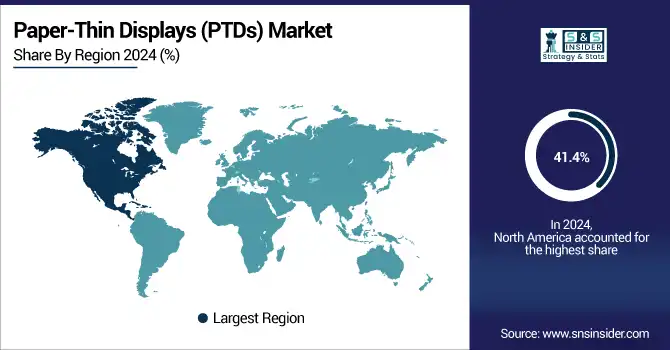
The Paper-Thin Displays (PTDs) market was led by North America in 2024 with a commanding 41.4% share attributed to well-recognized technological innovation, early adoption of advanced consumer electronic products and a well-established electronics manufacturing ecosystem. There is a greater proliferation of flexible OLED and e-paper displays in applications from foldable smartphones and wearables to automotive infotainment and smart packaging around the region. This increasing R&D investment proves to be a driving force for the market, whereas, strategic partnerships between tech firms and display OEMs provide a positive push to the market growth.
The U.S. accounted for the largest share of the North American PTDs market on account of the quick uptake of next generation electronics and also the existing robust R&D infrastructure along with the presence of display technology developers and end-user industries in the country.
Asia Pacific will hold the fastest CAGR of 32.8% over 2025-2032, driven by growing consumer electronics production, improving disposable income, and increasing demand for foldable devices and wearables. The presence of key display panel manufacturers and OEMs in the region leads to rapid development of OLED and e-paper displays. Government backing for flexible electronics, increasing automotive production, and smart city programs are further bolstering PTD use in various sectors.
The Asia Pacific PTDs market was led by China owing to massive manufacturing base, significant investment in OLED and flexible display technologies, and massive adoption from electronics, automotive, and smart packaging end-users in the market.
The Paper-Thin Displays (PTDs) market in Europe is gaining momentum, fueled by high adoption of energy-efficient and sustainable display technologies in the consumer electronics, automotive, and retail industries. The strong R&D ecosystems and innovation hubs in the region support growth opportunities in flexible OLED and e-paper technologies. Increased emphasis on digital transformation particularly in areas such as education and logistics is also driving PTD integration. In line with this, the rising adoption of smart packaging and clear signage highlights the potential applications of paper-thin displays.
Market growth is expected to take off much more slowly in emerging economy markets, such as in Latin America and the Middle East & Africa (MEA), where the gradual introduction of higher-level consumer electronics and digital signage will provide a fertile breeding ground for growth. Market potential is supported by expanding telecom infrastructure and urbanization and a growing interest in smart retail and education systems.
Key Players:
The Paper-Thin Displays (PTDs) companies are Samsung Display, LG Display, E Ink Holdings, BOE Technology, Japan Display, Visionox, AU Optronics, Royole, TCL CSOT, Sharp, FlexEnable, Plastic Logic, OLEDWorks, UDC, Innolux, Konica Minolta, C3Nano, Cambrios, NextFlex, and Pervasive Displays.
Recent Developments:
In June 2025, Samsung has launched a 32-inch Color E-Paper display offering ultra-low power digital signage with QHD resolution and vivid color imaging.
In July 2024, LG Display unveiled flexible, distortion-free automotive OLED technology optimized for in-cabin use, including larger curved and rollable screens, showcased at Display Week and aimed at software-defined vehicles.
Report Attributes | Details |
Market Size in 2024 | USD 4.18 Billion |
Market Size by 2032 | USD 38.44 Billon |
CAGR | CAGR of 32.05 % From 2025 to 2032 |
Base Year | 2024 |
Forecast Period | 2025-2032 |
Historical Data | 2021-2023 |
Report Scope & Coverage | Market Size, Segments Analysis, Competitive Landscape, Regional Analysis, DROC & SWOT Analysis, Forecast Outlook |
Key Segments | • By Technology (OLED, E-Paper, LCD and Quantum Dot), • By Application (Smartphones & Tablets, Wearable Devices, E-Readers, Smart Cards and Digital Signage) • By Material (Plastic Substrates, Glass Substrates, Metal Foil and Organic Materials) • By End Use Industry (Consumer Electronics, Automotive, Healthcare, Retail and Education) |
Regional Analysis/Coverage | North America (US, Canada), Europe (Germany, UK, France, Italy, Spain, Russia, Poland, Rest of Europe), Asia Pacific (China, India, Japan, South Korea, Australia, ASEAN Countries, Rest of Asia Pacific), Middle East & Africa (UAE, Saudi Arabia, Qatar, South Africa, Rest of Middle East & Africa), Latin America (Brazil, Argentina, Mexico, Colombia, Rest of Latin America). |
Company Profiles | Samsung Display, LG Display, E Ink Holdings, BOE Technology, Japan Display, Visionox, AU Optronics, Royole, TCL CSOT, Sharp, FlexEnable, Plastic Logic, OLEDWorks, UDC, Innolux, Konica Minolta, C3Nano, Cambrios, NextFlex, and Pervasive Displays. |
Ans: The Paper-Thin Displays (PTDs) Market is expected to grow at a CAGR of 32.05% from 2025-2032.
Ans: The Paper-Thin Displays (PTDs) Market size was USD 4.18 Billion in 2024 and is expected to reach USD 38.44 Billion by 2032.
Ans: The major growth factor of the Paper-Thin Displays (PTDs) Market is the rising demand for lightweight, flexible, and energy-efficient displays in next-generation consumer electronics.
Ans: The Plastic Substrates segment dominated the Paper-Thin Displays (PTDs) Market in 2024.
Ans: North America dominated the Paper-Thin Displays (PTDs) Market in 2024.
Table Of Contents
1. Introduction
1.1 Market Definition & Scope
1.2 Research Assumptions & Abbreviations
1.3 Research Methodology
2. Executive Summary
2.1 Market Snapshot
2.2 Market Absolute $ Opportunity Assessment & Y-o-Y Analysis, 2021–2032
2.3 Market Size & Forecast, By Segmentation, 2021–2032
2.3.1 Market Size By Technology
2.3.2 Market Size By Application
2.4 Market Share & Bps Analysis By Region, 2024
2.5 Industry Growth Scenarios – Conservative, Likely & Optimistic
2.6 Industry CxO’s Perspective
3. Market Overview
3.1 Market Dynamics
3.1.1 Drivers
3.1.2 Restraints
3.1.3 Opportunities
3.1.4 Key Market Trends
3.2 Industry PESTLE Analysis
3.3 Key Industry Forces (Porter’s) Impacting Market Growth
3.4 Industry Supply Chain Analysis
3.4.1 Raw Material Suppliers
3.4.2 Manufacturers
3.4.3 Distributors/Suppliers
3.4.4 Customers/End-Users
3.5 Industry Life Cycle Assessment
3.6 Parent Market Overview
3.7 Market Risk Assessment
4. Statistical Insights & Trends Reporting
4.1 Manufacturing & Supply Metrics
4.1.1 Annual production volume of PTDs by substrate type (plastic, glass, metal foil)
4.1.2 Yield rate (%) during flexible display fabrication process
4.1.3 Average production cost per square inch by display thickness (in mm)
4.1.4 Time-to-scale for new PTD manufacturing lines (in months)
4.1.5 Vendor-wise supply share of OLED vs. e-paper PTDs
4.2 Performance & Durability Statistics
4.2.1 Average PTD lifespan by application (wearables, smartphones, signage, etc.)
4.2.2 Fold cycle durability (number of bends before degradation)
4.2.3 Brightness retention rate after 12 months of usage (%)
4.2.4 Energy consumption per hour by display type (e-paper vs OLED PTD)
4.2.5 Drop/shock resistance improvement (%) compared to traditional displays
4.3 Innovation & Technology Trends
4.3.1 Patent filings related to ultra-thin or flexible display technologies (last 5 years)
4.3.2 Share of PTD R&D spending as % of revenue among top 10 players
4.3.3 Year-on-year increase in new PTD product launches (global)
4.3.4 AI-integrated PTDs (% share of total) for dynamic brightness/pixel control
4.3.5 Usage of recyclable or biodegradable materials in PTD substrates (%)
4.4 Economic & Cost Indicators
4.4.1 Average cost decline per cm² of PTD over last 5 years
4.4.2 Cost differential between flexible and rigid displays in consumer electronics
4.4.3 Import/export value of PTD components by country (USD million)
4.4.4 Total cost of ownership for PTDs vs traditional LCD/OLEDs (USD/year)
4.4.5 Average integration cost of PTDs into wearables and IoT devices
4.5 Market Penetration & Usage Trends
4.5.1 PTD penetration rate in smart labels and electronic shelf labels (%)
4.5.2 End-user preference score for PTDs over rigid displays (survey-based)
4.5.3 Market share of PTDs in foldable smartphones and tablets
4.5.4 Number of countries with commercial PTD-based signage deployments
4.5.5 % of new e-readers adopting paper-thin display technology annually
5. Paper-Thin Displays (PTDs) Market Segmental Analysis & Forecast, By Technology, 2021 – 2032, Value (USD Billion)
5.1 Introduction
5.2 OLED
5.2.1 Key Trends
5.2.2 Market Size & Forecast, 2021 – 2032
5.3 E-Paper
5.3.1 Key Trends
5.3.2 Market Size & Forecast, 2021 – 2032
5.4 LCD
5.4.1 Key Trends
5.4.2 Market Size & Forecast, 2021 – 2032
5.5 Quantum Dot
5.5.1 Key Trends
5.5.2 Market Size & Forecast, 2021 – 2032
6. Paper-Thin Displays (PTDs) Market Segmental Analysis & Forecast, By Application, 2021 – 2032, Value (USD Billion)
6.1 Introduction
6.2 Smartphones & Tablets
6.2.1 Key Trends
6.2.2 Market Size & Forecast, 2021 – 2032
6.3 Wearable Devices
6.3.1 Key Trends
6.3.2 Market Size & Forecast, 2021 – 2032
6.4 E-Readers
6.4.1 Key Trends
6.4.2 Market Size & Forecast, 2021 – 2032
6.5 Smart Cards
6.5.1 Key Trends
6.5.2 Market Size & Forecast, 2021 – 2032
6.6 Digital Signage
6.6.1 Key Trends
6.6.2 Market Size & Forecast, 2021 – 2032
7. Paper-Thin Displays (PTDs) Market Segmental Analysis & Forecast, By Material Mode, 2021 – 2032, Value (USD Billion)
7.1 Introduction
7.2 Plastic Substrates
7.2.1 Key Trends
7.2.2 Market Size & Forecast, 2021 – 2032
7.3 Glass Substrates
7.3.1 Key Trends
7.3.2 Market Size & Forecast, 2021 – 2032
7.4 Metal Foil
7.4.1 Key Trends
7.4.2 Market Size & Forecast, 2021 – 2032
7.5 Organic Materials
7.5.1 Key Trends
7.5.2 Market Size & Forecast, 2021 – 2032
8. Paper-Thin Displays (PTDs) Market Segmental Analysis & Forecast, By End Use Industry, 2021 – 2032, Value (USD Billion)
8.1 Introduction
8.2 Consumer Electronics
8.2.1 Key Trends
8.2.2 Market Size & Forecast, 2021 – 2032
8.3 Automotive
8.3.1 Key Trends
8.3.2 Market Size & Forecast, 2021 – 2032
8.4 Healthcare
8.4.1 Key Trends
8.4.2 Market Size & Forecast, 2021 – 2032
8.5 Retail
8.5.1 Key Trends
8.5.2 Market Size & Forecast, 2021 – 2032
8.6 Education
8.6.1 Key Trends
8.6.2 Market Size & Forecast, 2021 – 2032
9. Paper-Thin Displays (PTDs) Market Segmental Analysis & Forecast By Region, 2021 – 2025, Value (USD Billion)
9.1 Introduction
9.2 North America
9.2.1 Key Trends
9.2.2 Paper-Thin Displays (PTDs) Market Size & Forecast, By Technology, 2021 – 2032
9.2.3 Paper-Thin Displays (PTDs) Market Size & Forecast, By Application, 2021 – 2032
9.2.4 Paper-Thin Displays (PTDs) Market Size & Forecast, By Material Mode, 2021 – 2032
9.2.5 Paper-Thin Displays (PTDs) Market Size & Forecast, By End Use Industry, 2021 – 2032
9.2.6 Paper-Thin Displays (PTDs) Market Size & Forecast, By Country, 2021 – 2032
9.2.6.1 USA
9.2.6.1.1 Paper-Thin Displays (PTDs) Market Size & Forecast, By Technology, 2021 – 2032
9.2.6.1.2 Paper-Thin Displays (PTDs) Market Size & Forecast, By Application, 2021 – 2032
9.2.6.1.3 Paper-Thin Displays (PTDs) Market Size & Forecast, By Material Mode, 2021 – 2032
9.2.6.1.4 Paper-Thin Displays (PTDs) Market Size & Forecast, By End Use Industry, 2021 – 2032
9.2.6.2 Canada
9.2.6.2.1 Paper-Thin Displays (PTDs) Market Size & Forecast, By Technology, 2021 – 2032
9.2.6.2.2 Paper-Thin Displays (PTDs) Market Size & Forecast, By Application, 2021 – 2032
9.2.6.2.3 Paper-Thin Displays (PTDs) Market Size & Forecast, By Material Mode, 2021 – 2032
9.2.6.2.4 Paper-Thin Displays (PTDs) Market Size & Forecast, By End Use Industry, 2021 – 2032
9.3 Europe
9.3.1 Key Trends
9.3.2 Paper-Thin Displays (PTDs) Market Size & Forecast, By Technology, 2021 – 2032
9.3.3 Paper-Thin Displays (PTDs) Market Size & Forecast, By Application, 2021 – 2032
9.3.4 Paper-Thin Displays (PTDs) Market Size & Forecast, By Material Mode, 2021 – 2032
9.3.5 Paper-Thin Displays (PTDs) Market Size & Forecast, By End Use Industry, 2021 – 2032
9.3.6 Paper-Thin Displays (PTDs) Market Size & Forecast, By Country, 2021 – 2032
9.3.6.1 Germany
9.3.6.1.1 Paper-Thin Displays (PTDs) Market Size & Forecast, By Technology, 2021 – 2032
9.3.6.1.2 Paper-Thin Displays (PTDs) Market Size & Forecast, By Application, 2021 – 2032
9.3.6.1.3 Paper-Thin Displays (PTDs) Market Size & Forecast, By Material Mode, 2021 – 2032
9.3.6.1.4 Paper-Thin Displays (PTDs) Market Size & Forecast, By End Use Industry, 2021 – 2032
9.3.6.2 UK
9.3.6.2.1 Paper-Thin Displays (PTDs) Market Size & Forecast, By Technology, 2021 – 2032
9.3.6.2.2 Paper-Thin Displays (PTDs) Market Size & Forecast, By Application, 2021 – 2032
9.3.6.2.3 Paper-Thin Displays (PTDs) Market Size & Forecast, By Material Mode, 2021 – 2032
9.3.6.2.4 Paper-Thin Displays (PTDs) Market Size & Forecast, By End Use Industry, 2021 – 2032
9.3.6.3 France
9.3.6.3.1 Paper-Thin Displays (PTDs) Market Size & Forecast, By Technology, 2021 – 2032
9.3.6.3.2 Paper-Thin Displays (PTDs) Market Size & Forecast, By Application, 2021 – 2032
9.3.6.3.3 Paper-Thin Displays (PTDs) Market Size & Forecast, By Material Mode, 2021 – 2032
9.3.6.3.4 Paper-Thin Displays (PTDs) Market Size & Forecast, By End Use Industry, 2021 – 2032
9.3.6.4 Italy
9.3.6.4.1 Paper-Thin Displays (PTDs) Market Size & Forecast, By Technology, 2021 – 2032
9.3.6.4.2 Paper-Thin Displays (PTDs) Market Size & Forecast, By Application, 2021 – 2032
9.3.6.4.3 Paper-Thin Displays (PTDs) Market Size & Forecast, By Material Mode, 2021 – 2032
9.3.6.4.4 Paper-Thin Displays (PTDs) Market Size & Forecast, By End Use Industry, 2021 – 2032
9.3.6.5 Spain
9.3.6.5.1 Paper-Thin Displays (PTDs) Market Size & Forecast, By Technology, 2021 – 2032
9.3.6.5.2 Paper-Thin Displays (PTDs) Market Size & Forecast, By Application, 2021 – 2032
9.3.6.5.3 Paper-Thin Displays (PTDs) Market Size & Forecast, By Material Mode, 2021 – 2032
9.3.6.5.4 Paper-Thin Displays (PTDs) Market Size & Forecast, By End Use Industry, 2021 – 2032
9.3.6.6 Russia
9.3.6.6.1 Paper-Thin Displays (PTDs) Market Size & Forecast, By Technology, 2021 – 2032
9.3.6.6.2 Paper-Thin Displays (PTDs) Market Size & Forecast, By Application, 2021 – 2032
9.3.6.6.3 Paper-Thin Displays (PTDs) Market Size & Forecast, By Material Mode, 2021 – 2032
9.3.6.6.4 Paper-Thin Displays (PTDs) Market Size & Forecast, By End Use Industry, 2021 – 2032
9.3.6.7 Poland
9.3.6.7.1 Paper-Thin Displays (PTDs) Market Size & Forecast, By Technology, 2021 – 2032
9.3.6.7.2 Paper-Thin Displays (PTDs) Market Size & Forecast, By Application, 2021 – 2032
9.3.6.7.3 Paper-Thin Displays (PTDs) Market Size & Forecast, By Material Mode, 2021 – 2032
9.3.6.7.4 Paper-Thin Displays (PTDs) Market Size & Forecast, By End Use Industry, 2021 – 2032
9.3.6.8 Rest of Europe
9.3.6.8.1 Paper-Thin Displays (PTDs) Market Size & Forecast, By Technology, 2021 – 2032
9.3.6.8.2 Paper-Thin Displays (PTDs) Market Size & Forecast, By Application, 2021 – 2032
9.3.6.8.3 Paper-Thin Displays (PTDs) Market Size & Forecast, By Material Mode, 2021 – 2032
9.3.6.8.4 Paper-Thin Displays (PTDs) Market Size & Forecast, By End Use Industry, 2021 – 2032
9.4 Asia-Pacific
9.4.1 Key Trends
9.4.2 Paper-Thin Displays (PTDs) Market Size & Forecast, By Technology, 2021 – 2032
9.4.3 Paper-Thin Displays (PTDs) Market Size & Forecast, By Application, 2021 – 2032
9.4.4 Paper-Thin Displays (PTDs) Market Size & Forecast, By Material Mode, 2021 – 2032
9.4.5 Paper-Thin Displays (PTDs) Market Size & Forecast, By End Use Industry, 2021 – 2032
9.4.6 Paper-Thin Displays (PTDs) Market Size & Forecast, By Country, 2021 – 2032
9.4.6.1 China
9.4.6.1.1 Paper-Thin Displays (PTDs) Market Size & Forecast, By Technology, 2021 – 2032
9.4.6.1.2 Paper-Thin Displays (PTDs) Market Size & Forecast, By Application, 2021 – 2032
9.4.6.1.3 Paper-Thin Displays (PTDs) Market Size & Forecast, By Material Mode, 2021 – 2032
9.4.6.1.4 Paper-Thin Displays (PTDs) Market Size & Forecast, By End Use Industry, 2021 – 2032
9.4.6.2 India
9.4.6.2.1 Paper-Thin Displays (PTDs) Market Size & Forecast, By Technology, 2021 – 2032
9.4.6.2.2 Paper-Thin Displays (PTDs) Market Size & Forecast, By Application, 2021 – 2032
9.4.6.2.3 Paper-Thin Displays (PTDs) Market Size & Forecast, By Material Mode, 2021 – 2032
9.4.6.2.4 Paper-Thin Displays (PTDs) Market Size & Forecast, By End Use Industry, 2021 – 2032
9.4.6.3 Japan
9.4.6.3.1 Paper-Thin Displays (PTDs) Market Size & Forecast, By Technology, 2021 – 2032
9.4.6.3.2 Paper-Thin Displays (PTDs) Market Size & Forecast, By Application, 2021 – 2032
9.4.6.3.3 Paper-Thin Displays (PTDs) Market Size & Forecast, By Material Mode, 2021 – 2032
9.4.6.3.4 Paper-Thin Displays (PTDs) Market Size & Forecast, By End Use Industry, 2021 – 2032
9.4.6.4 South Korea
9.4.6.4.1 Paper-Thin Displays (PTDs) Market Size & Forecast, By Technology, 2021 – 2032
9.4.6.4.2 Paper-Thin Displays (PTDs) Market Size & Forecast, By Application, 2021 – 2032
9.4.6.4.3 Paper-Thin Displays (PTDs) Market Size & Forecast, By Material Mode, 2021 – 2032
9.4.6.4.4 Paper-Thin Displays (PTDs) Market Size & Forecast, By End Use Industry, 2021 – 2032
9.4.6.5 Australia
9.4.6.5.1 Paper-Thin Displays (PTDs) Market Size & Forecast, By Technology, 2021 – 2032
9.4.6.5.2 Paper-Thin Displays (PTDs) Market Size & Forecast, By Application, 2021 – 2032
9.4.6.5.3 Paper-Thin Displays (PTDs) Market Size & Forecast, By Material Mode, 2021 – 2032
9.4.6.5.4 Paper-Thin Displays (PTDs) Market Size & Forecast, By End Use Industry, 2021 – 2032
9.4.6.6 ASEAN Countries
9.4.6.6.1 Paper-Thin Displays (PTDs) Market Size & Forecast, By Technology, 2021 – 2032
9.4.6.6.2 Paper-Thin Displays (PTDs) Market Size & Forecast, By Application, 2021 – 2032
9.4.6.6.3 Paper-Thin Displays (PTDs) Market Size & Forecast, By Material Mode, 2021 – 2032
9.4.6.6.4 Paper-Thin Displays (PTDs) Market Size & Forecast, By End Use Industry, 2021 – 2032
9.4.6.7 Rest of Asia-Pacific
9.4.6.7.1 Paper-Thin Displays (PTDs) Market Size & Forecast, By Technology, 2021 – 2032
9.4.6.7.2 Paper-Thin Displays (PTDs) Market Size & Forecast, By Application, 2021 – 2032
9.4.6.7.3 Paper-Thin Displays (PTDs) Market Size & Forecast, By Material Mode, 2021 – 2032
9.4.6.7.4 Paper-Thin Displays (PTDs) Market Size & Forecast, By End Use Industry, 2021 – 2032
9.5 Latin America
9.5.1 Key Trends
9.5.2 Paper-Thin Displays (PTDs) Market Size & Forecast, By Technology, 2021 – 2032
9.5.3 Paper-Thin Displays (PTDs) Market Size & Forecast, By Application, 2021 – 2032
9.5.4 Paper-Thin Displays (PTDs) Market Size & Forecast, By Material Mode, 2021 – 2032
9.5.5 Paper-Thin Displays (PTDs) Market Size & Forecast, By End Use Industry, 2021 – 2032
9.5.6 Paper-Thin Displays (PTDs) Market Size & Forecast, By Country, 2021 – 2032
9.5.6.1 Brazil
9.5.6.1.1 Paper-Thin Displays (PTDs) Market Size & Forecast, By Technology, 2021 – 2032
9.5.6.1.2 Paper-Thin Displays (PTDs) Market Size & Forecast, By Application, 2021 – 2032
9.5.6.1.3 Paper-Thin Displays (PTDs) Market Size & Forecast, By Material Mode, 2021 – 2032
9.5.6.1.4 Paper-Thin Displays (PTDs) Market Size & Forecast, By End Use Industry, 2021 – 2032
9.5.6.2 Argentina
9.5.6.2.1 Paper-Thin Displays (PTDs) Market Size & Forecast, By Technology, 2021 – 2032
9.5.6.2.2 Paper-Thin Displays (PTDs) Market Size & Forecast, By Application, 2021 – 2032
9.5.6.2.3 Paper-Thin Displays (PTDs) Market Size & Forecast, By Material Mode, 2021 – 2032
9.5.6.2.4 Paper-Thin Displays (PTDs) Market Size & Forecast, By End Use Industry, 2021 – 2032
9.5.6.3 Mexico
9.5.6.3.1 Paper-Thin Displays (PTDs) Market Size & Forecast, By Technology, 2021 – 2032
9.5.6.3.2 Paper-Thin Displays (PTDs) Market Size & Forecast, By Application, 2021 – 2032
9.5.6.3.3 Paper-Thin Displays (PTDs) Market Size & Forecast, By Material Mode, 2021 – 2032
9.5.6.3.4 Paper-Thin Displays (PTDs) Market Size & Forecast, By End Use Industry, 2021 – 2032
9.5.6.4 Colombia
9.5.6.4.1 Paper-Thin Displays (PTDs) Market Size & Forecast, By Technology, 2021 – 2032
9.5.6.4.2 Paper-Thin Displays (PTDs) Market Size & Forecast, By Application, 2021 – 2032
9.5.6.4.3 Paper-Thin Displays (PTDs) Market Size & Forecast, By Material Mode, 2021 – 2032
9.5.6.4.4 Paper-Thin Displays (PTDs) Market Size & Forecast, By End Use Industry, 2021 – 2032
9.5.6.5 Rest of Latin America
9.5.6.5.1 Paper-Thin Displays (PTDs) Market Size & Forecast, By Technology, 2021 – 2032
9.5.6.5.2 Paper-Thin Displays (PTDs) Market Size & Forecast, By Application, 2021 – 2032
9.5.6.5.3 Paper-Thin Displays (PTDs) Market Size & Forecast, By Material Mode, 2021 – 2032
9.5.6.5.4 Paper-Thin Displays (PTDs) Market Size & Forecast, By End Use Industry, 2021 – 2032
9.6 Middle East & Africa
9.6.1 Key Trends
9.6.2 Paper-Thin Displays (PTDs) Market Size & Forecast, By Technology, 2021 – 2032
9.6.3 Paper-Thin Displays (PTDs) Market Size & Forecast, By Application, 2021 – 2032
9.6.4 Paper-Thin Displays (PTDs) Market Size & Forecast, By Material Mode, 2021 – 2032
9.6.5 Paper-Thin Displays (PTDs) Market Size & Forecast, By End Use Industry, 2021 – 2032
9.6.6 Paper-Thin Displays (PTDs) Market Size & Forecast, By Country, 2021 – 2032
9.6.6.1 UAE
9.6.6.1.1 Paper-Thin Displays (PTDs) Market Size & Forecast, By Technology, 2021 – 2032
9.6.6.1.2 Paper-Thin Displays (PTDs) Market Size & Forecast, By Application, 2021 – 2032
9.6.6.1.3 Paper-Thin Displays (PTDs) Market Size & Forecast, By Material Mode, 2021 – 2032
9.6.6.1.4 Paper-Thin Displays (PTDs) Market Size & Forecast, By End Use Industry, 2021 – 2032
9.6.6.2 Saudi Arabia
9.6.6.2.1 Paper-Thin Displays (PTDs) Market Size & Forecast, By Technology, 2021 – 2032
9.6.6.2.2 Paper-Thin Displays (PTDs) Market Size & Forecast, By Application, 2021 – 2032
9.6.6.2.3 Paper-Thin Displays (PTDs) Market Size & Forecast, By Material Mode, 2021 – 2032
9.6.6.2.4 Paper-Thin Displays (PTDs) Market Size & Forecast, By End Use Industry, 2021 – 2032
9.6.6.3 Qatar
9.6.6.3.1 Paper-Thin Displays (PTDs) Market Size & Forecast, By Technology, 2021 – 2032
9.6.6.3.2 Paper-Thin Displays (PTDs) Market Size & Forecast, By Application, 2021 – 2032
9.6.6.3.3 Paper-Thin Displays (PTDs) Market Size & Forecast, By Material Mode, 2021 – 2032
9.6.6.3.4 Paper-Thin Displays (PTDs) Market Size & Forecast, By End Use Industry, 2021 – 2032
9.6.6.4 Egypt
9.6.6.4.1 Paper-Thin Displays (PTDs) Market Size & Forecast, By Technology, 2021 – 2032
9.6.6.4.2 Paper-Thin Displays (PTDs) Market Size & Forecast, By Application, 2021 – 2032
9.6.6.4.3 Paper-Thin Displays (PTDs) Market Size & Forecast, By Material Mode, 2021 – 2032
9.6.6.4.4 Paper-Thin Displays (PTDs) Market Size & Forecast, By End Use Industry, 2021 – 2032
9.6.6.5 South Africa
9.6.6.5.1 Paper-Thin Displays (PTDs) Market Size & Forecast, By Technology, 2021 – 2032
9.6.6.5.2 Paper-Thin Displays (PTDs) Market Size & Forecast, By Application, 2021 – 2032
9.6.6.5.3 Paper-Thin Displays (PTDs) Market Size & Forecast, By Material Mode, 2021 – 2032
9.6.6.5.4 Paper-Thin Displays (PTDs) Market Size & Forecast, By End Use Industry, 2021 – 2032
9.6.6.6 Rest of Middle East & Africa
9.6.6.6.1 Paper-Thin Displays (PTDs) Market Size & Forecast, By Technology, 2021 – 2032
9.6.6.6.2 Paper-Thin Displays (PTDs) Market Size & Forecast, By Application, 2021 – 2032
9.6.6.6.3 Paper-Thin Displays (PTDs) Market Size & Forecast, By Material Mode, 2021 – 2032
9.6.6.6.4 Paper-Thin Displays (PTDs) Market Size & Forecast, By End Use Industry, 2021 – 2032
10. Competitive Landscape
10.1 Key Players' Positioning
10.2 Competitive Developments
10.2.1 Key Strategies Adopted (%), By Key Players, 2024
10.2.2 Year-Wise Strategies & Development, 2021 – 2025
10.2.3 Number Of Strategies Adopted By Key Players, 2024
10.3 Market Share Analysis, 2024
10.4 Product/Service & Application Benchmarking
10.4.1 Product/Service Specifications & Features By Key Players
10.4.2 Product/Service Heatmap By Key Players
10.4.3 Application Heatmap By Key Players
10.5 Industry Start-Up & Innovation Landscape
10.6 Key Company Profiles
10.6.1 Samsung Display.
10.6.1.1 Company Overview & Snapshot
10.6.1.2 Product/Service Portfolio
10.6.1.3 Key Company Financials
10.6.1.4 SWOT Analysis
10.6.2 LG Display.
10.6.2.1 Company Overview & Snapshot
10.6.2.2 Product/Service Portfolio
10.6.2.3 Key Company Financials
10.6.2.4 SWOT Analysis
10.6.3 E Ink Holdings Inc.
10.6.3.1 Company Overview & Snapshot
10.6.3.2 Product/Service Portfolio
10.6.3.3 Key Company Financials
10.6.3.4 SWOT Analysis
10.6.4 BOE Technology Group Co., Ltd.
10.6.4.1 Company Overview & Snapshot
10.6.4.2 Product/Service Portfolio
10.6.4.3 Key Company Financials
10.6.4.4 SWOT Analysis
10.6.5 Visionox Technology Inc.
10.6.5.1 Company Overview & Snapshot
10.6.5.2 Product/Service Portfolio
10.6.5.3 Key Company Financials
10.6.5.4 SWOT Analysis
10.6.6 Japan Display Inc. (JDI).
10.6.6.1 Company Overview & Snapshot
10.6.6.2 Product/Service Portfolio
10.6.6.3 Key Company Financials
10.6.6.4 SWOT Analysis
10.6.7 AU Optronics Corp.
10.6.7.1 Company Overview & Snapshot
10.6.7.2 Product/Service Portfolio
10.6.7.3 Key Company Financials
10.6.7.4 SWOT Analysis
10.6.8 Royole Corporation
10.6.8.1 Company Overview & Snapshot
10.6.8.2 Product/Service Portfolio
10.6.8.3 Key Company Financials
10.6.8.4 SWOT Analysis
10.6.9 TCL China Star Optoelectronics Technology
10.6.9.1 Company Overview & Snapshot
10.6.9.2 Product/Service Portfolio
10.6.9.3 Key Company Financials
10.6.9.4 SWOT Analysis
10.6.10 Sharp Corporation
10.6.10.1 Company Overview & Snapshot
10.6.10.2 Product/Service Portfolio
10.6.10.3 Key Company Financials
10.6.10.4 SWOT Analysis
10.6.11 Intel Corporation
10.6.11.1 Company Overview & Snapshot
10.6.11.2 Product/Service Portfolio
10.6.11.3 Key Company Financials
10.6.11.4 SWOT Analysis
10.6.12 FlexEnable Ltd
10.6.12.1 Company Overview & Snapshot
10.6.12.2 Product/Service Portfolio
10.6.12.3 Key Company Financials
10.6.12.4 SWOT Analysis
10.6.13 OLEDWorks LLC
10.6.13.1 Company Overview & Snapshot
10.6.13.2 Product/Service Portfolio
10.6.13.3 Key Company Financials
10.6.13.4 SWOT Analysis
10.6.14 Universal Display Corporation
10.6.14.1 Company Overview & Snapshot
10.6.14.2 Product/Service Portfolio
10.6.14.3 Key Company Financials
10.6.14.4 SWOT Analysis
10.6.15 Innolux Corporation
10.6.15.1 Company Overview & Snapshot
10.6.15.2 Product/Service Portfolio
10.6.15.3 Key Company Financials
10.6.15.4 SWOT Analysis
10.6.16 Konica Minolta, Inc
10.6.16.1 Company Overview & Snapshot
10.6.16.2 Product/Service Portfolio
10.6.16.3 Key Company Financials
10.6.16.4 SWOT Analysis
10.6.17 C3Nano Inc.
10.6.17.1 Company Overview & Snapshot
10.6.17.2 Product/Service Portfolio
10.6.17.3 Key Company Financials
10.6.17.4 SWOT Analysis
10.6.18 Cambrios Film Solutions Corporation.
10.6.18.1 Company Overview & Snapshot
10.6.18.2 Product/Service Portfolio
10.6.18.3 Key Company Financials
10.6.18.4 SWOT Analysis
10.6.19 NextFlex
10.6.19.1 Company Overview & Snapshot
10.6.19.2 Product/Service Portfolio
10.6.19.3 Key Company Financials
10.6.19.4 SWOT Analysis
10.6.20 Pervasive Displays, Inc.
10.6.20.1 Company Overview & Snapshot
10.6.20.2 Product/Service Portfolio
10.6.20.3 Key Company Financials
10.6.20.4 SWOT Analysis
11. Analyst Recommendations
11.1 SNS Insider Opportunity Map
11.2 Industry Low-Hanging Fruit Assessment
11.3 Market Entry & Growth Strategy
11.4 Analyst Viewpoint & Suggestions On Market Growth
12. Assumptions
13. Disclaimer
14. Appendix
14.1 List Of Tables
14.2 List Of Figures
An accurate research report requires proper strategizing as well as implementation. There are multiple factors involved in the completion of good and accurate research report and selecting the best methodology to compete the research is the toughest part. Since the research reports we provide play a crucial role in any company’s decision-making process, therefore we at SNS Insider always believe that we should choose the best method which gives us results closer to reality. This allows us to reach at a stage wherein we can provide our clients best and accurate investment to output ratio.
Each report that we prepare takes a timeframe of 350-400 business hours for production. Starting from the selection of titles through a couple of in-depth brain storming session to the final QC process before uploading our titles on our website we dedicate around 350 working hours. The titles are selected based on their current market cap and the foreseen CAGR and growth.
The 5 steps process:
Step 1: Secondary Research:
Secondary Research or Desk Research is as the name suggests is a research process wherein, we collect data through the readily available information. In this process we use various paid and unpaid databases which our team has access to and gather data through the same. This includes examining of listed companies’ annual reports, Journals, SEC filling etc. Apart from this our team has access to various associations across the globe across different industries. Lastly, we have exchange relationships with various university as well as individual libraries.
Step 2: Primary Research
When we talk about primary research, it is a type of study in which the researchers collect relevant data samples directly, rather than relying on previously collected data. This type of research is focused on gaining content specific facts that can be sued to solve specific problems. Since the collected data is fresh and first hand therefore it makes the study more accurate and genuine.
We at SNS Insider have divided Primary Research into 2 parts.
Part 1 wherein we interview the KOLs of major players as well as the upcoming ones across various geographic regions. This allows us to have their view over the market scenario and acts as an important tool to come closer to the accurate market numbers. As many as 45 paid and unpaid primary interviews are taken from both the demand and supply side of the industry to make sure we land at an accurate judgement and analysis of the market.
This step involves the triangulation of data wherein our team analyses the interview transcripts, online survey responses and observation of on filed participants. The below mentioned chart should give a better understanding of the part 1 of the primary interview.
Part 2: In this part of primary research the data collected via secondary research and the part 1 of the primary research is validated with the interviews from individual consultants and subject matter experts.
Consultants are those set of people who have at least 12 years of experience and expertise within the industry whereas Subject Matter Experts are those with at least 15 years of experience behind their back within the same space. The data with the help of two main processes i.e., FGDs (Focused Group Discussions) and IDs (Individual Discussions). This gives us a 3rd party nonbiased primary view of the market scenario making it a more dependable one while collation of the data pointers.
Step 3: Data Bank Validation
Once all the information is collected via primary and secondary sources, we run that information for data validation. At our intelligence centre our research heads track a lot of information related to the market which includes the quarterly reports, the daily stock prices, and other relevant information. Our data bank server gets updated every fortnight and that is how the information which we collected using our primary and secondary information is revalidated in real time.
Step 4: QA/QC Process
After all the data collection and validation our team does a final level of quality check and quality assurance to get rid of any unwanted or undesired mistakes. This might include but not limited to getting rid of the any typos, duplication of numbers or missing of any important information. The people involved in this process include technical content writers, research heads and graphics people. Once this process is completed the title gets uploader on our platform for our clients to read it.
Step 5: Final QC/QA Process:
This is the last process and comes when the client has ordered the study. In this process a final QA/QC is done before the study is emailed to the client. Since we believe in giving our clients a good experience of our research studies, therefore, to make sure that we do not lack at our end in any way humanly possible we do a final round of quality check and then dispatch the study to the client.
Key Segments:
By Technology
By Application
By Material
By End Use Industry
Request for Segment Customization as per your Business Requirement: Segment Customization Request
Regional Coverage:
North America
Europe
Asia Pacific
Middle East & Africa
Latin America
Request for Country Level Research Report: Country Level Customization Request
Available Customization
With the given market data, SNS Insider offers customization as per the company’s specific needs. The following customization options are available for the report: