image

Passive Optical Network (PON) Market Report Scope & Overview:

The Passive Optical Network Market Size was valued at USD 14.07 Billion in 2023 and is expected to reach USD 41.86 Billion by 2031 and grow at a CAGR of 14.6% over the forecast period 2024-2031.

Passive-Optical-Network-Market Revenue Analysis

Get more information on Passive Optical Network (PON)  Market - Request Sample Report

With fixed broadband connections projected to rise 3% annually until 2024, and UN estimates suggesting over 68% of people living in cities by 2050, the need for faster internet and smarter cities is propelling a boom in fiber optic networks. Traditional networks are buckling under the weight of exploding mobile data (LTE) and home internet subscriptions. Passive optical networks (PONs) emerge as the answer. Utilizing fiber optics, PONs deliver high-speed internet over vast distances without requiring expensive equipment. This makes them ideal for the gigabit speeds demanded by video streaming and other data-hungry applications.  Furthermore, PONs align perfectly with smart city initiatives that rely on robust fiber networks to manage utilities and infrastructure. As urbanization accelerates, PON technology is poised for explosive growth, driven by the ever-increasing appetite for data.

MARKET DYNAMICS

KEY DRIVERS:  

  • PONs provide dependable connectivity, crucial for businesses and consumers alike

  • Increasing demand for Low Ownership Cost, Reliable Network

PON technology is reigniting the optical network equipment market. Its multiplexing capabilities and symmetrical design deliver blazing-fast internet, perfect for modern needs like 4K streaming and smart homes.  As FTTH (Fiber-To-The-Home) services gain traction, users benefit from a quicker return on investment thanks to these high speeds.  Telecom companies are actively upgrading their networks with PON equipment to boost speed, efficiency, and reduce costs.  Internet providers are likewise expanding services to meet ever-growing bandwidth demands and accelerate the adoption of GPON technology. 

RESTRAIN:

  • The presence of even more advanced network technologies beyond PON could limit its widespread adoption

Energy efficiency is a growing concern for network users due to stricter policies and rising costs. However, established players often have complex product lines and unclear bandwidth options, making them less attractive to consumers. New entrants are capitalizing on this by offering user-friendly, energy-efficient PON solutions that meet consumer needs. This trend, along with the emergence of new players in the optical network equipment market, is expected to challenge the dominance of established companies in the coming years. For example, a major player like Sterlite (India) recently expanded its offerings beyond basic equipment to include diverse OLTs for broadband access, showcasing the shift towards more user-friendly and adaptable solutions.

OPPORTUNITY:

  • The growing number of internet users worldwide creates a larger demand for data transfer capacity

Existing internet users are also consuming more data than ever before. This is due to the growing popularity of bandwidth-intensive applications like video streaming services (think Netflix, YouTube), online gaming, video conferencing, and large file downloads. These activities require more data to be transferred compared to browsing websites or sending emails.

  • IT professionals are focusing their research and development efforts on improving PON technology.

CHALLENGES:

  • The PON market faces a challenge with the emergence of NG-PON2 technology.

NG-PON2 utilizes fiber optics to deliver significantly faster internet speeds compared to traditional PON technology. This could potentially slow down the widespread adoption of current PON solutions.

IMPACT OF RUSSIA UKRAINE WAR

Supply chain disruptions due to the conflict could lead to a 10-20% potential slowdown in global electronics manufacturing, impacting PON equipment production and potentially raising prices by 5-10%. Additionally, some governments, particularly in Eastern Europe, might shift resources away from fiber optic network expansion, potentially hindering PON adoption by 2-3% annually compared to pre-war projections. Cybersecurity concerns could also cause delays in network upgrades by 3-6 months.

The focus on secure communication could accelerate PON adoption by 3-5% due to its inherent security advantages. Moreover, European efforts to lessen reliance on Russian energy could lead to a 10-15% increase in planned fiber optic network buildouts over the next 5 years to support data transmission for alternative energy sources.

IMPACT OF ECONOMIC SLOWDOWN

Infrastructure projects, a key driver for PON adoption, could face budget cuts of 5-10%, potentially slowing down fiber optic network expansion. Tighter consumer spending might also lead to a 2-3% decline in demand for high-speed internet services that rely on PON technology. Additionally, stricter lending practices during slowdowns could delay PON deployment project approvals by 3-6 months.

The focus on cost-effectiveness during economic downturns could make PON technology, known for its affordability compared to traditional networks, more attractive. This could lead to a 3-5% increase in PON market share as companies and governments prioritize cost-saving measures.  Furthermore, economic slowdowns can sometimes trigger a rise in remote work and online services, driving demand for faster internet connections. This potential increase in demand for high-speed internet, estimated at 2-4%, could benefit the PON market by boosting PON equipment sales.

KEY MARKET SEGMENTS:

By Type

  • EPON

  • GPON

  • Others (Next-Gen PON)

Next-Gen PON is experiencing the fastest growth and GPON to dominate with the 42% market share. While EPON, the first-generation technology, offers speeds up to 1 Gbps, it's been surpassed by GPON and Next-Gen PON. Currently, GPON delivers speeds of up to 2.5 Gbps. Interestingly, data centers are increasingly adopting PON technology due to its ability to provide both high speeds and robust security. This trend is significantly influencing market share growth.

Passive-Optical-Network-Market-By-Type

Need any customization research on Passive Optical Network (PON) Market - Enquiry Now

By Component

  • Optical Line Terminal (OLT)

  • Optical Network Terminal (ONT)

  • Optical Distribution Network (ODN)

By Application

  • FFTX

    • FTTH

    • FTTB

    • FTTP

  • Mobile Backhaul

REGIONAL ANALYSIS

Asia Pacific leads the PON market charge with the 48% market share in 2023, fueled by government digitalization initiatives in China, India, and Japan.  Demand for FTTX solutions and ONT products in homes, businesses, and data centers, along with rising adoption of Next-Gen PON technology, is revitalizing the stagnant optical network equipment market. China, with its massive population, increasing internet use, and technology upgrades, dominates the region.  Similarly,  growing youth populations and internet penetration in India and Japan are boosting PON device demand.  Government support for 5G and Next-Gen PON across Asia Pacific further accelerates market growth.

North America is projected for steady growth, driven by the increasing need for OLTs that enhance internet speeds.  End-user investments in PON device R&D and government programs for optical network infrastructure are additional growth factors.  The widespread adoption of FTTH solutions in the US, along with a $1.5 billion government investment in telecom infrastructure, highlights North America's commitment to PON technology.

Passive-Optical-Network-Market-By-Region

REGIONAL COVERAGE:

North America

  • US

  • Canada

  • Mexico

Europe

  • Eastern Europe

    • Poland

    • Romania

    • Hungary

    • Turkey

    • Rest of Eastern Europe

  • Western Europe

    • Germany

    • France

    • UK

    • Italy

    • Spain

    • Netherlands

    • Switzerland

    • Austria

    • Rest of Western Europe

Asia Pacific

  • China

  • India

  • Japan

  • South Korea

  • Vietnam

  • Singapore

  • Australia

  • Rest of Asia Pacific

Middle East & Africa

  • Middle East

    • UAE

    • Egypt

    • Saudi Arabia

    • Qatar

    • Rest of Middle East

  • Africa

    • Nigeria

    • South Africa

    • Rest of Africa

Latin America

  • Brazil

  • Argentina

  • Colombia

  • Rest of Latin America  

KEY PLAYERS:

The major players are ADTRAN, Inc. (U.S.), Calix, Inc. (U.S.),  Clena Corporation (U.S.), CISCO SYSTEMS, INC. (U.S.), Huawei Investment & Holding Co., Ltd. (China), Infinera Corporation (U.S.), Nokia Corporation (Finland), Telefonaktiebolaget LM Ericsson (Sweden), TP-Link Corporation Limited. (China), ZTE Corporation (China) and other players are listed in the final report.

Infinera Corporation (U.S.)-Company Financial Analysis

Company Landscape Analysis

RECENT DEVELOPMENT:

  • Data services utilizing Gigabit Passive Optical Networking (GPON) were introduced in May 2021 by AirFiber, an internet service provider firm with headquarters in India.

  • To enhance their PON networks to increase data speeds and deliver new services without having to replace or modify their existing equipment, a US-based infrastructure supplier named CommScope launched a coexistence portfolio in August 2021. adding fiber to their current PON system   

  • Nokia established the 25GS PON MSA Group in 2021 to bring together optical network operators and leading system and component manufacturers to promote and hasten the development and application of 25GS-PON technology.

  • In 2021, the US-based telecom behemoth Verizon Communications acquired TracFone Wireless, Inc. for an undisclosed sum. With this acquisition, Verizon expands its product line and offers a new customer base access to its top-tier wireless network as well as a wide choice of mobility products and services. a US personPrepaid, no-contract cell phones are available from an organisation called TracFone Wireless, Inc.

Passive Optical Network Market Report Scope:
Report Attributes Details
Market Size in 2023  US$ 14.07 Bn
Market Size by 2031  US$ 41.86 Bn
CAGR   CAGR of 14.6 % From 2024 to 2031
Base Year  2023
Forecast Period  2024-2031
Historical Data  2020-2022
Report Scope & Coverage Market Size, Segments Analysis, Competitive  Landscape, Regional Analysis, DROC & SWOT Analysis, Forecast Outlook
Key Segments

• By Type (EPON, GPON, Others (Next-Gen PON)
• By Component (Optical line terminal (OLT), Optical Network terminal (ONT), Optical Distribution Network (ODN)
• By Application [FFTX (FTTH, FTTB, FTTP), Mobile Backhaul]

Regional Analysis/Coverage North America (US, Canada, Mexico), Europe (Eastern Europe [Poland, Romania, Hungary, Turkey, Rest of Eastern Europe] Western Europe] Germany, France, UK, Italy, Spain, Netherlands, Switzerland, Austria, Rest of Western Europe]), Asia Pacific (China, India, Japan, South Korea, Vietnam, Singapore, Australia, Rest of Asia Pacific), Middle East & Africa (Middle East [UAE, Egypt, Saudi Arabia, Qatar, Rest of Middle East], Africa [Nigeria, South Africa, Rest of Africa], Latin America (Brazil, Argentina, Colombia Rest of Latin America)
Company Profiles ADTRAN, Inc. (U.S.), Calix, Inc. (U.S.),  Clena Corporation (U.S.), CISCO SYSTEMS, INC. (U.S.), Huawei Investment & Holding Co., Ltd. (China), Infinera Corporation (U.S.), Nokia Corporation (Finland), Telefonaktiebolaget LM Ericsson (Sweden), TP-Link Corporation Limited. (China), ZTE Corporation
Key Drivers

• PONs provide dependable connectivity, crucial for businesses and consumers alike
• Increasing demand for Low Ownership Cost, Reliable Network.

Market Opportunities

• The growing number of internet users worldwide creates a larger demand for data transfer capacity
• IT professionals are focusing their research and development efforts on improving PON technology.


Frequently Asked Questions

Ans: Passive Optical Network Market is anticipated to expand by 8.5% from 2023 to 2030.

Ans: Asia-Pacific is dominating the market.

Ans: Passive Optical Network Market size was valued at USD 14.07 billion in 2023

Ans:  USD 41.86 billion is expected to grow by 2031.

Ans: The growing number of internet users worldwide creates a larger demand for data transfer capacity

TABLE OF CONTENTS

1. Introduction

1.1 Market Definition

1.2 Scope

1.3 Research Assumptions

2. Industry Flowchart

3. Research Methodology

4. Market Dynamics

4.1 Drivers

4.2 Restraints

4.3 Opportunities

4.4 Challenges

5. Impact Analysis

5.1 Impact of Russia-Ukraine Crisis

5.2 Impact of Economic Slowdown on Major Countries

5.2.1 Introduction

5.2.2 United States

5.2.3 Canada

5.2.4 Germany

5.2.5 France

5.2.6 UK

5.2.7 China

5.2.8 Japan

5.2.9 South Korea

5.2.10 India

6. Value Chain Analysis

7. Porter’s 5 Forces Model

8. Pest Analysis

9. Passive Optical Network Market Segmentation, By Type

9.1 Introduction

9.2 Trend Analysis

9.3 EPON

9.4 GPON

9.5 Others (Next-Gen PON)

10. Passive Optical Network Market Segmentation, By Component

10.1 Introduction

10.2 Trend Analysis

10.3 Optical Line Terminal (OLT)

10.4 Optical Network Terminal (ONT)

10.5 Optical Distribution Network (ODN)

11. Passive Optical Network Market Segmentation, By Application

11.1 Introduction

11.2 Trend Analysis

11.3 FFTX

11.3.1 FTTH

11.3.2 FTTB

11.3.3 FTTP

11.4 Mobile Backhaul

12. Regional Analysis

12.1 Introduction

12.2 North America

12.2.1 Trend Analysis

12.2.2 North America Passive Optical Network Market by Country

12.2.3 North America Passive Optical Network Market By Type

12.2.4 North America Passive Optical Network Market By Component

12.2.5 North America Passive Optical Network Market By Application

12.2.6 USA

12.2.6.1 USA Passive Optical Network Market By Type

12.2.6.2 USA Passive Optical Network Market By Component

12.2.6.3 USA Passive Optical Network Market By Application

12.2.7 Canada

12.2.7.1 Canada Passive Optical Network Market By Type

12.2.7.2 Canada Passive Optical Network Market By Component

12.2.7.3 Canada Passive Optical Network Market By Application

12.2.8 Mexico

12.2.8.1 Mexico Passive Optical Network Market By Type

12.2.8.2 Mexico Passive Optical Network Market By Component

12.2.8.3 Mexico Passive Optical Network Market By Application

12.3 Europe

12.3.1 Trend Analysis

12.3.2 Eastern Europe

12.3.2.1 Eastern Europe Passive Optical Network Market by Country

12.3.2.2 Eastern Europe Passive Optical Network Market By Type

12.3.2.3 Eastern Europe Passive Optical Network Market By Component

12.3.2.4 Eastern Europe Passive Optical Network Market By Application

12.3.2.5 Poland

12.3.2.5.1 Poland Passive Optical Network Market By Type

12.3.2.5.2 Poland Passive Optical Network Market By Component

12.3.2.5.3 Poland Passive Optical Network Market By Application

12.3.2.6 Romania

12.3.2.6.1 Romania Passive Optical Network Market By Type

12.3.2.6.2 Romania Passive Optical Network Market By Component

12.3.2.6.4 Romania Passive Optical Network Market By Application

12.3.2.7 Hungary

12.3.2.7.1 Hungary Passive Optical Network Market By Type

12.3.2.7.2 Hungary Passive Optical Network Market By Component

12.3.2.7.3 Hungary Passive Optical Network Market By Application

12.3.2.8 Turkey

12.3.2.8.1 Turkey Passive Optical Network Market By Type

12.3.2.8.2 Turkey Passive Optical Network Market By Component

12.3.2.8.3 Turkey Passive Optical Network Market By Application

12.3.2.9 Rest of Eastern Europe

12.3.2.9.1 Rest of Eastern Europe Passive Optical Network Market By Type

12.3.2.9.2 Rest of Eastern Europe Passive Optical Network Market By Component

12.3.2.9.3 Rest of Eastern Europe Passive Optical Network Market By Application

12.3.3 Western Europe

12.3.3.1 Western Europe Passive Optical Network Market by Country

12.3.3.2 Western Europe Passive Optical Network Market By Type

12.3.3.3 Western Europe Passive Optical Network Market By Component

12.3.3.4 Western Europe Passive Optical Network Market By Application

12.3.3.5 Germany

12.3.3.5.1 Germany Passive Optical Network Market By Type

12.3.3.5.2 Germany Passive Optical Network Market By Component

12.3.3.5.3 Germany Passive Optical Network Market By Application

12.3.3.6 France

12.3.3.6.1 France Passive Optical Network Market By Type

12.3.3.6.2 France Passive Optical Network Market By Component

12.3.3.6.3 France Passive Optical Network Market By Application

12.3.3.7 UK

12.3.3.7.1 UK Passive Optical Network Market By Type

12.3.3.7.2 UK Passive Optical Network Market By Component

12.3.3.7.3 UK Passive Optical Network Market By Application

12.3.3.8 Italy

12.3.3.8.1 Italy Passive Optical Network Market By Type

12.3.3.8.2 Italy Passive Optical Network Market By Component

12.3.3.8.3 Italy Passive Optical Network Market By Application

12.3.3.9 Spain

12.3.3.9.1 Spain Passive Optical Network Market By Type

12.3.3.9.2 Spain Passive Optical Network Market By Component

12.3.3.9.3 Spain Passive Optical Network Market By Application

12.3.3.10 Netherlands

12.3.3.10.1 Netherlands Passive Optical Network Market By Type

12.3.3.10.2 Netherlands Passive Optical Network Market By Component

12.3.3.10.3 Netherlands Passive Optical Network Market By Application

12.3.3.11 Switzerland

12.3.3.11.1 Switzerland Passive Optical Network Market By Type

12.3.3.11.2 Switzerland Passive Optical Network Market By Component

12.3.3.11.3 Switzerland Passive Optical Network Market By Application

12.3.3.1.12 Austria

12.3.3.12.1 Austria Passive Optical Network Market By Type

12.3.3.12.2 Austria Passive Optical Network Market By Component

12.3.3.12.3 Austria Passive Optical Network Market By Application

12.3.3.13 Rest of Western Europe

12.3.3.13.1 Rest of Western Europe Passive Optical Network Market By Type

12.3.3.13.2 Rest of Western Europe Passive Optical Network Market By Component

12.3.3.13.3 Rest of Western Europe Passive Optical Network Market By Application

12.4 Asia-Pacific

12.4.1 Trend Analysis

12.4.2 Asia-Pacific Passive Optical Network Market by Country

12.4.3 Asia-Pacific Passive Optical Network Market By Type

12.4.4 Asia-Pacific Passive Optical Network Market By Component

12.4.5 Asia-Pacific Passive Optical Network Market By Application

12.4.6 China

12.4.6.1 China Passive Optical Network Market By Type

12.4.6.2 China Passive Optical Network Market By Component

12.4.6.3 China Passive Optical Network Market By Application

12.4.7 India

12.4.7.1 India Passive Optical Network Market By Type

12.4.7.2 India Passive Optical Network Market By Component

12.4.7.3 India Passive Optical Network Market By Application

12.4.8 Japan

12.4.8.1 Japan Passive Optical Network Market By Type

12.4.8.2 Japan Passive Optical Network Market By Component

12.4.8.3 Japan Passive Optical Network Market By Application

12.4.9 South Korea

12.4.9.1 South Korea Passive Optical Network Market By Type

12.4.9.2 South Korea Passive Optical Network Market By Component

12.4.9.3 South Korea Passive Optical Network Market By Application

12.4.10 Vietnam

12.4.10.1 Vietnam Passive Optical Network Market By Type

12.4.10.2 Vietnam Passive Optical Network Market By Component

12.4.10.3 Vietnam Passive Optical Network Market By Application

12.4.11 Singapore

12.4.11.1 Singapore Passive Optical Network Market By Type

12.4.11.2 Singapore Passive Optical Network Market By Component

12.4.11.3 Singapore Passive Optical Network Market By Application

12.4.12 Australia

12.4.12.1 Australia Passive Optical Network Market By Type

12.4.12.2 Australia Passive Optical Network Market By Component

12.4.12.3 Australia Passive Optical Network Market By Application

12.4.13 Rest of Asia-Pacific

12.4.13.1 Rest of Asia-Pacific Passive Optical Network Market By Type

12.4.13.2 Rest of Asia-Pacific Passive Optical Network Market By Component

12.4.13.3 Rest of Asia-Pacific Passive Optical Network Market By Application

12.5 Middle East & Africa

12.5.1 Trend Analysis

12.5.2 Middle East

12.5.2.1 Middle East Passive Optical Network Market by Country

12.5.2.2 Middle East Passive Optical Network Market By Type

12.5.2.3 Middle East Passive Optical Network Market By Component

12.5.2.4 Middle East Passive Optical Network Market By Application

12.5.2.5 UAE

12.5.2.5.1 UAE Passive Optical Network Market By Type

12.5.2.5.2 UAE Passive Optical Network Market By Component

12.5.2.5.3 UAE Passive Optical Network Market By Application

12.5.2.6 Egypt

12.5.2.6.1 Egypt Passive Optical Network Market By Type

12.5.2.6.2 Egypt Passive Optical Network Market By Component

12.5.2.6.3 Egypt Passive Optical Network Market By Application

12.5.2.7 Saudi Arabia

12.5.2.7.1 Saudi Arabia Passive Optical Network Market By Type

12.5.2.7.2 Saudi Arabia Passive Optical Network Market By Component

12.5.2.7.3 Saudi Arabia Passive Optical Network Market By Application

12.5.2.8 Qatar

12.5.2.8.1 Qatar Passive Optical Network Market By Type

12.5.2.8.2 Qatar Passive Optical Network Market By Component

12.5.2.8.3 Qatar Passive Optical Network Market By Application

12.5.2.9 Rest of Middle East

12.5.2.9.1 Rest of Middle East Passive Optical Network Market By Type

12.5.2.9.2 Rest of Middle East Passive Optical Network Market By Component

12.5.2.9.3 Rest of Middle East Passive Optical Network Market By Application

12.5.3 Africa

12.5.3.1 Africa Passive Optical Network Market by Country

12.5.3.2 Africa Passive Optical Network Market By Type

12.5.3.3 Africa Passive Optical Network Market By Component

12.5.3.4 Africa Passive Optical Network Market By Application

12.5.3.5 Nigeria

12.5.3.5.1 Nigeria Passive Optical Network Market By Type

12.5.3.5.2 Nigeria Passive Optical Network Market By Component

12.5.3.5.3 Nigeria Passive Optical Network Market By Application

12.5.3.6 South Africa

12.5.3.6.1 South Africa Passive Optical Network Market By Type

12.5.3.6.2 South Africa Passive Optical Network Market By Component

12.5.3.6.3 South Africa Passive Optical Network Market By Application

12.5.3.7 Rest of Africa

12.5.3.7.1 Rest of Africa Passive Optical Network Market By Type

12.5.3.7.2 Rest of Africa Passive Optical Network Market By Component

12.5.3.7.3 Rest of Africa Passive Optical Network Market By Application

12.6 Latin America

12.6.1 Trend Analysis

12.6.2 Latin America Passive Optical Network Market by country

12.6.3 Latin America Passive Optical Network Market By Type

12.6.4 Latin America Passive Optical Network Market By Component

12.6.5 Latin America Passive Optical Network Market By Application

12.6.6 Brazil

12.6.6.1 Brazil Passive Optical Network Market By Type

12.6.6.2 Brazil Passive Optical Network Market By Component

12.6.6.3 Brazil Passive Optical Network Market By Application

12.6.7 Argentina

12.6.7.1 Argentina Passive Optical Network Market By Type

12.6.7.2 Argentina Passive Optical Network Market By Component

12.6.7.3 Argentina Passive Optical Network Market By Application

12.6.8 Colombia

12.6.8.1 Colombia Passive Optical Network Market By Type

12.6.8.2 Colombia Passive Optical Network Market By Component

12.6.8.3 Colombia Passive Optical Network Market By Application

12.6.9 Rest of Latin America

12.6.9.1 Rest of Latin America Passive Optical Network Market By Type

12.6.9.2 Rest of Latin America Passive Optical Network Market By Component

12.6.9.3 Rest of Latin America Passive Optical Network Market By Application

13. Company Profiles

13.1 ADTRAN, Inc

13.1.1 Company Overview

13.1.2 Financial

13.1.3 Products/ Services Offered

13.1.4 SWOT Analysis

13.1.5 The SNS View

13.2 Calix, Inc

13.2.1 Company Overview

13.2.2 Financial

13.2.3 Products/ Services Offered

13.2.4 SWOT Analysis

13.2.5 The SNS View

13.3 Clena Corporation

13.3.1 Company Overview

13.3.2 Financial

13.3.3 Products/ Services Offered

13.3.4 SWOT Analysis

13.3.5 The SNS View

13.4 CISCO SYSTEMS, INC

13.4.1 Company Overview

13.4.2 Financial

13.4.3 Products/ Services Offered

13.4.4 SWOT Analysis

13.4.5 The SNS View

13.5 Huawei Investment & Holding Co., Ltd

13.5.1 Company Overview

13.5.2 Financial

13.5.3 Products/ Services Offered

13.5.4 SWOT Analysis

13.5.5 The SNS View

13.6 Infinera Corporation

13.6.1 Company Overview

13.6.2 Financial

13.6.3 Products/ Services Offered

13.6.4 SWOT Analysis

13.6.5 The SNS View

13.7 Nokia Corporation

13.7.1 Company Overview

13.7.2 Financial

13.7.3 Products/ Services Offered

13.7.4 SWOT Analysis

13.7.5 The SNS View

13.8 Telefonaktiebolaget LM Ericsson

13.8.1 Company Overview

13.8.2 Financial

13.8.3 Products/ Services Offered

13.8.4 SWOT Analysis

13.8.5 The SNS View

13.9 TP-Link Corporation Limited

13.9.1 Company Overview

13.9.2 Financial

13.9.3 Products/ Services Offered

13.9.4 SWOT Analysis

13.9.5 The SNS View

13.10 ZTE Corporation

13.10.1 Company Overview

13.10.2 Financial

13.10.3 Products/ Services Offered

13.10.4 SWOT Analysis

13.10.5 The SNS View

14. Competitive Landscape

14.1 Competitive Benchmarking

14.2 Market Share Analysis

14.3 Recent Developments

14.3.1 Industry News

14.3.2 Company News

14.3.3 Mergers & Acquisitions

15. Use Case and Best Practices

16. Conclusion

An accurate research report requires proper strategizing as well as implementation. There are multiple factors involved in the completion of good and accurate research report and selecting the best methodology to compete the research is the toughest part. Since the research reports we provide play a crucial role in any company’s decision-making process, therefore we at SNS Insider always believe that we should choose the best method which gives us results closer to reality. This allows us to reach at a stage wherein we can provide our clients best and accurate investment to output ratio.

Each report that we prepare takes a timeframe of 350-400 business hours for production. Starting from the selection of titles through a couple of in-depth brain storming session to the final QC process before uploading our titles on our website we dedicate around 350 working hours. The titles are selected based on their current market cap and the foreseen CAGR and growth.


The 5 steps process:

Step 1: Secondary Research:

Secondary Research or Desk Research is as the name suggests is a research process wherein, we collect data through the readily available information. In this process we use various paid and unpaid databases which our team has access to and gather data through the same. This includes examining of listed companies’ annual reports, Journals, SEC filling etc. Apart from this our team has access to various associations across the globe across different industries. Lastly, we have exchange relationships with various university as well as individual libraries.
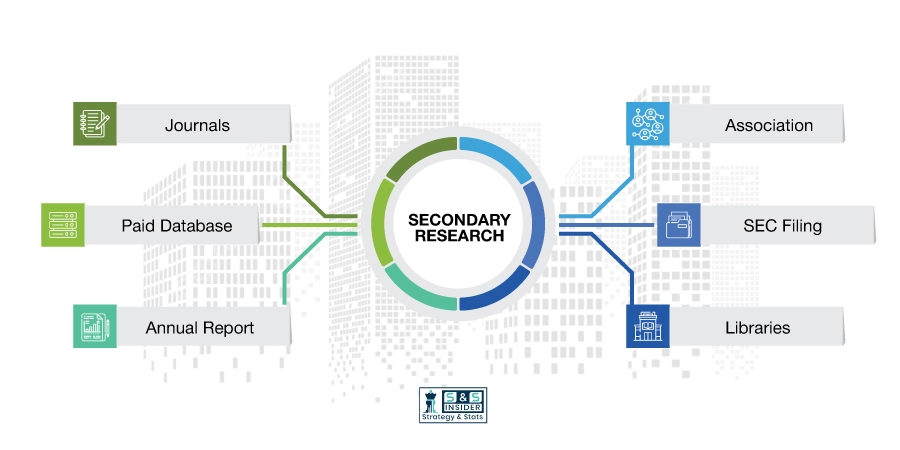
Secondary Research

Step 2: Primary Research

When we talk about primary research, it is a type of study in which the researchers collect relevant data samples directly, rather than relying on previously collected data.  This type of research is focused on gaining content specific facts that can be sued to solve specific problems. Since the collected data is fresh and first hand therefore it makes the study more accurate and genuine.

We at SNS Insider have divided Primary Research into 2 parts.

Part 1 wherein we interview the KOLs of major players as well as the upcoming ones across various geographic regions. This allows us to have their view over the market scenario and acts as an important tool to come closer to the accurate market numbers. As many as 45 paid and unpaid primary interviews are taken from both the demand and supply side of the industry to make sure we land at an accurate judgement and analysis of the market.

This step involves the triangulation of data wherein our team analyses the interview transcripts, online survey responses and observation of on filed participants. The below mentioned chart should give a better understanding of the part 1 of the primary interview.
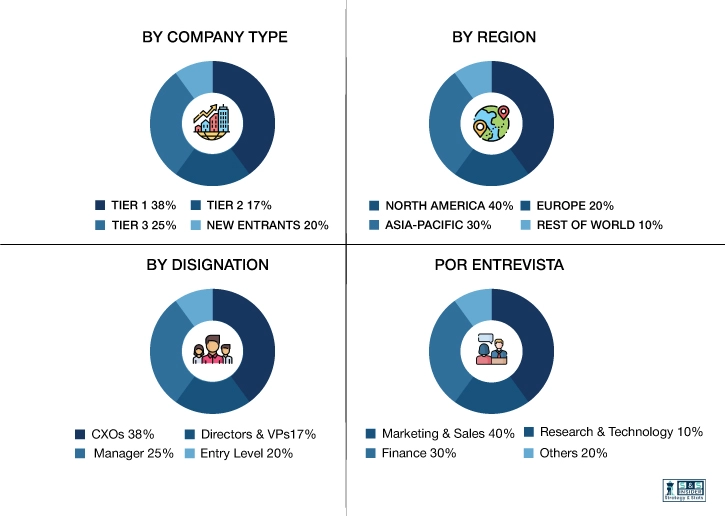
Primary Research

Part 2: In this part of primary research the data collected via secondary research and the part 1 of the primary research is validated with the interviews from individual consultants and subject matter experts.

Consultants are those set of people who have at least 12 years of experience and expertise within the industry whereas Subject Matter Experts are those with at least 15 years of experience behind their back within the same space. The data with the help of two main processes i.e., FGDs (Focused Group Discussions) and IDs (Individual Discussions). This gives us a 3rd party nonbiased primary view of the market scenario making it a more dependable one while collation of the data pointers.

Step 3: Data Bank Validation

Once all the information is collected via primary and secondary sources, we run that information for data validation. At our intelligence centre our research heads track a lot of information related to the market which includes the quarterly reports, the daily stock prices, and other relevant information. Our data bank server gets updated every fortnight and that is how the information which we collected using our primary and secondary information is revalidated in real time.

Data Bank Validation

Step 4: QA/QC Process

After all the data collection and validation our team does a final level of quality check and quality assurance to get rid of any unwanted or undesired mistakes. This might include but not limited to getting rid of the any typos, duplication of numbers or missing of any important information. The people involved in this process include technical content writers, research heads and graphics people. Once this process is completed the title gets uploader on our platform for our clients to read it.

Step 5: Final QC/QA Process:

This is the last process and comes when the client has ordered the study. In this process a final QA/QC is done before the study is emailed to the client. Since we believe in giving our clients a good experience of our research studies, therefore, to make sure that we do not lack at our end in any way humanly possible we do a final round of quality check and then dispatch the study to the client.

Start a Conversation

Hi! Click one of our member below to chat on Phone