Blockchain Devices Market Size:

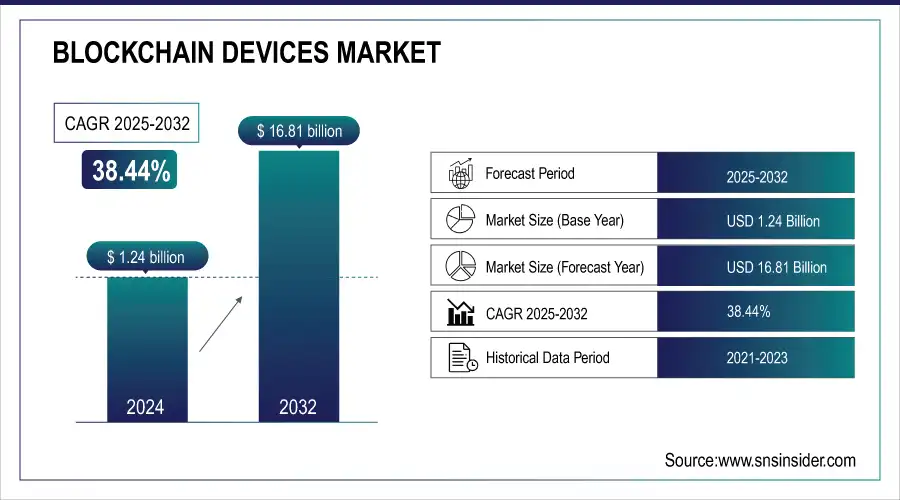
The Blockchain Devices Market Size was valued at USD 1.24 Billion in 2024 and is expected to grow at a CAGR of 38.44% to reach USD 16.81 Billion by 2032.

Blockchain Devices Market Revenue Analysis

Get more information on Blockchain Devices Market - Request Sample Report

The Blockchain Devices Market experienced an extraordinary growth over 2024 and 2025, stimulated by the joint forces of a government policy orientation, emerging innovation in technology, and growing acceptability across industry domains. Everywhere around the globe, governments have actively taken up adoption of blockchain and introduced policies towards further integration within financial systems, supply chains, and digital identification. For example, in 2023, the European Union launched the European Blockchain Services Infrastructure initiative with the aim of improving interoperability and developing or promoting the use of blockchain technology across member states. Both the United States and China put significant amounts of money into the research and development of blockchain technologies, further reinforcing efforts toward tech leadership positions. In the Asia-Pacific region, India launched the National Blockchain Strategy, pointing to governance and citizen services as key catalysts for blockchain adoption.

Technological advancements in blockchain devices have ignited further growth in the market. The launch of secure hardware wallets in 2023 incorporated biometric authentication and multi-signature functionality, which indicated emphasis on security. Decentralized storage solutions and IoT-enabled blockchain devices emerged popular in 2024, especially for integration with the development of smart cities and other cutting-edge technologies. The innovation in blockchain-enabled IoT devices has been very promising in sectors like energy management and connected healthcare. Quantum-resistant blockchain devices are now emerging with developments that are countering vulnerabilities, thus securing them for a longer period of time. For instance, Solana Introduces Quantum-Resistant Vault for Crypto Security. The crypto world has just gotten a little more futuristic because Solana developers have released a new quantum-resistant vault. This feature was branded the "Solana Winternitz Vault." The vault's goal is to safeguard user funds by protecting it from potential risks presented by quantum computers.

Blockchain-Devices-Market-US

The future prospects for the Blockchain Devices Market are promising, as connectivity is expected to advance, government-backed blockchain platforms and cross-border digital currency systems will redefine the market landscape. As global organizations and governments prioritize digital transformation, the demand for blockchain devices is going to surge, making them integral to the evolution of the digital economy.

Key Blockchain Devices Trends:

  • Growing adoption of blockchain-based solutions by governments for transparency, efficiency, and fraud prevention.

  • Implementation of blockchain-enabled land registration and e-governance reducing fraud and administrative delays.

  • Rising demand for secure hardware wallets, decentralized storage, and identity verification systems.

  • Increasing reliance on blockchain devices in decentralized finance (DeFi) and cryptocurrency transactions.

  • Adoption of blockchain devices by financial institutions for faster, tamper-proof cross-border transactions.

Blockchain Devices Growth Drivers:

  • Increasing state-level adoption of blockchain solutions.

Increasingly governments worldwide have opted for blockchain-based solutions to deliver more transparent and efficient, also more secure and secure solutions within their sectors. In 2024, Indian State implemented blockchain-enabled land registration services in several States which resulted in reducing fraud up to 85% and administrative delay. Moreover, Dubai blockchain-powered eGovt conducted most of the transactions via the digital channels saving resources drastically.

This growing governmental interest fosters a strong demand for blockchain devices, including secure hardware wallets, decentralized storage solutions, and identity verification systems. These are devices that will make processes streamlined and securely data-managed activities, focusing on digitization and fraud prevention goals pursued by governments. Demand for specialized devices is a sure bet, exponentially growing as public institutions continue to embrace blockchain technology.

  • Increased adoption of blockchain devices for financial applications.

Blockchain gadgets have gained paramount importance in the financial applications revolving around decentralized finance (DeFi), cryptocurrency-based transactions, and digital identity management. Recent research in 2024 shows that most of the global cryptocurrency users rely on hardware wallets when doing financial transactions. Additionally, financial institutions have adopted blockchain devices for faster and tamper-proof cross-border transactions, reducing settlement times. As more individuals and businesses adopt blockchain for financial security and efficiency, demand for these devices will remain a key driver in the market.

Blockchain Devices Restraints:

  • High initial costs of blockchain devices hinder widespread adoption.

One of the significant barriers to the adoption of blockchain devices is the high initial cost of these devices. In the case of SMEs and individuals in developing regions, this could be a serious barrier. Hardware wallets can be as expensive as USD 100 or more, and enterprise-grade blockchain devices such as decentralized storage nodes can cost thousands of dollars. This cost burden is further magnified by the need for the users to learn and use supplementary software that would often need expert training.

The World Bank recently published in 2024, a research where it discovered that low-income countries SMEs mentioned the costs as a hindrance in their adoption of blockchain solutions. This means blockchain technology has its own limitations toward making access democratized for the utilization of decentralized, secure systems. The key issue is cost, and so it is time that industry players began to think along the lines of cost optimization or perhaps subsidized programs, government grants to make this sort of product affordable and available for everyone.

Blockchain Devices Segment Analysis:
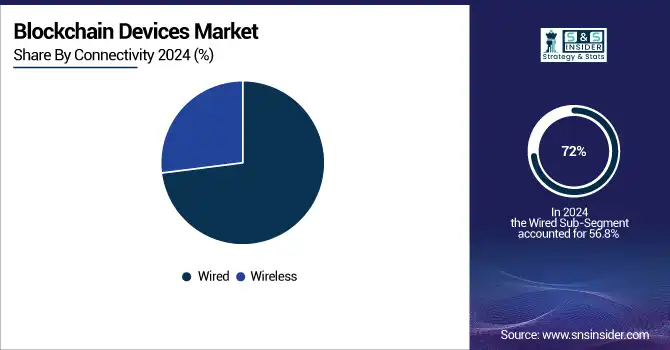
By Connectivity

Wired segment dominated the Blockchain Devices Market in 2024 with 72% market share. The growth of wired devices can be attributed to the reliability and security of their connections, which is very important for enterprise-grade applications such as supply chain management and large-scale financial transactions. They also have faster data transfer rates and lower latency, making them ideal for high-stakes operations.

The Wireless segment is projected to grow at the fastest CAGR of 38.90% during the forecast period of 2025-2032. This growth is driven by rising demand for mobility and IoT with blockchain devices. Wireless connectivity also allows blockchain operations to be managed easily through smartphones and other portable devices catering to tech-savvy individuals and decentralized applications. Advanced wireless standards like Wi-Fi 6 and 5G further accelerate growth in this segment, enabling faster and more secure device operations.

Blockchain-Devices-Market-By-By-Connectivity

By Application

The Corporate segment dominated the market in 2024 and covered 79% of the share. Enterprise blockchain are becoming increasingly used in securing financial transactions, digital identity management, and supply chain processes. ERP has also seen improvement in operation by the use of blockchain integration that has significantly minimized fraud cases. For example, multinational corporations, such as IBM and Walmart, have used blockchain devices to attain near real-time tracking in their supply chains and thus reduced inefficiencies by more than 50%.

The Personal segment is expected to grow at the highest CAGR of 38.99% from 2025 to 2032. This is attributed to the fast-growing popularity of cryptocurrency trading and increasing awareness of personal data security. In 2024, approximately 34% of cryptocurrency users worldwide used hardware wallets, which is expected to double by 2030. User-friendly and low-cost devices are driving innovation in this segment, including biometric authentication and mobile application integration. This trend presents the possibility that blockchain devices can become a mass consumer technology.

Blockchain Devices Regional Analysis:

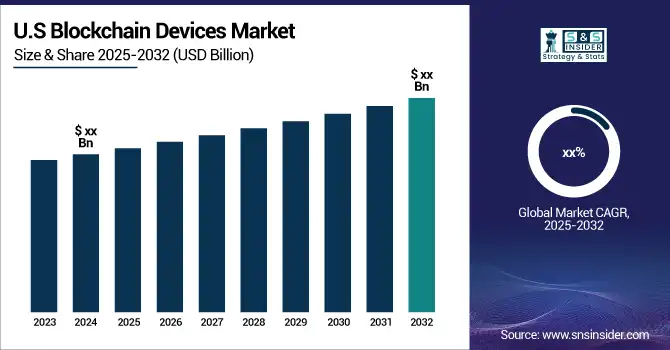
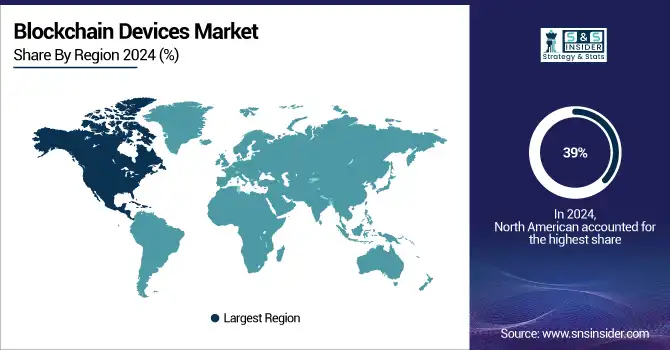
North America Blockchain Devices Insights

In 2024, the North America had a highest market share, reaching 39%. The dominant role of North America is linked to the top positions of this region by the significant players in blockchain technology, with beneficial government policy, and important investments in the R&D sectors. The USA and Canada have also taken the first place in sectors, such as financial and medical institutions, introducing and adopting blockchain innovations in their workflow.

Blockchain-Devices-Market-By-Region

Get Customized Report as per your Business Requirement - Request For Customized Report

Asia Pacific Blockchain Devices Insights

The Asia Pacific region is expected to lead the market at the highest CAGR of 39.09% during the forecast period of 2025-2032. The growth in the region is driven by fast-paced digital transformation in countries like China, India, and Singapore. Government initiatives such as China's Blockchain Service Network (BSN) and India's National Blockchain Strategy have spurred investments in blockchain infrastructure and devices. These countries' burgeoning start-ups and the rising adoption of cryptocurrency further emphasize the massive opportunity for blockchain devices within the region.

Europe Blockchain Devices Insights

Europe is a key market for blockchain devices, driven by strong regulatory frameworks, digital transformation initiatives, and growing adoption of decentralized finance. Countries like Germany, Switzerland, and the U.K. are leading in cryptocurrency usage and blockchain integration, fueling demand for secure hardware wallets, identity solutions, and enterprise-focused blockchain applications.

Latin America (LATAM) and Middle East & Africa (MEA) Blockchain Devices Insights

LATAM and MEA markets are experiencing steady growth in blockchain devices, supported by rising cryptocurrency adoption, remittance-driven economies, and government-led digitization efforts. Countries such as Brazil, Mexico, the UAE, and South Africa are embracing secure wallets, decentralized applications, and blockchain-enabled services, enhancing financial inclusion and streamlining cross-border transactions across these emerging regions.

Blockchain Devices Key Players:

Some of the major players in the Blockchain Devices Market are  

  • Ledger (Nano X, Nano S Plus)

  • Trezor (Model T, One)

  • HTC (Exodus 1, Exodus 1s)

  • Samsung (KlaytnPhone, Galaxy Blockchain)

  • Bitmain (Antminer S19, Antminer T19)

  • Pundi X (XPOS, XWallet)

  • SIRIN Labs (FINNEY, Secure Comms)

  • Canaan (AvalonMiner, AI Chips)

  • ELLIPAL (Titan, Titan Mini)

  • Coldcard (Mk4, COLDCARD Wallet)

  • Binance (Binance Card, Trust Wallet)

  • SecuX (V20, W20)

  • KeepKey (Hardware Wallet)

  • Tangem (Tangem Cards, Crypto Storage)

  • Bitfi (Bitfi Wallet)

  • OpenDime (Bitcoin Stick, Cold Storage Device)

  • SafePal (S1 Wallet, Mobile App)

  • IBM (Blockchain Platform, Supply Chain Solutions)

  • Intel (Blockchain Solutions, Chipsets)

  • Microsoft (Azure Blockchain, Developer Tools)

Major Suppliers (Components, Technologies)

  • Taiwan Semiconductor Manufacturing Company (Chipsets, Microprocessors)

  • Samsung Foundry (Memory Chips, Processors)

  • SK Hynix (Flash Memory, DRAM)

  • NXP Semiconductors (NFC Chips, IoT Components)

  • Infineon Technologies (Security Chips, Cryptography Modules)

  • STMicroelectronics (Microcontrollers, Integrated Circuits)

  • Micron Technology (Memory Solutions)

  • Texas Instruments (Sensors, Analog Devices)

  • Advanced Micro Devices (GPUs, Processors)

  • NVIDIA (Graphics Processing Units)

Competitive Landscape for Blockchain Devices:

Trezor is a pioneer in blockchain devices, recognized for introducing the world’s first hardware wallet. The company focuses on providing secure, user-friendly solutions for cryptocurrency storage and transaction verification. With products like Trezor One and Model T, it emphasizes privacy, open-source security, and accessibility, making it a trusted choice in blockchain ecosystems.

  • June 2024: Trezor, a maker of crypto hardware wallets, announced a new family of products in three items during the BTC Prague 2024: the Trezor Safe 5 hardware wallet, a bitcoin-only version and the "Trezor Expert" onboarding service.

Ledger is a global leader in blockchain devices, specializing in secure hardware wallets such as Nano X and Nano S Plus. The company provides advanced solutions for safeguarding digital assets, enabling secure transactions, and managing decentralized applications. With strong security architecture and wide adoption, Ledger plays a vital role in blockchain device innovation.

  • May 2024: French startup Ledger, which has been most prominent for its secure crypto hardware wallets, is shipping new wallets nearly 18 months after announcing the latest Ledger Stax devices. The new wallet features an E Ink display and has been designed in partnership with Tony Fadell, one of the main designers behind the iPod.


Blockchain Devices Market Report Scope:

Report Attributes Details
Market Size in 2024 USD 1.24 Billion
Market Size by 2032 USD 16.81 Billion
CAGR CAGR of 38.44% From 2024 to 2032
Base Year 2024
Forecast Period 2025-2032
Historical Data 2021-2023
Report Scope & Coverage Market Size, Segments Analysis, Competitive Landscape, Regional Analysis, DROC & SWOT Analysis, Forecast Outlook
Key Segments • By Connectivity (Wired, Wireless)
• By Component (Crypto Hardware Wallets, Blockchain Smartphones, Crypto ATMs, Blockchain IoT Gateways, POS Devices, Other)
• By Application (Corporate, Personal)
• By End-User (Consumer, BFSI, Government, Retail & E-commerce, Transportation & Logistics, Travel & Hospitality, Automotive, IT & Telecommunication, Others)
Regional Analysis/Coverage North America (US, Canada), Europe (Germany, UK, France, Italy, Spain, Russia, Poland, Rest of Europe), Asia Pacific (China, India, Japan, South Korea, Australia, ASEAN Countries, Rest of Asia Pacific), Middle East & Africa (UAE, Saudi Arabia, Qatar, South Africa, Rest of Middle East & Africa), Latin America (Brazil, Argentina, Mexico, Colombia, Rest of Latin America).
Company Profiles Ledger, Trezor, HTC, Samsung, Bitmain, Pundi X, SIRIN Labs, Canaan, ELLIPAL, Coldcard, Binance, SecuX, KeepKey, Tangem, Bitfi, OpenDime, SafePal, IBM, Intel, Microsoft.

Table Of Contents

1. Introduction

1.1 Market Definition & Scope

 1.2 Research Assumptions & Abbreviations

 1.3 Research Methodology

2. Executive Summary

2.1 Market Snapshot

 2.2 Market Absolute $ Opportunity Assessment & Y-o-Y Analysis, 2021–2032

 2.3 Market Size & Forecast, By Segmentation, 2021–2032

  2.3.1 Market Size By Connectivity

  2.3.2 Market Size By Component

 2.3.3 Market Size By Application

 2.3.4 Market Size By End-User

 2.4 Market Share & Bps Analysis By Region, 2024

 2.5 Industry Growth Scenarios – Conservative, Likely & Optimistic

 2.6 Industry CxO’s Perspective

3. Market Overview

3.1 Market Dynamics

  3.1.1 Drivers

  3.1.2 Restraints

  3.1.3 Opportunities

  3.1.4 Key Market Trends

 3.2 Industry PESTLE Analysis

 3.3 Key Industry Forces (Porter’s) Impacting Market Growth

 3.4 Industry Supply Chain Analysis

  3.4.1 Raw Material Suppliers

  3.4.2 Manufacturers

  3.4.3 Distributors/Suppliers

  3.4.4 Customers/End-Users

 3.5 Industry Life Cycle Assessment

 3.6 Parent Market Overview

 3.7 Market Risk Assessment

4. Statistical Insights & Trends Reporting

4.1 Security & Performance Metrics

4.1.1 Average transaction validation speed (TPS) across blockchain hardware devices

4.1.2 Percentage reduction in fraud/cybersecurity breaches (%) with blockchain devices

4.1.3 Share of devices supporting multi-signature and biometric authentication (%)

4.2 Adoption & Deployment Trends

4.2.1 Percentage of retail vs. enterprise vs. government adoption of blockchain devices

4.2.2 Year-on-year growth (%) in demand for hardware wallets, PoS devices, and crypto ATMs

4.2.3 Share of blockchain devices integrated with cross-border payment solutions (%)

4.3 Connectivity & Integration Metrics

4.3.1 Share of blockchain devices supporting multi-currency transactions (%)

4.3.2 Adoption rate (%) of blockchain devices integrated with IoT and supply chain platforms

4.3.3 Percentage of devices compatible with decentralized applications (dApps) and Web3 ecosystems

4.4 Cost & Revenue Benchmarks

4.4.1 Average cost (USD) of blockchain hardware wallets, ATMs, and PoS devices

4.4.2 Share of recurring revenue (%) from transaction fees, subscriptions, and device upgrades

4.4.3 Average lifecycle duration (years) of blockchain devices before replacement/upgrade

5. Blockchain Devices Market Segmental Analysis & Forecast, By Connectivity, 2021 – 2032, Value (USD Billion)

5.1 Introduction

 5.2 Wired

  5.2.1 Key Trends

  5.2.2 Market Size & Forecast, 2021 – 2032

 5.3 Wireless

  5.3.1 Key Trends

  5.3.2 Market Size & Forecast, 2021 – 2032

6. Blockchain Devices Market Segmental Analysis & Forecast, By Component, 2021 – 2032, Value (USD Billion)

    6.1 Introduction

 6.2 Crypto Hardware Wallets

  6.2.1 Key Trends

  6.2.2 Market Size & Forecast, 2021 – 2032

 6.3 Blockchain Smartphones

  6.3.1 Key Trends

  6.3.2 Market Size & Forecast, 2021 – 2032

 6.4 Crypto ATMs

  6.4.1 Key Trends

  6.4.2 Market Size & Forecast, 2021 – 2032

 6.5 Blockchain IoT Gateways

  6.5.1 Key Trends

  6.5.2 Market Size & Forecast, 2021 – 2032

 6.6 POS Devices

  6.6.1 Key Trends

  6.6.2 Market Size & Forecast, 2021 – 2032

 6.7 Others

  6.7.1 Key Trends

  6.7.2 Market Size & Forecast, 2021 – 2032

7. Blockchain Devices Market Segmental Analysis & Forecast, By Application, 2021 – 2032, Value (USD Billion)

    7.1 Introduction

 7.2 Corporate

  7.2.1 Key Trends

  7.2.2 Market Size & Forecast, 2021 – 2032

 7.3 Personal

  7.3.1 Key Trends

  7.3.2 Market Size & Forecast, 2021 – 2032

8. Blockchain Devices Market Segmental Analysis & Forecast, By End-User, 2021 – 2032, Value (USD Billion)

    8.1 Introduction

 8.2 Consumer

  8.2.1 Key Trends

  8.2.2 Market Size & Forecast, 2021 – 2032

 8.3 BFSI

  8.3.1 Key Trends

  8.3.2 Market Size & Forecast, 2021 – 2032

 8.4 Government

  8.4.1 Key Trends

  8.4.2 Market Size & Forecast, 2021 – 2032

 8.5 Retail & E-commerce

  8.5.1 Key Trends

  8.5.2 Market Size & Forecast, 2021 – 2032

 8.6 Transportation & Logistics

  8.6.1 Key Trends

  8.6.2 Market Size & Forecast, 2021 – 2032

 8.7 Travel & Hospitality

  8.7.1 Key Trends

  8.7.2 Market Size & Forecast, 2021 – 2032

 8.8 Automotive

  8.8.1 Key Trends

  8.8.2 Market Size & Forecast, 2021 – 2032.

 8.9 IT & Telecommunication

  8.9.1 Key Trends

  8.9.2 Market Size & Forecast, 2021 – 2032

 8.10 Others

  8.10.1 Key Trends

  8.10.2 Market Size & Forecast, 2021 – 2032

9. Blockchain Devices Market Segmental Analysis & Forecast By Region, 2021 – 2025, Value (USD Billion)

9.1 Introduction

9.2 North America

 9.2.1 Key Trends

 9.2.2 Blockchain Devices Market Size & Forecast, By Connectivity, 2021 – 2032

 9.2.3 Blockchain Devices Market Size & Forecast, By Component, 2021 – 2032

 9.2.4 Blockchain Devices Market Size & Forecast, By Application, 2021 – 2032

 9.2.5 Blockchain Devices Market Size & Forecast, By End-User, 2021 – 2032

 9.2.6 Blockchain Devices Market Size & Forecast, By Country, 2021 – 2032

  9.2.6.1 USA

   9.2.6.1.1 Blockchain Devices Market Size & Forecast, By Connectivity, 2021 – 2032

   9.2.6.1.2 Blockchain Devices Market Size & Forecast, By Component, 2021 – 2032

   9.2.6.1.3 Blockchain Devices Market Size & Forecast, By Application, 2021 – 2032

   9.2.6.1.4 Blockchain Devices Market Size & Forecast, By End-User, 2021 – 2032

  9.2.6.2 Canada

   9.2.6.2.1 Blockchain Devices Market Size & Forecast, By Connectivity, 2021 – 2032

   9.2.6.2.2 Blockchain Devices Market Size & Forecast, By Component, 2021 – 2032

   9.2.6.2.3 Blockchain Devices Market Size & Forecast, By Application, 2021 – 2032

   9.2.6.2.4 Blockchain Devices Market Size & Forecast, By End-User, 2021 – 2032

9.3 Europe

 9.3.1 Key Trends

 9.3.2 Blockchain Devices Market Size & Forecast, By Connectivity, 2021 – 2032

 9.3.3 Blockchain Devices Market Size & Forecast, By Component, 2021 – 2032

 9.3.4 Blockchain Devices Market Size & Forecast, By Application, 2021 – 2032

 9.3.5 Blockchain Devices Market Size & Forecast, By End-User, 2021 – 2032

 9.3.6 Blockchain Devices Market Size & Forecast, By Country, 2021 – 2032

  9.3.6.1 Germany

   9.3.6.1.1 Blockchain Devices Market Size & Forecast, By Connectivity, 2021 – 2032

   9.3.6.1.2 Blockchain Devices Market Size & Forecast, By Component, 2021 – 2032

   9.3.6.1.3 Blockchain Devices Market Size & Forecast, By Application, 2021 – 2032

   9.3.6.1.4 Blockchain Devices Market Size & Forecast, By End-User, 2021 – 2032

  9.3.6.2 UK

   9.3.6.2.1 Blockchain Devices Market Size & Forecast, By Connectivity, 2021 – 2032

   9.3.6.2.2 Blockchain Devices Market Size & Forecast, By Component, 2021 – 2032

   9.3.6.2.3 Blockchain Devices Market Size & Forecast, By Application, 2021 – 2032

   9.3.6.2.4 Blockchain Devices Market Size & Forecast, By End-User, 2021 – 2032

  9.3.6.3 France

   9.3.6.3.1 Blockchain Devices Market Size & Forecast, By Connectivity, 2021 – 2032

   9.3.6.3.2 Blockchain Devices Market Size & Forecast, By Component, 2021 – 2032

   9.3.6.3.3 Blockchain Devices Market Size & Forecast, By Application, 2021 – 2032

   9.3.6.3.4 Blockchain Devices Market Size & Forecast, By End-User, 2021 – 2032

  9.3.6.4 Italy

   9.3.6.4.1 Blockchain Devices Market Size & Forecast, By Connectivity, 2021 – 2032

   9.3.6.4.2 Blockchain Devices Market Size & Forecast, By Component, 2021 – 2032

   9.3.6.4.3 Blockchain Devices Market Size & Forecast, By Application, 2021 – 2032

   9.3.6.4.4 Blockchain Devices Market Size & Forecast, By End-User, 2021 – 2032

  9.3.6.5 Spain

   9.3.6.5.1 Blockchain Devices Market Size & Forecast, By Connectivity, 2021 – 2032

   9.3.6.5.2 Blockchain Devices Market Size & Forecast, By Component, 2021 – 2032

   9.3.6.5.3 Blockchain Devices Market Size & Forecast, By Application, 2021 – 2032

   9.3.6.5.4 Blockchain Devices Market Size & Forecast, By End-User, 2021 – 2032

  9.3.6.6 Russia

   9.3.6.6.1 Blockchain Devices Market Size & Forecast, By Connectivity, 2021 – 2032

   9.3.6.6.2 Blockchain Devices Market Size & Forecast, By Component, 2021 – 2032

   9.3.6.6.3 Blockchain Devices Market Size & Forecast, By Application, 2021 – 2032

   9.3.6.6.4 Blockchain Devices Market Size & Forecast, By End-User, 2021 – 2032

  9.3.6.7 Poland

   9.3.6.7.1 Blockchain Devices Market Size & Forecast, By Connectivity, 2021 – 2032

   9.3.6.7.2 Blockchain Devices Market Size & Forecast, By Component, 2021 – 2032

   9.3.6.7.3 Blockchain Devices Market Size & Forecast, By Application, 2021 – 2032

   9.3.6.7.4 Blockchain Devices Market Size & Forecast, By End-User, 2021 – 2032

  9.3.6.8 Rest of Europe

   9.3.6.8.1 Blockchain Devices Market Size & Forecast, By Connectivity, 2021 – 2032

   9.3.6.8.2 Blockchain Devices Market Size & Forecast, By Component, 2021 – 2032

   9.3.6.8.3 Blockchain Devices Market Size & Forecast, By Application, 2021 – 2032

   9.3.6.8.4 Blockchain Devices Market Size & Forecast, By End-User, 2021 – 2032   

9.4 Asia-Pacific

 9.4.1 Key Trends

 9.4.2 Blockchain Devices Market Size & Forecast, By Connectivity, 2021 – 2032

 9.4.3 Blockchain Devices Market Size & Forecast, By Component, 2021 – 2032

 9.4.4 Blockchain Devices Market Size & Forecast, By Application, 2021 – 2032

 9.4.5 Blockchain Devices Market Size & Forecast, By End-User, 2021 – 2032

 9.4.6 Blockchain Devices Market Size & Forecast, By Country, 2021 – 2032

  9.4.6.1 China

   9.4.6.1.1 Blockchain Devices Market Size & Forecast, By Connectivity, 2021 – 2032

   9.4.6.1.2 Blockchain Devices Market Size & Forecast, By Component, 2021 – 2032

   9.4.6.1.3 Blockchain Devices Market Size & Forecast, By Application, 2021 – 2032

   9.4.6.1.4 Blockchain Devices Market Size & Forecast, By End-User, 2021 – 2032

  9.4.6.2 India

   9.4.6.2.1 Blockchain Devices Market Size & Forecast, By Connectivity, 2021 – 2032

   9.4.6.2.2 Blockchain Devices Market Size & Forecast, By Component, 2021 – 2032

   9.4.6.2.3 Blockchain Devices Market Size & Forecast, By Application, 2021 – 2032

   9.4.6.2.4 Blockchain Devices Market Size & Forecast, By End-User, 2021 – 2032

  9.4.6.3 Japan

   9.4.6.3.1 Blockchain Devices Market Size & Forecast, By Connectivity, 2021 – 2032

   9.4.6.3.2 Blockchain Devices Market Size & Forecast, By Component, 2021 – 2032

   9.4.6.3.3 Blockchain Devices Market Size & Forecast, By Application, 2021 – 2032

   9.4.6.3.4 Blockchain Devices Market Size & Forecast, By End-User, 2021 – 2032

  9.4.6.4 South Korea

   9.4.6.4.1 Blockchain Devices Market Size & Forecast, By Connectivity, 2021 – 2032

   9.4.6.4.2 Blockchain Devices Market Size & Forecast, By Component, 2021 – 2032

   9.4.6.4.3 Blockchain Devices Market Size & Forecast, By Application, 2021 – 2032

   9.4.6.4.4 Blockchain Devices Market Size & Forecast, By End-User, 2021 – 2032

  9.4.6.5 Australia

   9.4.6.5.1 Blockchain Devices Market Size & Forecast, By Connectivity, 2021 – 2032

   9.4.6.5.2 Blockchain Devices Market Size & Forecast, By Component, 2021 – 2032

   9.4.6.5.3 Blockchain Devices Market Size & Forecast, By Application, 2021 – 2032

   9.4.6.5.4 Blockchain Devices Market Size & Forecast, By End-User, 2021 – 2032

  9.4.6.6 ASEAN Countries

   9.4.6.6.1 Blockchain Devices Market Size & Forecast, By Connectivity, 2021 – 2032

   9.4.6.6.2 Blockchain Devices Market Size & Forecast, By Component, 2021 – 2032

   9.4.6.6.3 Blockchain Devices Market Size & Forecast, By Application, 2021 – 2032

   9.4.6.6.4 Blockchain Devices Market Size & Forecast, By End-User, 2021 – 2032

  9.4.6.7 Rest of Asia-Pacific

   9.4.6.7.1 Blockchain Devices Market Size & Forecast, By Connectivity, 2021 – 2032

   9.4.6.7.2 Blockchain Devices Market Size & Forecast, By Component, 2021 – 2032

   9.4.6.7.3 Blockchain Devices Market Size & Forecast, By Application, 2021 – 2032

   9.4.6.7.4 Blockchain Devices Market Size & Forecast, By End-User, 2021 – 2032

9.5 Latin America

 9.5.1 Key Trends

 9.5.2 Blockchain Devices Market Size & Forecast, By Connectivity, 2021 – 2032

 9.5.3 Blockchain Devices Market Size & Forecast, By Component, 2021 – 2032

 9.5.4 Blockchain Devices Market Size & Forecast, By Application, 2021 – 2032

 9.5.5 Blockchain Devices Market Size & Forecast, By End-User, 2021 – 2032

 9.5.6 Blockchain Devices Market Size & Forecast, By Country, 2021 – 2032

  9.5.6.1 Brazil

   9.5.6.1.1 Blockchain Devices Market Size & Forecast, By Connectivity, 2021 – 2032

   9.5.6.1.2 Blockchain Devices Market Size & Forecast, By Component, 2021 – 2032

   9.5.6.1.3 Blockchain Devices Market Size & Forecast, By Application, 2021 – 2032

   9.5.6.1.4 Blockchain Devices Market Size & Forecast, By End-User, 2021 – 2032

  9.5.6.2 Argentina

   9.5.6.2.1 Blockchain Devices Market Size & Forecast, By Connectivity, 2021 – 2032

   9.5.6.2.2 Blockchain Devices Market Size & Forecast, By Component, 2021 – 2032

   9.5.6.2.3 Blockchain Devices Market Size & Forecast, By Application, 2021 – 2032

   9.5.6.2.4 Blockchain Devices Market Size & Forecast, By End-User, 2021 – 2032

  9.5.6.3 Mexico

   9.5.6.3.1 Blockchain Devices Market Size & Forecast, By Connectivity, 2021 – 2032

   9.5.6.3.2 Blockchain Devices Market Size & Forecast, By Component, 2021 – 2032

   9.5.6.3.3 Blockchain Devices Market Size & Forecast, By Application, 2021 – 2032

   9.5.6.3.4 Blockchain Devices Market Size & Forecast, By End-User, 2021 – 2032

  9.5.6.4 Colombia

   9.5.6.4.1 Blockchain Devices Market Size & Forecast, By Connectivity, 2021 – 2032

   9.5.6.4.2 Blockchain Devices Market Size & Forecast, By Component, 2021 – 2032

   9.5.6.4.3 Blockchain Devices Market Size & Forecast, By Application, 2021 – 2032

   9.5.6.4.4 Blockchain Devices Market Size & Forecast, By End-User, 2021 – 2032

  9.5.6.5 Rest of Latin America

   9.5.6.5.1 Blockchain Devices Market Size & Forecast, By Connectivity, 2021 – 2032

   9.5.6.5.2 Blockchain Devices Market Size & Forecast, By Component, 2021 – 2032

   9.5.6.5.3 Blockchain Devices Market Size & Forecast, By Application, 2021 – 2032

   9.5.6.5.4 Blockchain Devices Market Size & Forecast, By End-User, 2021 – 2032

9.6 Middle East & Africa

 9.6.1 Key Trends

 9.6.2 Blockchain Devices Market Size & Forecast, By Connectivity, 2021 – 2032

 9.6.3 Blockchain Devices Market Size & Forecast, By Component, 2021 – 2032

 9.6.4 Blockchain Devices Market Size & Forecast, By Application, 2021 – 2032

 9.6.5 Blockchain Devices Market Size & Forecast, By End-User, 2021 – 2032

 9.6.6 Blockchain Devices Market Size & Forecast, By Country, 2021 – 2032

  9.6.6.1 UAE

   9.6.6.1.1 Blockchain Devices Market Size & Forecast, By Connectivity, 2021 – 2032

   9.6.6.1.2 Blockchain Devices Market Size & Forecast, By Component, 2021 – 2032

   9.6.6.1.3 Blockchain Devices Market Size & Forecast, By Application, 2021 – 2032

   9.6.6.1.4 Blockchain Devices Market Size & Forecast, By End-User, 2021 – 2032

  9.6.6.2 Saudi Arabia

   9.6.6.2.1 Blockchain Devices Market Size & Forecast, By Connectivity, 2021 – 2032

   9.6.6.2.2 Blockchain Devices Market Size & Forecast, By Component, 2021 – 2032

   9.6.6.2.3 Blockchain Devices Market Size & Forecast, By Application, 2021 – 2032

   9.6.6.2.4 Blockchain Devices Market Size & Forecast, By End-User, 2021 – 2032

  9.6.6.3 Qatar

   9.6.6.3.1 Blockchain Devices Market Size & Forecast, By Connectivity, 2021 – 2032

   9.6.6.3.2 Blockchain Devices Market Size & Forecast, By Component, 2021 – 2032

   9.6.6.3.3 Blockchain Devices Market Size & Forecast, By Application, 2021 – 2032

   9.6.6.3.4 Blockchain Devices Market Size & Forecast, By End-User, 2021 – 2032

  9.6.6.4 Egypt

   9.6.6.4.1 Blockchain Devices Market Size & Forecast, By Connectivity, 2021 – 2032

   9.6.6.4.2 Blockchain Devices Market Size & Forecast, By Component, 2021 – 2032

   9.6.6.4.3 Blockchain Devices Market Size & Forecast, By Application, 2021 – 2032

   9.6.6.4.4 Blockchain Devices Market Size & Forecast, By End-User, 2021 – 2032

  9.6.6.5 South Africa

   9.6.6.5.1 Blockchain Devices Market Size & Forecast, By Connectivity, 2021 – 2032

   9.6.6.5.2 Blockchain Devices Market Size & Forecast, By Component, 2021 – 2032

   9.6.6.5.3 Blockchain Devices Market Size & Forecast, By Application, 2021 – 2032

   9.6.6.5.4 Blockchain Devices Market Size & Forecast, By End-User, 2021 – 2032

  9.6.6.6 Rest of Middle East & Africa

   9.6.6.6.1 Blockchain Devices Market Size & Forecast, By Connectivity, 2021 – 2032

   9.6.6.6.2 Blockchain Devices Market Size & Forecast, By Component, 2021 – 2032

   9.6.6.6.3 Blockchain Devices Market Size & Forecast, By Application, 2021 – 2032

   9.6.6.6.4 Blockchain Devices Market Size & Forecast, By End-User, 2021 – 2032

10. Competitive Landscape

 10.1 Key Players' Positioning

 10.2 Competitive Developments

  10.2.1 Key Strategies Adopted (%), By Key Players, 2024

  10.2.2 Year-Wise Strategies & Development, 2021 – 2025

  10.2.3 Number Of Strategies Adopted By Key Players, 2024

 10.3 Market Share Analysis, 2024

 10.4 Product/Service & Application Benchmarking

  10.4.1 Product/Service Specifications & Features By Key Players

  10.4.2 Product/Service Heatmap By Key Players

  10.4.3 Application Heatmap By Key Players

 10.5 Industry Start-Up & Innovation Landscape

10.6 Key Company Profiles

 10.6.1 Ledger.

  10.6.1.1 Company Overview & Snapshot

  10.6.1.2 Product/Service Portfolio

  10.6.1.3 Key Company Financials

  10.6.1.4 SWOT Analysis

 10.6.2 Trezor.

  10.6.2.1 Company Overview & Snapshot

  10.6.2.2 Product/Service Portfolio

  10.6.2.3 Key Company Financials

  10.6.2.4 SWOT Analysis

 10.6.3 HTC.

  10.6.3.1 Company Overview & Snapshot

  10.6.3.2 Product/Service Portfolio

  10.6.3.3 Key Company Financials

  10.6.3.4 SWOT Analysis

 10.6.4 Samsung.

  10.6.4.1 Company Overview & Snapshot

  10.6.4.2 Product/Service Portfolio

  10.6.4.3 Key Company Financials

  10.6.4.4 SWOT Analysis

 10.6.5 Bitmain

  10.6.5.1 Company Overview & Snapshot

  10.6.5.2 Product/Service Portfolio

  10.6.5.3 Key Company Financials

  10.6.5.4 SWOT Analysis

 10.6.6 Pundi X.

  10.6.6.1 Company Overview & Snapshot

  10.6.6.2 Product/Service Portfolio

  10.6.6.3 Key Company Financials

  10.6.6.4 SWOT Analysis

 10.6.7 SIRIN Labs

  10.6.7.1 Company Overview & Snapshot

  10.6.7.2 Product/Service Portfolio

  10.6.7.3 Key Company Financials

  10.6.7.4 SWOT Analysis

 10.6.8 Canaan.

  10.6.8.1 Company Overview & Snapshot

  10.6.8.2 Product/Service Portfolio

  10.6.8.3 Key Company Financials

  10.6.8.4 SWOT Analysis

 10.6.9 ELLIPAL.

  10.6.9.1 Company Overview & Snapshot

  10.6.9.2 Product/Service Portfolio

  10.6.9.3 Key Company Financials

  10.6.9.4 SWOT Analysis

 10.6.10 Coldcard.

  10.6.10.1 Company Overview & Snapshot

  10.6.10.2 Product/Service Portfolio

  10.6.10.3 Key Company Financials

  10.6.10.4 SWOT Analysis

 10.6.11 Binance.

  10.6.11.1 Company Overview & Snapshot

  10.6.11.2 Product/Service Portfolio

  10.6.11.3 Key Company Financials

  10.6.11.4 SWOT Analysis

 10.6.12 SecuX.

  10.6.12.1 Company Overview & Snapshot

  10.6.12.2 Product/Service Portfolio

  10.6.12.3 Key Company Financials

  10.6.12.4 SWOT Analysis

 10.6.13 KeepKey.

  10.6.13.1 Company Overview & Snapshot

  10.6.13.2 Product/Service Portfolio

  10.6.13.3 Key Company Financials

  10.6.13.4 SWOT Analysis

 10.6.14 Tangem.

  10.6.14.1 Company Overview & Snapshot

  10.6.14.2 Product/Service Portfolio

  10.6.14.3 Key Company Financials

  10.6.14.4 SWOT Analysis

 10.6.15 Bitfi.

  10.6.15.1 Company Overview & Snapshot

  10.6.15.2 Product/Service Portfolio

  10.6.15.3 Key Company Financials

  10.6.15.4 SWOT Analysis

 10.6.16 OpenDime.

  10.6.16.1 Company Overview & Snapshot

  10.6.16.2 Product/Service Portfolio

  10.6.16.3 Key Company Financials

  10.6.16.4 SWOT Analysis

 10.6.17 SafePal.

  10.6.17.1 Company Overview & Snapshot

  10.6.17.2 Product/Service Portfolio

  10.6.17.3 Key Company Financials

  10.6.17.4 SWOT Analysis

 10.6.18 IBM.

  10.6.18.1 Company Overview & Snapshot

  10.6.18.2 Product/Service Portfolio

  10.6.18.3 Key Company Financials

  10.6.18.4 SWOT Analysis

 10.6.19 Intel.

  10.6.19.1 Company Overview & Snapshot

  10.6.19.2 Product/Service Portfolio

  10.6.19.3 Key Company Financials

  10.6.19.4 SWOT Analysis

 10.6.20 Microsoft.

  10.6.20.1 Company Overview & Snapshot

  10.6.20.2 Product/Service Portfolio

  10.6.20.3 Key Company Financials

  10.6.20.4 SWOT Analysis

11. Analyst Recommendations

 11.1 SNS Insider Opportunity Map

 11.2 Industry Low-Hanging Fruit Assessment

 11.3 Market Entry & Growth Strategy

 11.4 Analyst Viewpoint & Suggestions On Market Growth

12. Assumptions

13. Disclaimer

14. Appendix

 14.1 List Of Tables

 14.2 List Of Figures

Market Segmentation

By Connectivity

  • Wired

  • Wireless

By Component

  • Crypto Hardware Wallets

  • Blockchain Smartphones

  • Crypto ATMs

  • Blockchain IoT Gateways

  • POS Devices

  • Others

By Application

  • Corporate

  • Personal

By End-User

  • Consumer

  • BFSI

  • Government

  • Retail & E-commerce

  • Transportation & Logistics

  • Travel & Hospitality

  • Automotive

  • IT & Telecommunication

  • Others

Request for Segment Customization as per your Business Requirement: Segment Customization Request

Regional Coverage:

North America

  • US

  • Canada

  • Mexico

Europe

  • Eastern Europe

    • Poland

    • Romania

    • Hungary

    • Turkey

    • Rest of Eastern Europe

  • Western Europe

    • Germany

    • France

    • UK

    • Italy

    • Spain

    • Netherlands

    • Switzerland

    • Austria

    • Rest of Western Europe

Asia Pacific

  • China

  • India

  • Japan

  • South Korea

  • Vietnam

  • Singapore

  • Australia

  • Rest of Asia Pacific

Middle East & Africa

  • Middle East

    • UAE

    • Egypt

    • Saudi Arabia

    • Qatar

    • Rest of the Middle East

  • Africa

    • Nigeria

    • South Africa

    • Rest of Africa

Latin America

  • Brazil

  • Argentina

  • Colombia

  • Rest of Latin America

Request for Country Level Research Report: Country Level Customization Request

Available Customization

With the given market data, SNS Insider offers customization as per the company’s specific needs. The following customization options are available for the report:

  • Product Analysis

  • Criss-Cross segment analysis (e.g. Product X Application)

  • Product Matrix which gives a detailed comparison of product portfolio of each company

  • Geographic Analysis

  • Additional countries in any of the regions

  • Company Information

  • Detailed analysis and profiling of additional market players (Up to five)

An accurate research report requires proper strategizing as well as implementation. There are multiple factors involved in the completion of good and accurate research report and selecting the best methodology to compete the research is the toughest part. Since the research reports we provide play a crucial role in any company’s decision-making process, therefore we at SNS Insider always believe that we should choose the best method which gives us results closer to reality. This allows us to reach at a stage wherein we can provide our clients best and accurate investment to output ratio.

Each report that we prepare takes a timeframe of 350-400 business hours for production. Starting from the selection of titles through a couple of in-depth brain storming session to the final QC process before uploading our titles on our website we dedicate around 350 working hours. The titles are selected based on their current market cap and the foreseen CAGR and growth.


The 5 steps process:

Step 1: Secondary Research:

Secondary Research or Desk Research is as the name suggests is a research process wherein, we collect data through the readily available information. In this process we use various paid and unpaid databases which our team has access to and gather data through the same. This includes examining of listed companies’ annual reports, Journals, SEC filling etc. Apart from this our team has access to various associations across the globe across different industries. Lastly, we have exchange relationships with various university as well as individual libraries.

Secondary Research

Step 2: Primary Research

When we talk about primary research, it is a type of study in which the researchers collect relevant data samples directly, rather than relying on previously collected data.  This type of research is focused on gaining content specific facts that can be sued to solve specific problems. Since the collected data is fresh and first hand therefore it makes the study more accurate and genuine.

We at SNS Insider have divided Primary Research into 2 parts.

Part 1 wherein we interview the KOLs of major players as well as the upcoming ones across various geographic regions. This allows us to have their view over the market scenario and acts as an important tool to come closer to the accurate market numbers. As many as 45 paid and unpaid primary interviews are taken from both the demand and supply side of the industry to make sure we land at an accurate judgement and analysis of the market.

This step involves the triangulation of data wherein our team analyses the interview transcripts, online survey responses and observation of on filed participants. The below mentioned chart should give a better understanding of the part 1 of the primary interview.

Primary Research

Part 2: In this part of primary research the data collected via secondary research and the part 1 of the primary research is validated with the interviews from individual consultants and subject matter experts.

Consultants are those set of people who have at least 12 years of experience and expertise within the industry whereas Subject Matter Experts are those with at least 15 years of experience behind their back within the same space. The data with the help of two main processes i.e., FGDs (Focused Group Discussions) and IDs (Individual Discussions). This gives us a 3rd party nonbiased primary view of the market scenario making it a more dependable one while collation of the data pointers.

Step 3: Data Bank Validation

Once all the information is collected via primary and secondary sources, we run that information for data validation. At our intelligence centre our research heads track a lot of information related to the market which includes the quarterly reports, the daily stock prices, and other relevant information. Our data bank server gets updated every fortnight and that is how the information which we collected using our primary and secondary information is revalidated in real time.

Data Bank Validation

Step 4: QA/QC Process

After all the data collection and validation our team does a final level of quality check and quality assurance to get rid of any unwanted or undesired mistakes. This might include but not limited to getting rid of the any typos, duplication of numbers or missing of any important information. The people involved in this process include technical content writers, research heads and graphics people. Once this process is completed the title gets uploader on our platform for our clients to read it.

Step 5: Final QC/QA Process:

This is the last process and comes when the client has ordered the study. In this process a final QA/QC is done before the study is emailed to the client. Since we believe in giving our clients a good experience of our research studies, therefore, to make sure that we do not lack at our end in any way humanly possible we do a final round of quality check and then dispatch the study to the client.