Personalized Nutrition Market Report Scope & Overview:
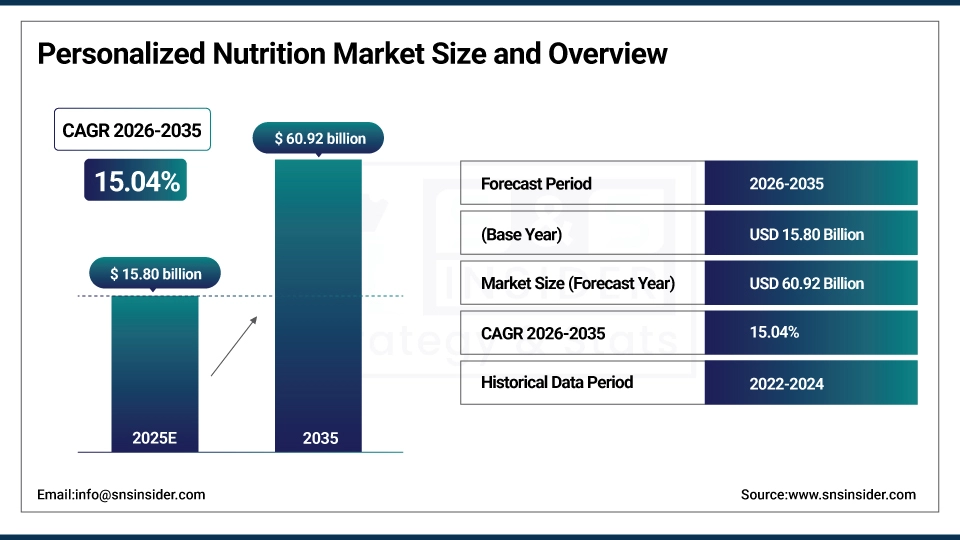
The Personalized Nutrition Market size was valued at USD 15.80 billion in 2025 and is expected to reach USD 60.92 billion by 2035, growing at a CAGR of 15.04% over the forecast period of 2026-2035.
The global personalized nutrition market trend is a growing demand for individualized dietary solutions such as DNA-based nutrition programs, nutrigenomics testing, and AI-powered dietary supplement recommendations as the growth of the market is driven by increasing consumer awareness about preventive healthcare, rising prevalence of lifestyle-related chronic diseases, and growing expectations for tailored wellness solutions based on individual biological data. This trend is also driven by a growing adoption of wearable health monitoring devices and the growing focus on precision nutrition as consumers become more focused on optimizing their health outcomes and are more willing to invest in customized functional foods, beverages, and dietary supplements, resulting in growth in the domestic and international market for direct-to-consumer and clinically supported personalized nutrition platforms and products.
For instance, in March 2024, growing consumer awareness and improved digital health infrastructure drove a 24% increase in direct-to-consumer personalized nutrition platform subscriptions across North America, boosting demand for DNA-based dietary supplement programs and AI-driven meal planning services.
Personalized Nutrition Market Size and Forecast:
-
Market Size in 2025: USD 15.80 billion
-
Market Size by 2035: USD 60.92 billion
-
CAGR: 15.04% from 2026 to 2035
-
Base Year: 2025
-
Forecast Period: 2026–2035
-
Historical Data: 2022–2024
To Get more information on Personalized Nutrition Market - Request Free Sample Report
Personalized Nutrition Market Trends
-
Personalized nutrition solutions are being adopted as consumers demand data-driven dietary guidance, customized supplement formulations, and health outcome tracking based on their unique genetic, metabolic, and lifestyle profiles.
-
Customized dietary supplement and nutraceutical programs based on nutrigenomic testing, gut microbiome analysis, and blood biomarker data to improve individual health outcomes and chronic disease management.
-
The development of AI-powered nutrition coaching apps, digitized DNA platforms, and personalized functional food formulations to improve dietary adherence and reduce the burden of nutrition-related chronic conditions.
-
Sports nutrigenomics programs, performance-optimized supplementation, and real-time biometric monitoring are all available to ensure continuous delivery of tailored athletic nutrition and recovery support.
-
Increased demand for convenient product formats including capsules, powders, and liquid supplements with clean-label ingredients and scientifically validated formulations to meet evolving consumer health and wellness expectations.
-
Collaboration between nutritional science companies, genetic testing providers, and digital health platforms to develop integrated personalized nutrition ecosystems and improve standards of consumer data privacy and recommendation accuracy.
-
FDA, FTC, and EFSA promoting standards for nutritional supplement labeling, health claims substantiation, consumer data protection, and responsible use of genetic information in dietary recommendation platforms.
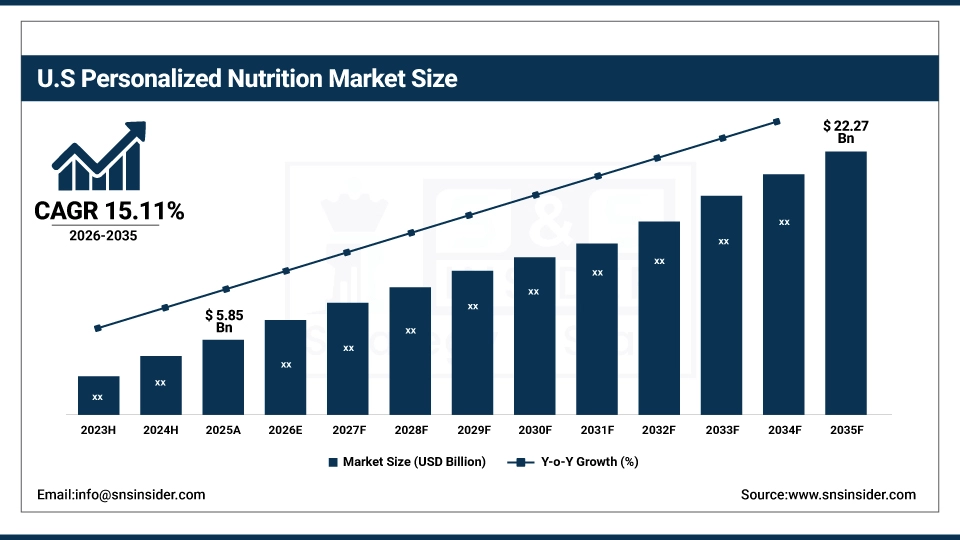
The U.S. Personalized Nutrition Market was valued at USD 5.85 billion in 2025 and is expected to reach USD 22.27 billion by 2035, growing at a CAGR of 15.11% from 2026-2035. The United States represents the largest market for personalized nutrition, primarily driven by high consumer health awareness, widespread adoption of direct-to-consumer genetic testing services, and well-developed e-commerce and digital health infrastructure. Government interest in precision medicine, moderately high levels of health insurance engagement with preventive wellness programs, and increased consumer and corporate spending on nutrition technology help to drive growth in the market. Also, the U.S. is the largest regional market in the world, due to the regulatory clarity and swift adoption of digitized DNA platforms and AI-integrated personalized nutrition solutions.
Personalized Nutrition Market Growth Drivers:
-
Rising Consumer Demand for Preventive Healthcare and Precision Wellness is Driving the Personalized Nutrition Market Growth
Rising consumer demand for preventive healthcare and precision wellness takes the center stage as a growth driver for the personalized nutrition market share, and is driven by the growing prevalence of obesity, diabetes, cardiovascular disease, and other lifestyle-linked chronic conditions that are pushing consumers toward proactive, data-driven dietary management. These solutions for individualized nutrition and disease-based supplementation are expanding the base of the market, the penetration of direct-to-consumer and clinically supported product channels, and adding to the overall market share globally.
For instance, in May 2024, personalized dietary supplement and DNA-based nutrition programs accounted for ~58% of total new consumer wellness product purchases in the U.S., reflecting growing institutional preference and expanding market share across direct-to-consumer and wellness center channels.
Personalized Nutrition Market Restraints:
-
High Product Costs and Consumer Data Privacy Concerns are Hampering the Personalized Nutrition Market Growth
High product costs and consumer data privacy concerns of personalized nutrition platforms also restrict the personalized nutrition market growth, as a large number of consumers who are aware of personalized nutrition solutions remain price-sensitive or face hesitation about sharing genetic, biometric, and dietary data with commercial platforms. This might lead to limited adoption, reduced subscription retention, and slower return on investment for nutrition technology companies. As a result, market penetration suffers and growth is stunted in regions where disposable incomes are lower and consumer trust in digital health data handling is limited.
Personalized Nutrition Market Opportunities:
-
Expansion of Sports Nutrigenomics and AI-Powered Dietary Platforms Drive Future Growth Opportunities for the Personalized Nutrition Market
The opportunity in sports nutrigenomics and AI-powered dietary platforms in the personalized nutrition market is in the form of performance-optimized supplement programs, genetic fitness profiling, and real-time nutritional adjustment tools. These solutions provide for early identification of micronutrient deficiencies, individualized macronutrient distribution recommendations, and real-time dietary adherence monitoring. Through enhanced athlete performance, injury recovery optimization, and population-level dietary therapy management capabilities, particularly in regions with high sports participation and growing fitness culture investments, these technologies may improve health outcomes, reduce chronic disease incidence, and expand the market.
For instance, in April 2024, the Global Wellness Institute reported that 68% of fitness center members in North America expressed active interest in personalized nutrition programs linked to their workout biometrics, highlighting rising platform demand and increasing adoption of sports nutrition and nutrigenomics-based dietary solutions.
Personalized Nutrition Market Segment Analysis
-
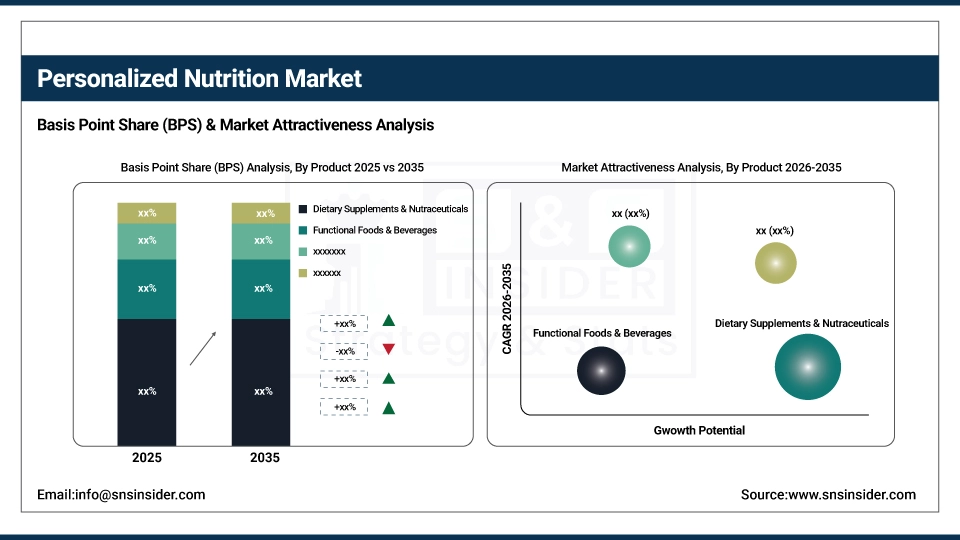
By product, dietary supplements & nutraceuticals held the largest share of around 42.36% in 2025E, and the digitized DNA segment is expected to register the highest growth with a CAGR of 17.82%.
-
By measurement method, active measurement dominated the market with approximately 61.47% share in 2025E, while standard measurement is expected to register steady growth over the forecast period.
-
By form, capsules accounted for the leading share of nearly 34.19% in 2025E, while powder is expected to register the highest growth with a CAGR of 16.54%.
-
By application, standard supplement accounted for the largest share of around 48.73% in 2025E, and the disease-based segment is expected to register the highest growth with a CAGR of 16.91%.
-
By end user, direct-to-consumer accounted for the leading share of nearly 53.28% in 2025E, and is expected to register the highest growth with a CAGR of 15.63%.
By Product, Dietary Supplements & Nutraceuticals Lead the Market, While Digitized DNA Registers Fastest Growth
The dietary supplements & nutraceuticals segment accounted for the highest revenue share of approximately 42.36% in 2025, owing to high consumer familiarity with supplement regimens, strong retail and e-commerce distribution networks, and the expanding range of condition-specific formulations targeting immunity, gut health, weight management, and cognitive performance. Emerging trends, including increasing demand for clean-label, science-backed supplement products and the growing integration of personalized supplement subscriptions into digital wellness platforms. In comparison, the digitized DNA segment is anticipated to achieve the highest CAGR of nearly 17.82% during the 2026–2035 period, driven by the increasing consumer adoption of at-home genetic testing kits and the growing availability of nutrigenomic insights that link DNA profiles to customized dietary and supplement recommendations. Drivers include rising awareness of genetic predispositions to nutritional deficiencies, the preference for science-backed dietary personalization, and growing partnerships between DNA testing companies and nutrition brands. Functional foods & beverages and sports nutrigenomics are also growing steadily as consumers seek nutrition solutions embedded into daily eating habits and athletic performance programs.
By End User, Direct-To-Consumer Leads, and Registers Fastest Growth
The direct-to-consumer segment accounted for the largest share of the personalized nutrition market with about 53.28%, owing to the rapid growth of e-commerce, subscription-based nutrition platforms, and consumer preference for convenient, at-home health management solutions that bypass traditional clinical or retail intermediaries. Reasons driving the direct-to-consumer segment include increasing smartphone penetration, rising use of nutrition and fitness apps, and growing consumer willingness to invest in self-directed preventive wellness programs. In addition, it is slated to grow at the fastest rate with a CAGR of around 15.63% throughout the forecast period of 2026–2035, as personalized nutrition brands expand their digital reach and leverage AI-driven consumer profiling to improve recommendation relevance and subscription retention. Wellness & fitness centers and hospitals & clinics also represent growing end-user segments, as gyms and healthcare providers increasingly integrate personalized dietary programs into client wellness offerings and disease management protocols. Increased focus on sports nutrition and disease-based supplementation within clinical and fitness settings contribute to their adoption, while improved patient adherence and measurable health outcomes drive continued investment.
Personalized Nutrition Market Regional Highlights:
North America Personalized Nutrition Market Insights:
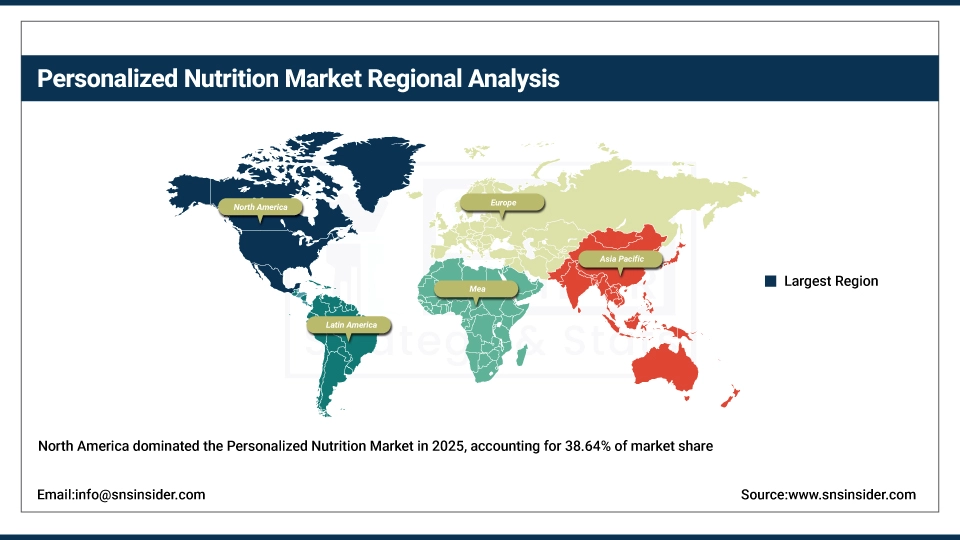
North America held the largest revenue share of over 38.64% in 2025 of the personalized nutrition market due to an established wellness industry, high consumer literacy around preventive health, and increased awareness regarding the advantages of DNA-based dietary programs, microbiome testing, and AI-powered nutrition coaching. Drivers include widespread use of fitness wearables, an improved direct-to-consumer digital commerce infrastructure, growing smartphone penetration, and greater acceptance of subscription-based nutrition services among health-conscious consumers. At the same time, various corporate wellness program investments, growing clinical interest in disease-based personalized nutrition, and enormous spending on nutrition technology from both consumers and healthcare organizations are anchoring personalized nutrition products and platforms in the market, and ensuring multibillion dollar revenues across the region.
Get Customized Report as per Your Business Requirement - Enquiry Now
Asia Pacific Personalized Nutrition Market Insights:
Asia Pacific is the fastest-growing segment in the personalized nutrition market with a CAGR of 17.43%, as the awareness about precision dietary solutions, government nutrition health initiatives, and wellness industry modernization in countries such as China, Japan, South Korea, and India is growing. Factors including rapid urbanization, rising middle-class population with expanding disposable incomes, and growing uptake of mobile health and fitness applications are stimulating the market growth. Digital nutrition platforms and direct-to-consumer supplement delivery services have been instrumental in improving access to personalized dietary guidance, especially in urban and semi-urban settings. Public-private partnerships and government programs also help in advancing preventive nutrition and digital wellness adoption. Increase in demand in the Asia Pacific region owing to rising health and wellness expenditure against historical spending levels and growing affordability and accessibility of cloud-based personalized nutrition platforms.
Europe Personalized Nutrition Market Insights:
The personalized nutrition market in Europe is the second-dominating region after North America on account of an increase in the adoption of nutraceuticals and functional food products, robust consumer data protection regulations including GDPR, and increasing interest in precision health and personalized wellness programs across national healthcare systems. Rising implementation of nutrigenomics research programs, advanced national dietary health strategies, favorable government funding for food science and nutrition innovation projects, and cross-border wellness industry directives are also contributing to the sustained growth of the market in leading European countries.
Latin America (LATAM) and Middle East & Africa (MEA) Personalized Nutrition Market Insights:
In Latin America, and Middle East & Africa, the growing health and wellness industry digitization efforts and increase in internet connectivity with mobile device penetration support the personalized nutrition market growth. The rising popularity of affordable direct-to-consumer supplement platforms and multilingual digital health capabilities, along with public awareness campaigns around diet-related chronic disease prevention, will aid dietary health accessibility and personalized nutrition adoption. The increasing urban population and improving retail and e-commerce infrastructure in these regions are continuing to encourage market growth.
Personalized Nutrition Market Competitive Landscape:
Nestlé S.A. (est. 1866) is a global nutrition, health, and wellness company that focuses on science-backed personalized nutrition solutions across dietary supplements, functional foods, and precision health platforms. It uses its extensive consumer research capabilities and global distribution network to deliver customized nutrition products aligned with individual health goals and clinical dietary needs.
-
In February 2025, it expanded its personalized nutrition portfolio with AI-powered dietary assessment tools and condition-specific supplement formulations under its Nestlé Health Science division, aiming to improve patient nutrition management and direct-to-consumer wellness program adoption across North America and Europe.
Amway Corporation (est. 1959) is a well-known global direct-selling nutrition and wellness company focused on dietary supplements, vitamins, and personalized health programs under its Nutrilite brand. It invests in nutrigenomic research and customized supplement development with the hopes of delivering science-backed, individually tailored nutritional solutions that support long-term preventive health and wellness goals.
-
In June 2024, launched an enhanced personalized nutrition platform featuring DNA-linked supplement recommendations and active biometric measurement tools under its Nutrilite Health Institute program, strengthening its direct-to-consumer personalized wellness capabilities across North American and Asia Pacific markets.
dsm-firmenich (est. 1902) is a leading global nutrition and health science company in the fields of dietary ingredient innovation, personalized supplement formulation, and precision nutrition platform development. The company's personalized nutrition product portfolio focuses on micronutrient bioavailability optimization, condition-specific formulation science, and strong regulatory compliance to complement a strong market presence in both consumer and clinical nutrition segments.
-
In September 2024, introduced advanced personalized micronutrient profiling and AI-assisted dietary gap analysis capabilities for its Sunshine Nutrition platform, strengthening its science-backed supplement recommendation offering and expanding adoption among wellness centers and direct-to-consumer nutrition brands globally.
Personalized Nutrition Market Key Players:
-
Nestlé S.A.
-
dsm-firmenich
-
Herbalife Nutrition Ltd.
-
Abbott Laboratories
-
Grædp
-
Care/of (Bayer AG)
-
Viome Life Sciences, Inc.
-
Nutrigenomix Inc.
-
Zipongo
-
Baze
-
Noom Inc.
-
InsideTracker
-
GNC Holdings LLC
-
Metagenics, Inc.
-
Smartfoods
-
Bioanalyt GmbH
-
Rootine Inc.
| Report Attributes | Details |
|---|---|
| Market Size in 2025 | USD 15.80 billion |
| Market Size by 2035 | USD 60.92 billion |
| CAGR | CAGR of 15.04% From 2026 to 2035 |
| Base Year | 2025 |
| Forecast Period | 2026-2035 |
| Historical Data | 2022-2024 |
| Report Scope & Coverage | Market Size, Segments Analysis, Competitive Landscape, Regional Analysis, DROC & SWOT Analysis, Forecast Outlook |
| Key Segments | •By Product (Dietary Supplements & Nutraceuticals, Functional Foods & Beverages, Sports Nutrigenomics & Digitized DNA) •By Measurement Method (Active Measurement & Standard Measurement) •By Form (Tablets, Capsules, Powder, Liquid & Others) •By Application (Standard Supplement, Diseased-Based & Sports Nutrition) •By End User (Direct-To Consumer, Wellness & Fitness Centers & Hospitals & Clinics) |
| Regional Analysis/Coverage | North America (US, Canada, Mexico), Europe (Eastern Europe [Poland, Romania, Hungary, Turkey, Rest of Eastern Europe] Western Europe] Germany, France, UK, Italy, Spain, Netherlands, Switzerland, Austria, Rest of Western Europe]), Asia Pacific (China, India, Japan, South Korea, Vietnam, Singapore, Australia, Rest of Asia Pacific), Middle East & Africa (Middle East [UAE, Egypt, Saudi Arabia, Qatar, Rest of Middle East], Africa [Nigeria, South Africa, Rest of Africa], Latin America (Brazil, Argentina, Colombia, Rest of Latin America) |
| Company Profiles | Nestlé S.A., Amway Corporation, dsm-firmenich, Herbalife Nutrition Ltd., Abbott Laboratories, Grædp , Care/of (Bayer AG), Persona Nutrition, Viome Life Sciences, Inc., Nutrigenomix Inc., Genomic Expression, Zipongo, Baze, Noom Inc., InsideTracker, GNC Holdings LLC, Metagenics, Inc., Smartfoods, Bioanalyt GmbH, Rootine Inc. |
Frequently Asked Questions
Ans: Rising Consumer Demand for Preventive Healthcare and Precision Wellness is Driving the Personalized Nutrition Market Growth.
Ans: The Personalized Nutrition Market is expected to grow at a CAGR of 15.04% over the forecast period.
Ans: The Personalized Nutrition Market size was USD 15.80 billion in 2025 and is expected to reach USD 60.92 billion by 2035.
Ans: By product, the Dietary Supplements & Nutraceuticals segment dominated the Personalized Nutrition Market in 2025.
Ans: North America dominated the Personalized Nutrition Market in 2025.
Get in Touch
