Pipeline Safety Market Report Scope & Overview:
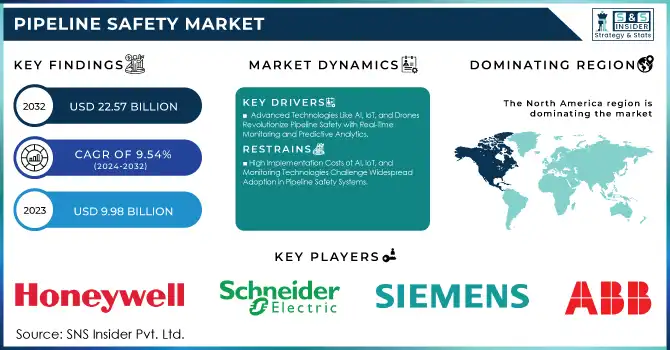
The Pipeline Safety Market was valued at USD 9.98 billion in 2023 and is expected to reach USD 22.57 billion by 2032, growing at a CAGR of 9.54% from 2024-2032.
Get more information on Pipeline Safety Market - Request Free Sample Report
The Pipeline Safety Market is growing rapidly because of the global demand for energy and the rapid development of pipeline networks. With increased scale and complexity in pipeline systems, the leakage, spill, and accident risks are becoming a pressing issue. In 2023, the U.S. alone experienced 8,140 pipeline incidents over 13 years, resulting in 164 deaths, 737 injuries, 1,135 fires, 392 explosions, 46,463 evacuations, and USD 7.57 billion in property damage. These alarming statistics have prompted governments and private operators to implement stringent safety measures. The emphasis on safety is further enhanced through the integration of advanced technologies, such as IoT, AI, and big data analytics, to monitor and perform predictive maintenance in real time to ensure the secure and efficient transport of energy resources.
The need for pipeline safety measures is increasingly growing as sectors tackle regulatory adherence and operational threats in essential infrastructure. As a reaction, operators are utilizing sophisticated tools such as SCADA systems, intelligent leak detection equipment, and automated shutdown systems, all aimed at improving safety and minimizing downtime. In March 2024, Sonatrach and Huawei presented a smart pipeline inspection solution at MWC Barcelona, highlighting the industry's transition to advanced technologies. Furthermore, the worldwide shift towards renewable energy, such as hydrogen and biofuel pipeline, presents distinct safety needs, generating chances for customized solutions for these emerging energy forms. These developments are crucial as sectors adjust to changing safety regulations and address the issues presented by both established and new energy systems.
The growth prospects in the pipeline safety market are influenced by the integration of advanced technologies that offer more intelligent and robust infrastructure. Examples of innovations that are transforming pipeline safety include predictive maintenance driven by machine learning and secure data tracking utilizing blockchain. With the rising global demand for new energy infrastructure, the requirement for flexible and scalable safety solutions will create new opportunities for market growth in the years ahead. These innovations, centered around safety and efficiency, are projected to propel the market ahead, as operators pursue state-of-the-art technologies to satisfy increasing operational and regulatory requirements.
Pipeline Safety Market Dynamics
Drivers
-
Advanced Technologies Like AI, IoT, and Drones Revolutionize Pipeline Safety with Real-Time Monitoring and Predictive Analytics
The incorporation of advanced technologies revolutionizes pipeline safety, providing improved monitoring and operational effectiveness. Cutting-edge sensors and IoT-integrated systems offer real-time information, facilitating the rapid identification of irregularities like leaks or fluctuations in pressure. Predictive analytics powered by AI allows businesses to foresee possible failures and tackle them in advance, reducing risks and downtime. Furthermore, drones fitted with thermal imaging and high-resolution cameras enable remote inspection of pipelines in difficult landscapes. These advancements enhance safety while also lowering maintenance expenses and environmental hazards. As technological advancements progress, the integration of these solutions is increasingly essential for businesses seeking to meet strict safety standards and improve their overall pipeline infrastructure management.
-
Growing Cybersecurity Threats Drive Urgent Need to Protect Digitized Pipeline Infrastructure with Advanced Security Measures and Regulations
As pipeline operations undergo swift digitization, the threat of cyberattacks targeting essential infrastructure has notably increased. Cybercriminals are focusing on pipeline systems to interfere with operations, acquire confidential information, or extort ransoms, resulting in increased worries regarding cybersecurity. The incorporation of digital technologies, like SCADA systems and IoT devices, has enhanced efficiency but also introduced weaknesses that malicious individuals can take advantage of. To reduce these risks, businesses are implementing sophisticated cybersecurity strategies, such as encryption, two-factor authentication, and AI-driven threat identification systems. Furthermore, authorities and regulatory agencies are implementing tougher regulations to guarantee the robustness of pipeline systems against cyber risks. With the increasing frequency and complexity of cyberattacks, emphasizing cybersecurity is essential for maintaining the safety, reliability, and continuous operation of pipeline systems worldwide.
Restraints
-
High Implementation Costs of AI, IoT, and Monitoring Technologies Challenge Widespread Adoption in Pipeline Safety Systems
Implementing cutting-edge safety technologies like AI, IoT systems, and real-time monitoring tools can be extremely costly for numerous companies in the pipeline sector. The upfront capital needed to buy, set up, and incorporate these systems into current infrastructure can put pressure on budgets, especially for small and medium-sized businesses. Additionally, the requirement for continuous maintenance, software upgrades, and trained staff to run and oversee these systems increases the total financial load. Consequently, certain organizations might hesitate to fully adopt these solutions, despite the long-term safety and operational advantages they provide. The significant expense of adoption could impede the broad deployment of cutting-edge safety technologies, possibly obstructing attempts to enhance pipeline safety standards and meet changing regulatory obligations.
-
Complex Integration of New Technologies with Legacy Pipeline Systems Creates Challenges in Adopting Advanced Safety Solutions
Integrating advanced safety technologies with existing pipeline infrastructure presents significant technical challenges, often resulting in extended implementation timelines. The legacy systems currently in use may not be compatible with the latest AI, IoT, and monitoring tools, requiring costly and complex adjustments to bridge the gaps. This process demands skilled technicians, specialized knowledge, and careful planning to avoid operational disruptions. Additionally, these integration efforts can cause downtime, reducing pipeline efficiency and potentially affecting productivity. As companies look to modernize their safety measures, the challenge of aligning new technology with outdated systems can delay the transition, creating a reluctance to invest in the necessary upgrades. This technical complexity adds a layer of difficulty in adopting and optimizing pipeline safety solutions, particularly for operators with limited resources or those managing large, geographically dispersed networks.
Pipeline Safety Market Segment Analysis
By Service
In 2023, the Repair and Maintenance segment dominated the Pipeline Safety Market with the highest revenue share of approximately 33%. This dominance can be attributed to the continuous need for maintaining the integrity of aging pipelines and mitigating the risks associated with operational wear and tear. As pipelines often face physical stress, corrosion, and potential leaks, regular repairs and maintenance are critical to ensuring safe and uninterrupted service. Additionally, the high costs associated with pipeline failures or environmental damage have further driven investments in repair and maintenance services to avoid catastrophic events.
The Pipeline Integrity Management segment is projected to experience the fastest growth at a CAGR of 12.02% from 2024 to 2032. This surge in demand is primarily driven by the increasing adoption of advanced monitoring and diagnostic technologies aimed at assessing pipeline conditions proactively. As operators seek to prevent costly downtime and enhance operational efficiency, the need for comprehensive integrity management programs, including real-time data collection and predictive analytics, has become essential. Furthermore, the rising regulatory pressures to ensure pipeline safety and compliance are accelerating the adoption of PIM solutions, making it a key growth area in the pipeline safety market.
By Solution
In 2023, the Natural Gas segment held the largest revenue share of approximately 45% in the Pipeline Safety Market. This dominance can be attributed to the growing demand for natural gas as a cleaner alternative to coal and oil, driving significant investments in pipeline infrastructure for transportation. As natural gas consumption rises globally, ensuring the safety of extensive pipeline networks becomes a top priority to prevent accidents, leaks, and environmental risks. The segment's growth is further supported by the critical need to upgrade aging pipelines and enhance monitoring technologies, ensuring the reliable and secure delivery of natural gas.
The Refined Products segment is expected to experience the fastest growth, with a projected CAGR of 12.48% from 2024 to 2032. This growth is driven by the increasing demand for refined products, such as gasoline, diesel, and jet fuel, as global transportation and industrial activities expand. As refined product pipelines are often more complex and subject to stringent safety regulations, the need for advanced safety solutions to prevent leaks, contamination, and catastrophic failures is intensifying. Additionally, the expansion of the global supply chain for refined products, along with rising safety concerns, is propelling investments in more advanced safety technologies, fueling the rapid growth of this segment.
By Vertical
In 2023, the Pipeline Monitoring System segment captured the largest revenue share of approximately 29% in the Pipeline Safety Market. This dominance is largely due to the increasing need for real-time monitoring of pipeline conditions to prevent accidents and ensure operational efficiency. As pipelines are vital for transporting oil, gas, and other essential resources, companies are investing heavily in advanced monitoring systems to detect leaks, pressure changes, and potential threats early. These systems significantly reduce the risk of catastrophic failures, enhance safety protocols, and help meet regulatory compliance, driving their widespread adoption.
The SCADA for Pipeline segment is expected to grow at the fastest CAGR of 12.21% from 2024 to 2032. The growth is fueled by the increasing digitization of pipeline operations and the need for more integrated control systems that can remotely manage and monitor pipeline functions. SCADA systems allow operators to efficiently track and control pipeline conditions across vast networks, improving decision-making and reducing downtime. With the rise of automation and the need for enhanced cybersecurity, SCADA technology is becoming indispensable for maintaining safe and efficient pipeline operations, positioning it for rapid growth in the coming years.
Regional Analysis
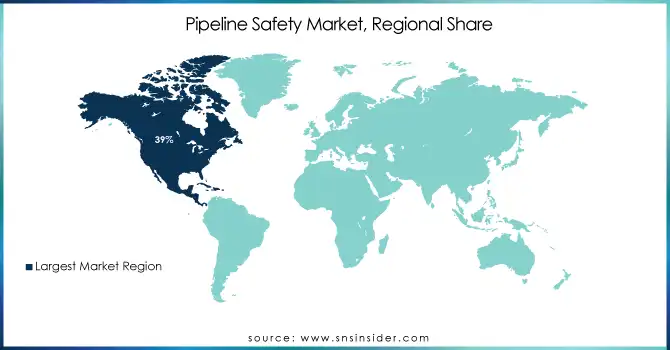
In 2023, North America dominated the Pipeline Safety Market with the highest revenue share of approximately 39%. This dominance is driven by the region's well-established pipeline infrastructure, particularly in the oil and gas sector, which necessitates robust safety measures. Additionally, stringent safety regulations and a strong focus on environmental protection have compelled companies to invest heavily in advanced pipeline safety technologies. The region’s significant oil and gas production, combined with its increasing focus on infrastructure upgrades and modernization, has further solidified its leadership in the market.
The Asia Pacific region is expected to grow at the fastest CAGR of 12.24% from 2024 to 2032. This growth can be attributed to the rapid industrialization, urbanization, and rising energy demand across the region, particularly in countries like China, India, and Japan. As the need for efficient and secure pipeline infrastructure intensifies, governments and companies are prioritizing investments in safety technologies to mitigate risks associated with the expanding pipeline networks. Furthermore, the region’s efforts to strengthen regulatory frameworks and improve energy security are fueling the accelerated adoption of pipeline safety solutions.
Need any customization research on Pipeline Safety Market - Enquiry Now
Key Players
-
ABB (ABB Ability Pipeline Integrity Management, Smart Pigging Systems)
-
Siemens AG (Pipeline Monitoring Systems, SCADA Systems)
-
Schneider Electric (EcoStruxure™ Pipeline SCADA, Smart Gas Management Solutions)
-
Baker Hughes (Pipeline Inspection Services, Leak Detection Systems)
-
Honeywell (Pipeline Leak Detection Solutions, Industrial Cybersecurity)
-
Huawei Technologies (Smart Pipeline Monitoring, IoT-based Asset Management Solutions)
-
AVEVA (AVEVA Pipeline Management, Smart Asset Monitoring)
-
PSI AG (Pipeline Leak Detection, Gas Pipeline Management Systems)
-
BAE Systems (Pipeline Integrity Management, Surveillance Systems)
-
TransCanada (Pipeline Control Systems, Integrity Management)
-
Atmos International (Leak Detection System, Flow Monitoring System)
-
Clampon AS (Pipeline Leak Detection, Clamp-on Ultrasonic Flow Meters)
-
FFT (Fiber Optic Pipeline Monitoring, Security Solutions)
-
Perma-Pipe (Pipe-in-Pipe Systems, Corrosion Protection Solutions)
-
Senstar (Pipeline Security Systems, Fence Intrusion Detection)
-
Syrinix (Smart Pipeline Monitoring, Pressure and Flow Measurement)
-
RADIOBARRIER (Intrusion Detection Systems, Environmental Monitoring)
-
Pure Technologies (SmartBall Leak Detection, Pipeline Inspection)
-
C-Fer Technologies (Smart Pigging, Pipeline Inspection Services)
-
Total Safety (Pipeline Safety and Compliance Solutions, Safety Instrumented Systems)
-
Krohne Group (Flow Meters for Pipeline Monitoring, Process Automation Solutions)
-
PLM CAT (Pipeline Leak Detection, SCADA Systems)
-
Leater (Gas Detection Systems, Security Systems for Pipelines)
-
TTK (Pipeline Inspection Services, Remote Monitoring Systems)
-
General Electric (Pipeline Inspection, Asset Performance Management)
-
Thales Group (Pipeline Monitoring, Cybersecurity Solutions)
Recent Developments:
-
In 2024, ABB India automated the Indo-Bangla Friendship Pipeline (IBFPL), the first cross-border oil pipeline between India and Bangladesh. ABB's integrated automation system ensures safe, efficient operation of the 130-km pipeline, enhancing diesel transport from India to Bangladesh to meet the country's growing energy needs.
-
In January 2024, Schneider Electric promoted the use of smart technologies to enhance pipeline security in Nigeria. The company showcased AI, real-time monitoring, and cybersecurity solutions at the Nigeria International Pipeline Technology and Security Conference to improve infrastructure protection and energy security
| Report Attributes | Details |
|---|---|
| Market Size in 2023 | USD 9.98 Billion |
| Market Size by 2032 | USD 22.57 Billion |
| CAGR | CAGR of 9.54% From 2024 to 2032 |
| Base Year | 2023 |
| Forecast Period | 2024-2032 |
| Historical Data | 2020-2022 |
| Report Scope & Coverage | Market Size, Segments Analysis, Competitive Landscape, Regional Analysis, DROC & SWOT Analysis, Forecast Outlook |
| Key Segments | • By Service (Repair and Maintenance, Professional Services, Risk Management, Pipeline Integrity Management, Consulting Services) • By Solution (Perimeter Intrusion Detection, Secure Communication, SCADA for Pipeline, Pipeline Monitoring System, Pipeline Integrity Management, Industrial Control Systems Security) • By Vertical (Natural Gas, Crude Oil, Refined Products, Others) |
| Regional Analysis/Coverage | North America (US, Canada, Mexico), Europe (Eastern Europe [Poland, Romania, Hungary, Turkey, Rest of Eastern Europe] Western Europe] Germany, France, UK, Italy, Spain, Netherlands, Switzerland, Austria, Rest of Western Europe]), Asia Pacific (China, India, Japan, South Korea, Vietnam, Singapore, Australia, Rest of Asia Pacific), Middle East & Africa (Middle East [UAE, Egypt, Saudi Arabia, Qatar, Rest of Middle East], Africa [Nigeria, South Africa, Rest of Africa], Latin America (Brazil, Argentina, Colombia, Rest of Latin America) |
| Company Profiles | ABB, Siemens AG, Schneider Electric, Baker Hughes, Honeywell, Huawei Technologies, AVEVA, PSI AG, BAE Systems, TransCanada, Atmos International, Clampon AS, FFT, Perma-Pipe, Senstar, Syrinix, RADIOBARRIER, Pure Technologies, C-Fer Technologies, Total Safety, Krohne Group, PLM CAT, Leater, TTK, General Electric, Thales Group |
| Key Drivers | • Advanced Technologies Like AI, IoT, and Drones Revolutionize Pipeline Safety with Real-Time Monitoring and Predictive Analytics • Growing Cybersecurity Threats Drive Urgent Need to Protect Digitized Pipeline Infrastructure with Advanced Security Measures and Regulations |
| RESTRAINTS | • High Implementation Costs of AI, IoT, and Monitoring Technologies Challenge Widespread Adoption in Pipeline Safety Systems • Complex Integration of New Technologies with Legacy Pipeline Systems Creates Challenges in Adopting Advanced Safety Solutions |
Get in Touch
