image

Powered Agriculture Equipment Market Report Scope & Overview:

The Powered agriculture equipment Market Size was valued at USD 90.03 Bn in 2023 and is expected to reach at USD 141.3 Bn by 2031, with a growing CAGR of 5.79% over the forecast period 2024-2031.

Powered agriculture equipment alludes to agriculture machinery utilized in cultivating and farming. A few sorts of power tools are, hand tools and power tools, tractor, go under the class of powered agriculture equipment. Different scopes of hardware or apparatus are utilized in both natural and nonorganic cultivating. Expanding motorization in the agribusiness area combined with the increase in farm income is supposed to be an essential component driving the development. Ideal climatic circumstances for food creation and government support with credit waiver plans for ranchers of all pay classes are additionally ventured to lean toward the market development. Mechanically progressed agrarian mechanical technology, for example, independent work vehicles and flying robots to assist farmers with delivering food at low expenses to satisfy the developing interest for food, are expected to be better possibilities for market development over the estimate time frame.

Powered agriculture equipment Market Revenue Analysis

To get more information on Powered Agriculture Equipment Market - Request Free Sample Report

MARKET DYNAMICS:

KEY DRIVERS:

  • The execution of farm loan waiver schemes urges farmers to purchase farm machinery

  • The government sent off different plans in various regions of the world to alleviate farmers from their advances and empower farm mechanization.

  • A growing population is one of the main considerations driving the development of food creation all over the planet, which builds the use of powered agriculture equipment.

RESTRAINTS:

  • The acquisition of farm equipment, for example, tractor and harvesters is a significant interest in agricultural exercises.

  • The failure of little ranchers to put a high sum brings about the low entrance of farm equipment in arising nations.

  • Farmers choose leasing farm machinery to expand efficiency and time required to circle back, which, thusly, builds the productivity and benefit of the business.

CHALLENGES:

  • Different organizations express their worries about emission guidelines in various areas of the planet.

  • The execution of emission standards might restrict the deals of development and agricultural machinery

  • The absence of Technical Knowledge and Awareness is one of the major challenges faced by the industry.

OPPORTUNITY:

  • Rising opportunities in developing countries due to increasing population and as well as increasing awareness about modern farming methods

  • Reception of drones and robots in agriculture is helpful for farmers to overcome the labour shortage problems.

IMPACT OF COVID-19:

Before the pandemic circumstance, the powered agriculture equipment market was in better condition. However, after the COVID-19 pandemic happened, the powered agricultural equipment industry deals with various issues because of upset worldwide stockpile chains. To the public authority guidelines, the made ventures are shut down to forestall the spread of the Covid-19, and henceforth the agricultural equipment market has dialed back.

This pandemic impacted the powered agricultural equipment as well as impacted different business areas like autos, medical services, semiconductor and hardware, development, and some more. In 2020, tractors represented more than half of the piece of the pie in the worldwide market. Gradually, the pandemic circumstance changed, and the businesses returned.

MARKET ESTIMATION:

Based on type:

Based on type, the market is fragmented into tractors, combine harvesters, seed drills, soil preparation & cultivation equipment, sprayer and dusters, and others. The tractors section represented the biggest income share in the fueled agriculture equipment market in 2021. The multi-function capacity of tractors is bringing about expanding deals and arrangements of tractors in the agribusiness area. Incentives and subsidies given by state-run administrations to energize farm automation have been driving rising reception of tractors in the rural area, and the pattern is supposed to go on during the conjecture time frame. Rising need to upgrade functional proficiency, further develop soil quality, and increment productivity has been driving interest for tractors to work with expanding crop development and creation. Unstable fuel costs have likewise brought about different mechanical progressions in tractors and interest for auto-directed tractors has been expanding in the agriculture area to decrease fuel utilization.

Based on High-tech agricultural equipment:

Based on High-tech agricultural equipment, the powered agriculture equipment market is sectioned as reaping and picking robots, Autonomous tractors, agricultural drones, electric tracts, and others. The rural automated flying vehicles or farming robots section income development rate is projected to lean quickly during the conjecture time frame. Rising spotlight on accuracy agribusiness and animals checking and the executives is a key component expected to keep on driving interest for farming robots in the agricultural area during the conjecture time frame. The rising requirement for constant yield and domesticated animals information for upgrading farming efficiency is supporting the organization of agricultural robots.

KEY MARKET SEGMENTATION

 ON THE BASIS OF TYPE

  • Tractors

  • Seed Drill

  • Soil Preparation & Cultivation Equipment,

  • CUSTOMIZATION

  • Sprayer

  • Others

ON THE BASIS OF HIGH-TECH AGRICULTURAL EQUIPMENT

  • Harvesting & Picking Robots

  • Agricultural Drones

  • Autonomous Tractors

  • Electric Tractors

  •  Others

Need any customization research on Powered Agriculture Equipment Market - Enquiry Now

REGIONAL ANALYSIS:

North America represented the biggest portion of the worldwide powered agriculture equipment market because of the presence of enormous makers of corn, wheat, and soy, which is driving the interest for AGRICULTURAL MACHINERY in the district. Canada and the U.S. are significant supporters of the development of the powered agriculture equipment market in North America.

The powered agriculture equipment market in Asia Pacific is projected to grow quickly during the gauge time frame because of expanding food efficiency in the district. Asia is the most populated area worldwide, which faces issues of food lack that prompt expansion in food creation. China and India are significantly agribusiness-based nations; appropriations gave by focal and state legislatures urge ranchers to put resources into farming hardware. This is supposed to extend the powered agriculture equipment market in the Asia Pacific area.

REGIONAL COVERAGE:

  • North America

    • USA

    • Canada

    • Mexico

  • Europe

    • Germany

    • UK

    • France

    • Italy

    • Spain

    • The Netherlands

    • Rest of Europe

  • Asia-Pacific

    • Japan

    • south Korea

    • China

    • India

    • Australia

    • Rest of Asia-Pacific

  • The Middle East & Africa

    • Israel

    • UAE

    • South Africa

    • Rest of Middle East & Africa

  • Latin America

    • Brazil

    • Argentina

    • Rest of Latin America

KEY PLAYERS:

The Major Players are AGCO Corporation, John Deere and Co., Mahindra and Mahindra Limited, CNH Industrial N.V., Kubota Corporation, CLAAS, Alamo Group Inc., Accompanies Group, Iseki and Co., Ltd., SDF S.P.A and Other Players

AGCO Corporation-Company Financial Analysis

Powered Agriculture Equipment Market Report Scope:

Report Attributes Details
Market Size in 2023 US$ 90.03  Billion
Market Size by 2031 US$ 141.3 Billion
CAGR CAGR of 5.79% From 2024 to 2031
Base Year 2022
Forecast Period 2024-2031
Historical Data 2020-2021
Report Scope & Coverage Market Size, Segments Analysis, Competitive  Landscape, Regional Analysis, DROC & SWOT Analysis, Forecast Outlook
Key Segments • by Type (Tractors, Seed Drill, Soil Preparation & Cultivation Equipment, customization, Sprayer, Others)
• by High-tech agricultural equipment (Harvesting & Picking Robots, Agricultural Drones, Autonomous Tractors, Electric Tractors, Others)
Regional Analysis/Coverage North America (USA, Canada, Mexico), Europe
(Germany, UK, France, Italy, Spain, Netherlands,
Rest of Europe), Asia-Pacific (Japan, South Korea,
China, India, Australia, Rest of Asia-Pacific), The
Middle East & Africa (Israel, UAE, South Africa,
Rest of Middle East & Africa), Latin America (Brazil, Argentina, Rest of Latin America)
Company Profiles AGCO Corporation, John Deere and Co., Mahindra and Mahindra Limited, CNH Industrial N.V., Kubota Corporation, CLAAS, Alamo Group Inc., Accompanies Group, Iseki and Co., Ltd., SDF S.P.A.

 
Key Drivers •The execution of farm loan waiver schemes urges farmers to purchase farm machinery
RESTRAINTS •The failure of little ranchers to put a high sum brings about the low entrance of farm equipment in arising nations.

Frequently Asked Questions

Ans: The Powered agriculture equipment Market is growing at a CAGR of 5.79 % From 2024 to 2031.

Ans: The Powered agriculture equipment Market Size was valued at USD 90.03 Bn in 2023.

  • The execution of farm loan waiver schemes urges farmers to purchase farm machinery
  • The government sent off different plans in various regions of the world to alleviate farmers from their advances and empower farm mechanization.
  • Different organizations express their worries about emission guidelines in various areas of the planet.
  • The execution of emission standards might restrict the deals of development and agricultural machinery

North America region is dominating the Powered agriculture equipment Market.

Table of Contents


1. Introduction

1.1 Market Definition 

1.2 Scope

1.3 Research Assumptions

2. Research Methodology

3. Market Dynamics

3.1 Drivers

3.2 Restraints

3.3 Opportunities

3.4 Challenges

4. Impact Analysis

4.1 COVID-19 Impact Analysis

4.2 Impact of Ukraine- Russia War

4.3 Impact of Ongoing Recession

4.3.1 Introduction

4.3.2 Impact on major economies

4.3.2.1 US

4.3.2.2 Canada

4.3.2.3 Germany

4.3.2.4 France

4.3.2.5 United Kingdom

4.3.2.6 China

4.3.2.7 Japan

4.3.2.8 South Korea

4.3.2.9 Rest of the World

5. Value Chain Analysis 

6. Porter’s 5 forces model

7. PEST Analysis

8. Powered Agriculture Equipment Market Segmentation, By Type

8.1 Tractors

8.2 Seed Drill

8.3 Soil Preparation & Cultivation Equipment

8.4 CUSTOMIZATION

8.5 Sprayer

8.6 Others

9. Powered Agriculture Equipment Market Segmentation, By High-tech Agricultural Equipment

9.1 Harvesting & Picking Robots

9.2 Agricultural Drones

9.3 Autonomous Tractors

9.4 Electric Tractors

9.5 Others

10. Regional Analysis

10.1 Introduction

10.2 North America

10.2.1 USA

10.2.2Canada

10.2.3Mexico

10.3Europe

10.3.1Germany

10.3.2UK

10.3.3France

10.3.4Italy

10.3.5Spain

10.3.6The Netherlands

10.3.7Rest of Europe

10.4Asia-Pacific

10.4.1Japan

10.4.2South Korea

10.4.3China

10.4.4India

10.4.5Australia

10.4.6Rest of Asia-Pacific

10.5The Middle East & Africa

10.5.1Israel

10.5.2UAE

10.5.3South Africa

10.5.4Rest

10.6Latin America

10.6.1Brazil

10.6.2Argentina

10.6.3Rest of Latin America

11. Company Profiles

11.1 Apex Tool Group

11.1.1 Financial

11.1.2 Products/ Services Offered

11.1.3 SWOT Analysis

11.1.4 The SNS view

11.2 Atlas Copco AB

11.3 Hilti Corporation

11.4 Ingersoll-Rand PLC

11.5 Hitachi Ltd.

11.6 Makita Corporation

11. 7 Robert Bosch GmbH

11.8 Snap-On Incorporated

11.9 Stanley

11.1BlackandDecker

11.1TechtronicIndustries

11.12 Koki Holdings

11.13 Emerson

11.14 Panasonic

11.15 Fortie

11.16 CHEVRON

11.17 Positec

12. Competitive Landscape

12.1 Competitive Benchmarking

12.2 Market Share Analysis

12.3 Recent Developments

13. Conclusion

An accurate research report requires proper strategizing as well as implementation. There are multiple factors involved in the completion of good and accurate research report and selecting the best methodology to compete the research is the toughest part. Since the research reports we provide play a crucial role in any company’s decision-making process, therefore we at SNS Insider always believe that we should choose the best method which gives us results closer to reality. This allows us to reach at a stage wherein we can provide our clients best and accurate investment to output ratio.

Each report that we prepare takes a timeframe of 350-400 business hours for production. Starting from the selection of titles through a couple of in-depth brain storming session to the final QC process before uploading our titles on our website we dedicate around 350 working hours. The titles are selected based on their current market cap and the foreseen CAGR and growth.


The 5 steps process:

Step 1: Secondary Research:

Secondary Research or Desk Research is as the name suggests is a research process wherein, we collect data through the readily available information. In this process we use various paid and unpaid databases which our team has access to and gather data through the same. This includes examining of listed companies’ annual reports, Journals, SEC filling etc. Apart from this our team has access to various associations across the globe across different industries. Lastly, we have exchange relationships with various university as well as individual libraries.
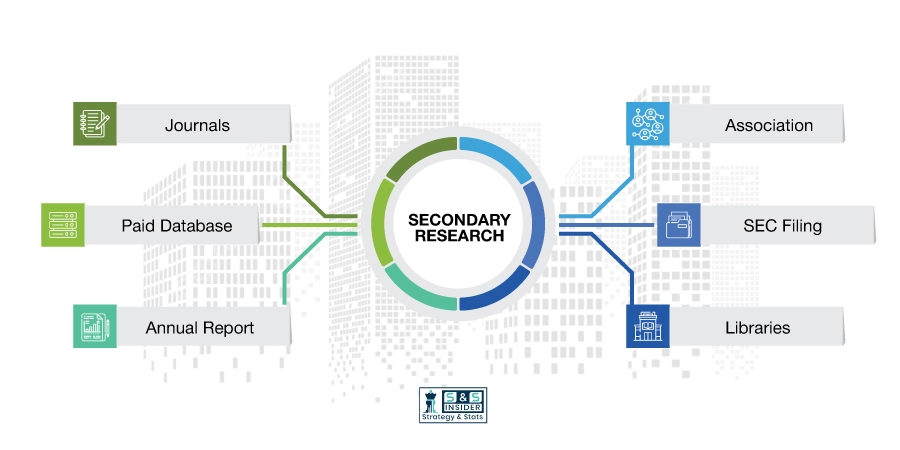
Secondary Research

Step 2: Primary Research

When we talk about primary research, it is a type of study in which the researchers collect relevant data samples directly, rather than relying on previously collected data.  This type of research is focused on gaining content specific facts that can be sued to solve specific problems. Since the collected data is fresh and first hand therefore it makes the study more accurate and genuine.

We at SNS Insider have divided Primary Research into 2 parts.

Part 1 wherein we interview the KOLs of major players as well as the upcoming ones across various geographic regions. This allows us to have their view over the market scenario and acts as an important tool to come closer to the accurate market numbers. As many as 45 paid and unpaid primary interviews are taken from both the demand and supply side of the industry to make sure we land at an accurate judgement and analysis of the market.

This step involves the triangulation of data wherein our team analyses the interview transcripts, online survey responses and observation of on filed participants. The below mentioned chart should give a better understanding of the part 1 of the primary interview.
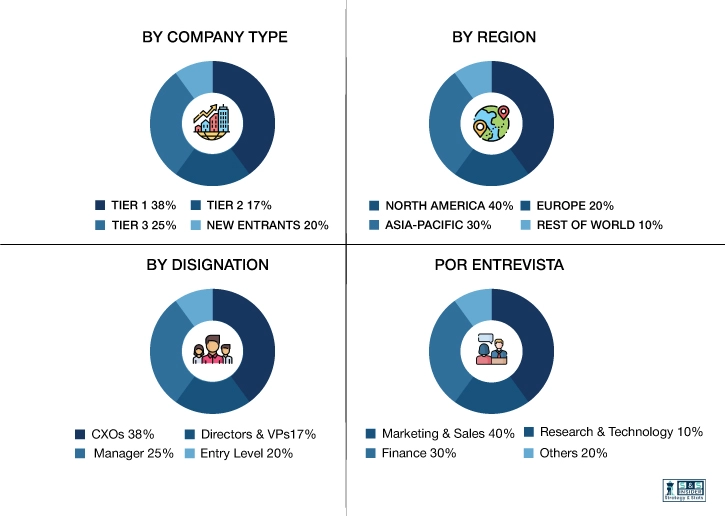
Primary Research

Part 2: In this part of primary research the data collected via secondary research and the part 1 of the primary research is validated with the interviews from individual consultants and subject matter experts.

Consultants are those set of people who have at least 12 years of experience and expertise within the industry whereas Subject Matter Experts are those with at least 15 years of experience behind their back within the same space. The data with the help of two main processes i.e., FGDs (Focused Group Discussions) and IDs (Individual Discussions). This gives us a 3rd party nonbiased primary view of the market scenario making it a more dependable one while collation of the data pointers.

Step 3: Data Bank Validation

Once all the information is collected via primary and secondary sources, we run that information for data validation. At our intelligence centre our research heads track a lot of information related to the market which includes the quarterly reports, the daily stock prices, and other relevant information. Our data bank server gets updated every fortnight and that is how the information which we collected using our primary and secondary information is revalidated in real time.

Data Bank Validation

Step 4: QA/QC Process

After all the data collection and validation our team does a final level of quality check and quality assurance to get rid of any unwanted or undesired mistakes. This might include but not limited to getting rid of the any typos, duplication of numbers or missing of any important information. The people involved in this process include technical content writers, research heads and graphics people. Once this process is completed the title gets uploader on our platform for our clients to read it.

Step 5: Final QC/QA Process:

This is the last process and comes when the client has ordered the study. In this process a final QA/QC is done before the study is emailed to the client. Since we believe in giving our clients a good experience of our research studies, therefore, to make sure that we do not lack at our end in any way humanly possible we do a final round of quality check and then dispatch the study to the client.

Start a Conversation

Hi! Click one of our member below to chat on Phone