image

Powered Agriculture Equipment Market Report Scope & Overview

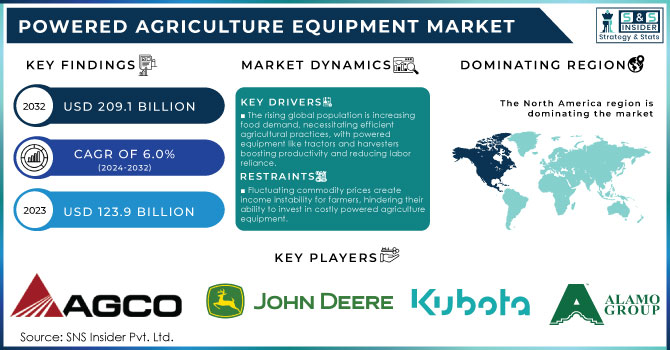
The Powered Agriculture Equipment Market Size was USD 123.9 billion in 2023 and will reach USD 209.4 billion by 2032 and grow at a CAGR of 6.0 % by 2024-2032

The expansion of the motorization of the agricultural sector, together with the growth of agricultural income, is an important factor promoting development.A study by the International Food Policy Research Institute showed that a 10 percent increase in agricultural productivity could lead to a upto 10 percent increase in rural household income.. Ideal climatic conditions to create food and state support with credit incentive schemes for cattle breeders of all salary levels also dared to rely on market developments. For eg, advanced agro-mechanical technology such as autonomous work vehicles and flying robots, which help farmers deliver food at a low cost to meet the growing interest in food, has a better chance of developing the market during the expected time frame.

Powered-Agriculture-Equipment-Market Revenue Analysis

To get more information on Powered Agriculture Equipment Market - Request Free Sample Report

The Food and Agriculture Organization (FAO) estimates that agricultural machinery can reduce labor requirements by up to 70%, freeing up labor for other sectors and boosting overall economic activity, Also farm loan waivers can create opportunities for farm machinery purchases, but it's crucial to consider both the potential benefits and drawbacks. Ideally, these schemes should be coupled with financial literacy programs and agricultural extension services to encourage responsible investment decisions that promote long-term farm productivity and sustainability.

MARKET DYNAMICS:

KEY DRIVERS:

  • The implementation of farm loan waiver programs can act as a catalyst for the accelerated adoption of farm machinery by debt-relieved farmers.

  • Adoption of precision farming technologies such as GPS guidance, sensor-based tracking is contributing to the growth of the market..

After a loan waiver, farmers might have a cleaner credit history or be debt-free. This can make them more attractive borrowers for banks and financial institutions, allowing them to secure loans for purchasing farm machinery. for eg. a farmer, had a defaulted loan for a tractor. After a state waiver program cleared his dues, he was able to get a new loan for a smaller, more fuel-efficient tractor from a bank. With the burden of past debt lifted, farmers might feel more confident investing in their farms. Machinery purchases can increase productivity and income, potentially leading to a better financial future.

RESTRAINTS:

  • Lack of Infrastructure can be a barrier for market growth.

  • High Initial Investment this can be a significant barrier for small and medium-scale farmers.

Effective utilization of powered equipment often requires good rural infrastructure, including proper roads and access to reliable electricity for recharging or powering equipment. Limited infrastructure in some regions can hinder adoption.

OPPORTUNITIES:

  • Opportunities are increasing in developing countries with population growth and awareness of modern farming methods.

  • Emerging economies create an opportunity for market growth.

Developing countries with growing economies are expected to see a significant rise in demand for powered equipment as they strive to modernize their agricultural practices. Such as Eco-friendly tech, which is driving the development of lower-emission and biofuel-powered agricultural equipment, aligning with the growing demand for sustainable farming practices.

CHALLENGES:

  • Motorized agricultural machinery incurs double expenses in terms of maintenance and repair costs.

Advanced machinery often requires specialized parts that can be expensive to source and replace. Local repair shops might not have these parts readily available, leading to delays and additional costs for ordering them. also Unexpected repairs or breakdowns can significantly strain a farmer's cash flow, especially during periods of low income. This can force them to delay crucial maintenance on other equipment or even impact their ability to purchase essential supplies. High maintenance costs can eat into a farmer's profit margins. If the cost of repairs outweighs the gains in efficiency from using powered equipment, it can negate the initial investment benefits.

IMPACT OF RUSSIA-UKRAINE WAR

The Russia Ukraine war has significantly disrupted the global powered agriculture equipment market, Sanctions imposed on Russia have restricted the export of critical components and technology needed for manufacturing powered equipment. This has caused delays and shortages, impacting production capacities worldwide. for Example, A leading German manufacturer of tractor engines faced delays due to restrictions on sourcing specific parts typically obtained from Russia. This resulted in a backlog of unfulfilled orders for tractors globally. The war has pushed up the prices of essential raw materials like steel and aluminum. This, coupled with disruptions in global supply chains, has led to significant price increases for powered agricultural equipment. for eg. A major US manufacturer of combine harvesters reported a 15% price increase for their flagship model due to rising steel costs and logistical challenges. The ongoing conflict has severely impacted Ukrainian agriculture. Damaged infrastructure, displacement of farmers, and disrupted supply chains have led to a significant decline in demand for powered equipment within the country.  Estimates suggest that farm machinery sales in Ukraine plummeted by over 70% in 2023 compared to pre-war levels. Overall, the Russia-Ukraine war has created a complex situation for the powered agriculture equipment market. While there might be pockets of increased demand in some regions, the overall market growth is likely to be hampered by supply chain disruptions and rising costs.

IMPACT OF ECONOMIC SLOWDOWN

Due to the economic Slowdown, farmers are reducing their belt-holding and postponing discretionary spending. This can lead to a decrease in demand for new powered equipment, slowdowns often tighten credit markets, making it harder for farmers to secure loans to purchase new equipment. This can further hamper demand and restrict growth. also Farmers become more price-sensitive during economic downturns. They might opt for cheaper, used equipment or postpone purchases altogether until economic conditions improve. This can put pressure on manufacturers to offer competitive pricing or financing options.

Eg, Sales of sophisticated tractors with advanced self-driving features might see a significant decline compared to sales of traditional tractors. industry reports suggest that a 10% economic slowdown could lead to a 7% decline in global powered agriculture equipment sales. This can vary depending on the severity and duration of the slowdown, as well as regional economic resilience.

KEY MARKET SEGMENTS:

By Product Type

  • Tractors

  • Combine

  • Harvester

  • Sprayer

  • Soil Preparation & Cultivation Equipment

  • Seed Drill

  • Balers

  • Others

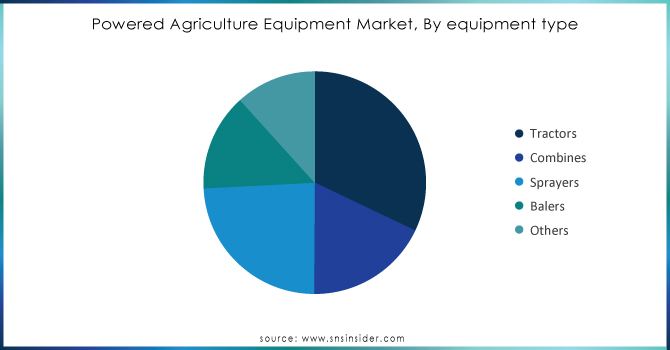
On the basis of product type, the market is segmented into tractors, combines, drills, cultivation and work equipment, sprayers and vacuum cleaners, etc. The tractor segment accounted for the largest revenue share in the fuel-powered agricultural machinery market in 2021. The universal capacity of tractors brings with it expanding deals and deals for agricultural tractors. Incentives and subsidies given by national governments to improve farm automation have increased the adoption of tractors in rural areas and this pattern is expected to continue during the forecast period. The growing need to improve labor skills, further develop soil quality and increase productivity has created interest in tractors for the development and expansion of crops. Volatile fuel costs have also driven various mechanical advances in tractors, and interest in self-driving tractors has grown in agriculture to reduce fuel consumption.

By Function

  • Plowing & Cultivating

  • Sowing & Planting

  • Harvesting & Threshing

  • Plant Protection & Fertilizing

  • Others

The powered agriculture equipment market is segmented by Function to categorize various equipment types based on the specific tasks they perform within the agricultural production cycle. Plowing & Cultivating , this segment holds a significant share, estimated to be around 25% of the market. It encompasses equipment for preparing soil for planting, including tractors, plows, harrows, and cultivators. This segmentation helps manufacturers, distributors, and farmers understand the market landscape and make informed decisions.

Powered-Agriculture-Equipment-Market-Segmentation-by-Function

Need any customization research on Powered Agriculture Equipment Market - Enquiry Now

By Power Output

  • <30 HP

  • 31–70 HP

  • 71–130 HP

  • 131–250 HP

  •  >250 HP

By Drive Type

  • Two-wheel

  • Four-wheel

By Propulsion

  • Hybrid Electric

  • Battery Electric

REGIONAL ANALYSES:

The Asia Pacific is a rapidly growing market with significant potential for future expansion. A mix of farm sizes exists, with a large number of SMEs. SMEs in this region often rely on smaller, more affordable powered equipment like power tillers, rice transplanters, and miniaturized tractors. Government initiatives and financing options play a crucial role in facilitating equipment adoption for SMEs. Government support for farm modernization, rising demand for food due to population growth, and increasing labor costs are major drivers in Asia Pacific. North America has a higher concentration of large farms, while Asia Pacific has a larger number of SMEs. By considering the needs of SMEs alongside larger farms, the market can achieve sustainable and inclusive growth, empowering farmers of all sizes to improve their productivity and profitability.

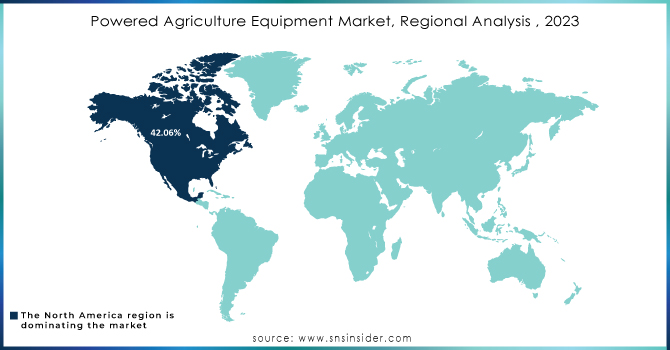
North America region is dominating the market with high penetration of advanced powered equipment. Large farms dominate, driving demand for high-horsepower tractors, precision agriculture technologies, and automation solutions. While large farms are major players, some SMEs utilize smaller, used, or leased powered equipment to manage costs. They might focus on niche markets or high-value crops where efficiency gains justify the investment. A focus on increasing labor productivity, precision agriculture for optimizing yields, and government support for sustainable practices are key drivers.

Powered-Agriculture-Equipment-Market-By-Region

REGIONAL COVERAGE:

North America

  • US

  • Canada

  • Mexico

Europe

  • Eastern Europe

    • Poland

    • Romania

    • Hungary

    • Turkey

    • Rest of Eastern Europe

  • Western Europe

    • Germany

    • France

    • UK

    • Italy

    • Spain

    • Netherlands

    • Switzerland

    • Austria

    • Rest of Western Europe

Asia Pacific

  • China

  • India

  • Japan

  • South Korea

  • Vietnam

  • Singapore

  • Australia

  • Rest of Asia Pacific

Middle East & Africa

  • Middle East

    • UAE

    • Egypt

    • Saudi Arabia

    • Qatar

    • Rest of the Middle East

  • Africa

    • Nigeria

    • South Africa

    • Rest of Africa

Latin America

  • Brazil

  • Argentina

  • Colombia

  • Rest of Latin America

KEY PLAYERS:

The Major Players are AGCO Corporation, John Deere and Co., Mahindra and Mahindra Limited, CNH Industrial N.V., Kubota Corporation, CLAAS, Alamo Group Inc., Accompanies Group, Iseki and Co., Ltd., SDF S.P.A and Other Players

AGCO Corporation-Company Financial Analysis


RECENT DEVELOPMENT

  • In April 12, 2024, Autonomous Tractor Technology Advancements.

John Deere announced advancements in their autonomous tractor technology, with successful field testing of driverless tractors for planting and cultivating tasks.

  • In February 10, 2024, AI-powered Spraying System Launch.

BASF Digital Farming introduced a new AI-powered spraying system that utilizes cameras and sensors for targeted application of crop protection products.

Powered Agriculture Equipment Market Report Scope:

Report Attributes Details
Market Size in 2023 US$ 123.9 Billion
Market Size by 2032 US$ 209.4 Billion
CAGR CAGR of 6.0% From 2024 to 2032
Base Year 2023
Forecast Period 2024-2032
Historical Data 2020-2022
Report Scope & Coverage Market Size, Segments Analysis, Competitive  Landscape, Regional Analysis, DROC & SWOT Analysis, Forecast Outlook
Key Segments • by Type (Tractors, Seed Drill, Soil Preparation & Cultivation Equipment, customization, Sprayer, Others)
• by High-tech agricultural equipment (Harvesting & Picking Robots, Agricultural Drones, Autonomous Tractors, Electric Tractors, Others)
Regional Analysis/Coverage

North America (US, Canada, Mexico), Europe (Eastern Europe [Poland, Romania, Hungary, Turkey, Rest of Eastern Europe] Western Europe] Germany, France, UK, Italy, Spain, Netherlands, Switzerland, Austria, Rest of Western Europe]), Asia Pacific (China, India, Japan, South Korea, Vietnam, Singapore, Australia, Rest of Asia Pacific), Middle East & Africa (Middle East [UAE, Egypt, Saudi Arabia, Qatar, Rest of Middle East], Africa [Nigeria, South Africa, Rest of Africa], Latin America (Brazil, Argentina, Colombia Rest of Latin America

Company Profiles AGCO Corporation, John Deere and Co., Mahindra and Mahindra Limited, CNH Industrial N.V., Kubota Corporation, CLAAS, Alamo Group Inc., Accompanies Group, Iseki and Co., Ltd., SDF S.P.A.

 
Key Drivers • The execution of farm loan waiver schemes urges farmers to purchase farm machinery
RESTRAINTS • The failure of little ranchers to put a high sum brings about the low entrance of farm equipment in arising nations.

Frequently Asked Questions

Ans: The Powered agriculture equipment Market is growing at a CAGR of 6.0 % From 2024 to 2031.

Ans. The Powered Agriculture Equipment Market was valued at USD 197.5 billion in 2023.

  • The execution of farm loan waiver schemes urges farmers to purchase farm machinery
  • The government sent off different plans in various regions of the world to alleviate farmers from their advances and empower farm mechanization.
  • Different organizations express their worries about emission guidelines in various areas of the planet.
  • The execution of emission standards might restrict the deals of development and agricultural machinery

North America region is dominating the Powered agriculture equipment Market.

TABLE OF CONTENTS

1. Introduction
1.1 Market Definition
1.2 Scope
1.3 Research Assumptions

2. Industry Flowchart

3. Research Methodology

4. Market Dynamics
4.1 Vehiclers
4.2 Restraints
4.3 Opportunities
4.4 Challenges

5. Impact Analysis
5.1 Impact of Russia-Ukraine Crisis
5.2 Impact of Economic Slowdown on Major Countries
5.2.1 Introduction
5.2.2 United States
5.2.3 Canada
5.2.4 Germany
5.2.5 France
5.2.6 UK
5.2.7 China
5.2.8 Japan
5.2.9 South Korea
5.2.10 India

6. Value Chain Analysis

7. Porter’s 5 Forces Model

8.  Pest Analysis

9. Powered Agriculture Equipment Market Segmentation, By Product Type
9.1 Introduction
9.2 Trend Analysis
9.3 Tractors
9.4 Combine
9.5 Harvester
9.6 Sprayer
9.7 Soil Preparation & Cultivation Equipment
9.8 Seed Drill
9.9 Balers
9.10 Others

10. Powered Agriculture Equipment Market Segmentation, By Function
10.1 Introduction
10.2 Trend Analysis
10.3 Plowing & Cultivating
10.4 Sowing & Planting
10.5 Harvesting & Threshing
10.6 Plant Protection & Fertilizing
10.7 Others

11. Powered Agriculture Equipment Market Segmentation, By Power Output
11.1 Introduction
11.2 Trend Analysis
11.3 <30 HP
11.4 31–70 HP
11.5 71–130 HP
11.6 131–250 HP
11.7 >250 HP

12. Powered Agriculture Equipment Market Segmentation, By Drive Type
12.1 Introduction
12.2 Trend Analysis
12.3 Two-wheel
12.4 Four-wheel

13. Powered Agriculture Equipment Market Segmentation, By Propulsion
13.1 Introduction
13.2 Trend Analysis
13.3 Hybrid Electric
13.4 Battery Electric

14. Regional Analysis
14.1 Introduction
14.2 North America
14.2.1 Trend Analysis
14.2.2 North America Powered Agriculture Equipment Market By Country
14.2.3 North America Powered Agriculture Equipment Market By Product Type
14.2.4 North America Powered Agriculture Equipment Market By Function
14.2.5 North America Powered Agriculture Equipment Market By Power Output
14.2.6 North America Powered Agriculture Equipment Market, By Drive Type
14.2.7 North America Powered Agriculture Equipment Market, By Propulsion
14.2.8 USA    
14.2.8.1 USA Powered Agriculture Equipment Market By Product Type
14.2.8.2 USA Powered Agriculture Equipment Market By Function
14.2.8.3 USA Powered Agriculture Equipment Market By Power Output
14.2.8.4 USA Powered Agriculture Equipment Market, By Drive Type
14.2.8.5 USA Powered Agriculture Equipment Market, By Propulsion
14.2.9 Canada
14.2.9.1 Canada Powered Agriculture Equipment Market By Product Type    
14.2.9.2 Canada Powered Agriculture Equipment Market By Function
14.2.9.3 Canada Powered Agriculture Equipment Market By Power Output
14.2.9.4 Canada Powered Agriculture Equipment Market, By Drive Type
14.2.9.5 Canada Powered Agriculture Equipment Market, By Propulsion
14.2.10 Mexico
14.2.10.1 Mexico Powered Agriculture Equipment Market By Product Type
14.2.10.2 Mexico Powered Agriculture Equipment Market By Function 
14.2.10.3 Mexico Powered Agriculture Equipment Market By Power Output
14.2.10.4 Mexico Powered Agriculture Equipment Market, By Drive Type
14.2.10.5 Mexico Powered Agriculture Equipment Market, By Propulsion
14.3 Europe 
14.3.1 Trend Analysis
14.3.2 Eastern Europe
14.3.2.1 Eastern Europe Powered Agriculture Equipment Market By Country
14.3.2.2 Eastern Europe Powered Agriculture Equipment Market By Product Type
14.3.2.3 Eastern Europe Powered Agriculture Equipment Market By Function
14.3.2.4 Eastern Europe Powered Agriculture Equipment Market By Power Output
14.3.2.5 Eastern Europe Powered Agriculture Equipment Market By Drive Type
14.3.2.6 Eastern Europe Powered Agriculture Equipment Market, By Propulsion
14.3.2.7 Poland
14.3.2.7.1 Poland Powered Agriculture Equipment Market By Product Type    
14.3.2.7.2 Poland Powered Agriculture Equipment Market By Function
14.3.2.7.3 Poland Powered Agriculture Equipment Market By Power Output
14.3.2.7.4 Poland Powered Agriculture Equipment Market By Drive Type
14.3.2.7.5 Poland Powered Agriculture Equipment Market, By Propulsion
14.3.2.8 Romania
14.3.2.8.1 Romania Powered Agriculture Equipment Market By Product Type    
14.3.2.8.2 Romania Powered Agriculture Equipment Market By Function
14.3.2.8.3 Romania Powered Agriculture Equipment Market By Power Output
14.3.2.8.4 Romania Powered Agriculture Equipment Market By Drive Type
14.3.2.8.5 Romania Powered Agriculture Equipment Market, By Propulsion
14.3.2.9 Hungary
14.3.2.9.1 Hungary Powered Agriculture Equipment Market By Product Type
14.3.2.9.2 Hungary Powered Agriculture Equipment Market By Function
14.3.2.9.3 Hungary Powered Agriculture Equipment Market By Power Output
14.3.2.9.4 Hungary Powered Agriculture Equipment Market By Drive Type
14.3.2.9.5 Hungary Powered Agriculture Equipment Market, By Propulsion
14.3.2.10 Turkey
14.3.2.10.1 Turkey Powered Agriculture Equipment Market By Product Type
14.3.2.10.2 Turkey Powered Agriculture Equipment Market By Function
14.3.2.10.3 Turkey Powered Agriculture Equipment Market By Power Output
14.3.2.10.4 Turkey Powered Agriculture Equipment Market By Drive Type
14.3.2.10.5 Turkey Powered Agriculture Equipment Market, By Propulsion
14.3.2.11 Rest of Eastern Europe
14.3.2.11.1 Rest of Eastern Europe Powered Agriculture Equipment Market By Product Type
14.3.2.11.2 Rest of Eastern Europe Powered Agriculture Equipment Market By Function
14.3.2.11.3 Rest of Eastern Europe Powered Agriculture Equipment Market By Power Output
14.3.2.11.4 Rest of Eastern Europe Powered Agriculture Equipment Market By Drive Type
14.3.2.11.5 Rest of Eastern Europe Powered Agriculture Equipment Market, By Propulsion
14.3.3 Western Europe  
14.3.3.1 Western Europe Powered Agriculture Equipment Market By Country
14.3.3.2 Western Europe Powered Agriculture Equipment Market By Product Type
14.3.3.3 Western Europe Powered Agriculture Equipment Market By Function
14.3.3.4 Western Europe Powered Agriculture Equipment Market By Power Output 
14.3.3.5 Western Europe Powered Agriculture Equipment Market By Drive Type
14.3.3.6 Western Europe Powered Agriculture Equipment Market, By Propulsion
14.3.3.7 Germany
14.3.3.7.1 Germany Powered Agriculture Equipment Market By Product Type
14.3.3.7.2 Germany Powered Agriculture Equipment Market By Function
14.3.3.7.3 Germany Powered Agriculture Equipment Market By Power Output
14.3.3.7.4 Germany Powered Agriculture Equipment Market By Drive Type
14.3.3.7.5 Germany Powered Agriculture Equipment Market, By Propulsion
14.3.3.8 France  
14.3.3.8.1 France Powered Agriculture Equipment Market By Product Type
14.3.3.8.2 France Powered Agriculture Equipment Market By Function
14.3.3.8.3 France Powered Agriculture Equipment Market By Power Output
14.3.3.8.4 France Powered Agriculture Equipment Market By Drive Type
14.3.3.8.5 France Powered Agriculture Equipment Market, By Propulsion
14.3.3.9 UK
14.3.3.9.1 UK Powered Agriculture Equipment Market By Product Type
14.3.3.9.2 UK Powered Agriculture Equipment Market By Function
14.3.3.9.3 UK Powered Agriculture Equipment Market By Power Output
14.3.3.9.4 UK Powered Agriculture Equipment Market By Drive Type
14.3.3.9.5 UK Powered Agriculture Equipment Market, By Propulsion
14.3.3.10 Italy
14.3.3.10.1 Italy Powered Agriculture Equipment Market By Product Type    
14.3.3.10.2 Italy Powered Agriculture Equipment Market By Function
14.3.3.10.3 Italy Powered Agriculture Equipment Market By Power Output
14.3.3.10.4 Italy Powered Agriculture Equipment Market By Drive Type
14.3.3.10.5 Italy Powered Agriculture Equipment Market, By Propulsion
14.3.3.11 Spain
14.3.3.11.1 Spain Powered Agriculture Equipment Market By Product Type
14.3.3.11.2 Spain Powered Agriculture Equipment Market By Function
14.3.3.11.3 Spain Powered Agriculture Equipment Market By Power Output
14.3.3.11.4 Spain Powered Agriculture Equipment Market By Drive Type
14.3.3.11.5 Spain Powered Agriculture Equipment Market, By Propulsion
14.3.3.12 Netherlands
14.3.3.12.1 Netherlands Powered Agriculture Equipment Market By Product Type    
14.3.3.12.2 Netherlands Powered Agriculture Equipment Market By Function
14.3.3.12.3 Netherlands Powered Agriculture Equipment Market By Power Output
14.3.3.12.4 Netherlands Powered Agriculture Equipment Market By Drive Type
14.3.3.12.5 Netherlands Powered Agriculture Equipment Market, By Propulsion
14.3.3.13 Switzerland
14.3.3.13.1 Switzerland Powered Agriculture Equipment Market By Product Type    
14.3.3.13.2 Switzerland Powered Agriculture Equipment Market By Function
14.3.3.13.3 Switzerland Powered Agriculture Equipment Market By Power Output
14.3.3.13.4 Switzerland Powered Agriculture Equipment Market By Drive Type
14.3.3.13.5 Switzerland Powered Agriculture Equipment Market, By Propulsion
14.3.3.14 Austria  
14.3.3.14.1 Austria Powered Agriculture Equipment Market By Product Type
14.3.3.14.2 Austria Powered Agriculture Equipment Market By Function     
14.3.3.14.3 Austria Powered Agriculture Equipment Market By Power Output
14.3.3.14.4 Austria Powered Agriculture Equipment Market By Drive Type
14.3.3.14.5 Austria Powered Agriculture Equipment Market, By Propulsion
14.3.3.15 Rest of Western Europe
14.3.3.15.1 Rest of Western Europe Powered Agriculture Equipment Market By Product Type
14.3.3.15.2 Rest of Western Europe Powered Agriculture Equipment Market By Function
14.3.3.15.3 Rest of Western Europe Powered Agriculture Equipment Market By Power Output
14.3.3.15.4 Rest of Western Europe Powered Agriculture Equipment Market By Drive Type
14.3.3.15.5 Rest of Western Europe Powered Agriculture Equipment Market, By Propulsion
14.4 Asia-Pacific
14.4.1 Trend Analysis
14.4.2 Asia-Pacific Powered Agriculture Equipment Market By country
14.4.3 Asia-Pacific Powered Agriculture Equipment Market By Product Type    
14.4.4 Asia-Pacific Powered Agriculture Equipment Market By Function
14.4.5 Asia-Pacific Powered Agriculture Equipment Market By Power Output
14.4.6 Asia-Pacific Powered Agriculture Equipment Market By Drive Type
14.4.7 Asia-Pacific Powered Agriculture Equipment Market, By Propulsion
14.4.8 China
14.4.8.1 China Powered Agriculture Equipment Market By Product Type    
14.4.8.2 China Powered Agriculture Equipment Market By Function    
14.4.8.3 China Powered Agriculture Equipment Market By Power Output
14.4.8.4 China Powered Agriculture Equipment Market By Drive Type
14.4.8.5 China Powered Agriculture Equipment Market, By Propulsion
14.4.9 India
14.4.9.1 India Powered Agriculture Equipment Market By Product Type
14.4.9.2 India Powered Agriculture Equipment Market By Function
14.4.9.3 India Powered Agriculture Equipment Market By Power Output
14.4.9.4 India Powered Agriculture Equipment Market By Drive Type
14.4.9.5 India Powered Agriculture Equipment Market, By Propulsion
14.4.10 Japan
14.4.10.1 Japan Powered Agriculture Equipment Market By Product Type
14.4.10.2 Japan Powered Agriculture Equipment Market By Function
14.4.10.3 Japan Powered Agriculture Equipment Market By Power Output
14.4.10.4 Japan Powered Agriculture Equipment Market By Drive Type
14.4.10.5 Japan Powered Agriculture Equipment Market, By Propulsion
14.4.11 South Korea 
14.4.11.1 South Korea Powered Agriculture Equipment Market By Product Type
14.4.11.2 South Korea Powered Agriculture Equipment Market By Function
14.4.11.3 South Korea Powered Agriculture Equipment Market By Power Output
14.4.11.4 South Korea Powered Agriculture Equipment Market By Drive Type
14.4.11.5 South Korea Powered Agriculture Equipment Market, By Propulsion
14.4.12 Vietnam
14.4.12.1 Vietnam Powered Agriculture Equipment Market By Product Type
14.4.12.2 Vietnam Powered Agriculture Equipment Market By Function 
14.4.12.3 Vietnam Powered Agriculture Equipment Market By Power Output
14.4.12.4 Vietnam Powered Agriculture Equipment Market By Drive Type
14.4.12.5 Vietnam Powered Agriculture Equipment Market, By Propulsion
14.4.13 Singapore
14.4.13.1 Singapore Powered Agriculture Equipment Market By Product Type
14.4.13.2 Singapore Powered Agriculture Equipment Market By Function
14.4.13.3 Singapore Powered Agriculture Equipment Market By Power Output 
14.4.13.4 Singapore Powered Agriculture Equipment Market By Drive Type
14.4.13.5 Singapore Powered Agriculture Equipment Market, By Propulsion
14.4.14 Australia 
14.4.14.1 Australia Powered Agriculture Equipment Market By Product Type
14.4.14.2 Australia Powered Agriculture Equipment Market By Function
14.4.14.3 Australia Powered Agriculture Equipment Market By Power Output
14.4.14.4 Australia Powered Agriculture Equipment Market By Drive Type
14.4.14.5 Australia Powered Agriculture Equipment Market, By Propulsion
14.4.15 Rest of Asia-Pacific
14.4.15.1 Rest of Asia-Pacific Powered Agriculture Equipment Market By Product Type
14.4.15.2 Rest of Asia-Pacific Powered Agriculture Equipment Market By Function
14.4.15.3 Rest of Asia-Pacific Powered Agriculture Equipment Market By Power Output
14.4.15.4 Rest of Asia-Pacific Powered Agriculture Equipment Market By Drive Type
14.4.15.5 Rest of Asia-Pacific Powered Agriculture Equipment Market, By Propulsion
14.5 Middle East & Africa
14.5.1 Trend Analysis
14.5.2 Middle East 
14.5.2.1 Middle East Powered Agriculture Equipment Market By Country
14.5.2.2 Middle East Powered Agriculture Equipment Market By Product Type
14.5.2.3 Middle East Powered Agriculture Equipment Market By Function
14.5.2.4 Middle East Powered Agriculture Equipment Market By Power Output
14.5.2.5 Middle East Powered Agriculture Equipment Market By Drive Type
14.5.2.6 Middle East Powered Agriculture Equipment Market, By Propulsion
14.5.2.7 UAE
14.5.2.7.1 UAE Powered Agriculture Equipment Market By Product Type
14.5.2.7.2 UAE Powered Agriculture Equipment Market By Function
14.5.2.7.3 UAE Powered Agriculture Equipment Market By Power Output
14.5.2.7.4 UAE Powered Agriculture Equipment Market By Drive Type
14.5.2.7.5 UAE Powered Agriculture Equipment Market, By Propulsion
14.5.2.8 Egypt
14.5.2.8.1 Egypt Powered Agriculture Equipment Market By Product Type
14.5.2.8.2 Egypt Powered Agriculture Equipment Market By Function
14.5.2.8.3 Egypt Powered Agriculture Equipment Market By Power Output
14.5.2.8.4 Egypt Powered Agriculture Equipment Market By Drive Type
14.5.2.8.5 Egypt Powered Agriculture Equipment Market, By Propulsion
14.5.2.9 Saudi Arabia  
14.5.2.9.1 Saudi Arabia Powered Agriculture Equipment Market By Product Type
14.5.2.9.2 Saudi Arabia Powered Agriculture Equipment Market By Function
14.5.2.9.3 Saudi Arabia Powered Agriculture Equipment Market By Power Output
14.5.2.9.4 Saudi Arabia Powered Agriculture Equipment Market By Drive Type
14.5.2.9.5 Saudi Arabia Powered Agriculture Equipment Market, By Propulsion
14.5.2.10 Qatar
14.5.2.10.1 Qatar Powered Agriculture Equipment Market By Product Type
14.5.2.10.2 Qatar Powered Agriculture Equipment Market By Function
14.5.2.10.3 Qatar Powered Agriculture Equipment Market By Power Output
14.5.2.10.4 Qatar Powered Agriculture Equipment Market By Drive Type
14.5.2.10.5 Qatar Powered Agriculture Equipment Market, By Propulsion
14.5.2.11 Rest of Middle East
14.5.2.11.1 Rest of Middle East Powered Agriculture Equipment Market By Product Type
14.5.2.11.2 Rest of Middle East Powered Agriculture Equipment Market By Function
14.5.2.11.3 Rest of Middle East Powered Agriculture Equipment Market By Power Output
14.5.2.11.4 Rest of Middle East Powered Agriculture Equipment Market By Drive Type
14.5.2.11.5 Rest of Middle East Powered Agriculture Equipment Market, By Propulsion
14.5.3 Africa
14.5.3.1 Africa Powered Agriculture Equipment Market By Country
14.5.3.2 Africa Powered Agriculture Equipment Market By Product Type
14.5.3.3 Africa Powered Agriculture Equipment Market By Function
14.5.3.4 Africa Powered Agriculture Equipment Market By Power Output
14.5.3.5 Africa Powered Agriculture Equipment Market By Drive Type
14.5.3.6 Africa Powered Agriculture Equipment Market, By Propulsion
14.5.3.7 Nigeria
14.5.3.7.1 Nigeria Powered Agriculture Equipment Market By Product Type
14.5.3.7.2 Nigeria Powered Agriculture Equipment Market By Function
14.5.3.7.3 Nigeria Powered Agriculture Equipment Market By Power Output
14.5.3.7.4 Nigeria Powered Agriculture Equipment Market By Drive Type
14.5.3.7.5 Nigeria Powered Agriculture Equipment Market, By Propulsion
14.5.3.8 South Africa
14.5.3.8.1 South Africa Powered Agriculture Equipment Market By Product Type
14.5.3.8.2 South Africa Powered Agriculture Equipment Market By Function
14.5.3.8.3 South Africa Powered Agriculture Equipment Market By Power Output
14.5.3.8.4 South Africa Powered Agriculture Equipment Market By Drive Type
14.5.3.8.5 South Africa Powered Agriculture Equipment Market, By Propulsion
14.5.3.9 Rest of Africa
14.5.3.9.1 Rest of Africa Powered Agriculture Equipment Market By Product Type
14.5.3.9.2 Rest of Africa Powered Agriculture Equipment Market By Function
14.5.3.9.3 Rest of Africa Powered Agriculture Equipment Market By Power Output
14.5.3.9.4 Rest of Africa Powered Agriculture Equipment Market By Drive Type
14.5.3.9.5 Rest of Africa Powered Agriculture Equipment Market, By Propulsion
14.6 Latin America
14.6.1 Trend Analysis
14.6.2 Latin America Powered Agriculture Equipment Market By country
14.6.3 Latin America Powered Agriculture Equipment Market By Product Type
14.6.4 Latin America Powered Agriculture Equipment Market By Function
14.6.5 Latin America Powered Agriculture Equipment Market By Power Output
14.6.6 Latin America Powered Agriculture Equipment Market By Drive Type
14.6.7 Latin America Powered Agriculture Equipment Market, By Propulsion
14.6.8 Brazil
14.6.8.1 Brazil Powered Agriculture Equipment Market By Product Type
14.6.8.2 Brazil Powered Agriculture Equipment Market By Function
14.6.8.3 Brazil Powered Agriculture Equipment Market By Power Output
14.6.8.4 Brazil Powered Agriculture Equipment Market By Drive Type
14.6.8.5 Brazil Powered Agriculture Equipment Market, By Propulsion
14.6.9 Argentina
14.6.9.1 Argentina Powered Agriculture Equipment Market By Product Type
14.6.9.2 Argentina Powered Agriculture Equipment Market By Function
14.6.9.3 Argentina Powered Agriculture Equipment Market By Power Output
14.6.9.4 Argentina Powered Agriculture Equipment Market By Drive Type
14.6.9.5 Argentina Powered Agriculture Equipment Market, By Propulsion
14.6.10 Colombia
14.6.10.1 Colombia Powered Agriculture Equipment Market By Product Type
14.6.10.2 Colombia Powered Agriculture Equipment Market By Function
14.6.10.3 Colombia Powered Agriculture Equipment Market By Power Output
14.6.10.4 Colombia Powered Agriculture Equipment Market By Drive Type
14.6.10.5 Colombia Powered Agriculture Equipment Market, By Propulsion
14.6.11 Rest of Latin America
14.6.11.1 Rest of Latin America Powered Agriculture Equipment Market By Product Type
14.6.11.2 Rest of Latin America Powered Agriculture Equipment Market By Function
14.6.11.3 Rest of Latin America Powered Agriculture Equipment Market By Power Output
14.6.11.4 Rest of Latin America Powered Agriculture Equipment Market By Drive Type
14.6.11.5 Rest of Latin America Powered Agriculture Equipment Market, By Propulsion

15. Company Profiles
15.1 SDF S.P.A
15.1.1 Company Overview
15.1.2 Financial
15.1.3 Products/ Service Offered
15.1.4 SWOT Analysis
15.1.5 The SNS View
15.2 John Deere and Co.
15.2.1 Company Overview
15.2.2 Financial
15.2.3 Products/ Service Offered
15.2.4 SWOT Analysis
15.2.5 The SNS View
15.3 Kubota Corporation
15.3.1 Company Overview
15.3.2 Financial
15.3.3 Products/ Service Offered
15.3.4 SWOT Analysis
15.3.5 The SNS View
15.4 Accompanies Group.
15.4.1 Company Overview
15.4.2 Financial
15.4.3 Products/ Service Offered
15.4.4 SWOT Analysis
15.4.5 The SNS View
15.5 AGCO Corporation.
15.5.1 Company Overview
15.5.2 Financial
15.5.3 Products/ Service Offered
15.5.4 SWOT Analysis
15.5.5 The SNS View
15.6 Alamo Group Inc.
15.6.1 Company Overview
15.6.2 Financial
15.6.3 Products/ Service Offered
15.6.4 SWOT Analysis
15.6.5 The SNS View
15.7 CLAAS
15.7.1 Company Overview
15.7.2 Financial
15.7.3 Products/ Service Offered
15.7.4 SWOT Analysis
15.7.5 The SNS View
15.8 Iseki
15.8.1 Company Overview
15.8.2 Financial
15.8.3 Products/ Service Offered
15.8.4 SWOT Analysis
15.8.5 The SNS View
15.9 Mahindra and Mahindra Limited Co., Ltd.
15.9.1 Company Overview
15.9.2 Financial
15.9.3 Products/ Service Offered
15.9.4 SWOT Analysis
15.9.5 The SNS View
15.10 CNH Industrial N.V.
15.10.1 Company Overview
15.10.2 Financial
15.10.3 Products/ Service Offered
15.10.4 SWOT Analysis
15.10.5 The SNS View

16. Competitive Landscape
16.1 Competitive Benchmarking
16.2 Market Share Analysis
16.3 Recent Developments 
16.3.1 Industry News
16.3.2 Company News
16.3.3 Mergers & Acquisitions

17. Use Case and Best Practices

18. Conclusion

An accurate research report requires proper strategizing as well as implementation. There are multiple factors involved in the completion of good and accurate research report and selecting the best methodology to compete the research is the toughest part. Since the research reports we provide play a crucial role in any company’s decision-making process, therefore we at SNS Insider always believe that we should choose the best method which gives us results closer to reality. This allows us to reach at a stage wherein we can provide our clients best and accurate investment to output ratio.

Each report that we prepare takes a timeframe of 350-400 business hours for production. Starting from the selection of titles through a couple of in-depth brain storming session to the final QC process before uploading our titles on our website we dedicate around 350 working hours. The titles are selected based on their current market cap and the foreseen CAGR and growth.


The 5 steps process:

Step 1: Secondary Research:

Secondary Research or Desk Research is as the name suggests is a research process wherein, we collect data through the readily available information. In this process we use various paid and unpaid databases which our team has access to and gather data through the same. This includes examining of listed companies’ annual reports, Journals, SEC filling etc. Apart from this our team has access to various associations across the globe across different industries. Lastly, we have exchange relationships with various university as well as individual libraries.

Secondary Research

Step 2: Primary Research

When we talk about primary research, it is a type of study in which the researchers collect relevant data samples directly, rather than relying on previously collected data.  This type of research is focused on gaining content specific facts that can be sued to solve specific problems. Since the collected data is fresh and first hand therefore it makes the study more accurate and genuine.

We at SNS Insider have divided Primary Research into 2 parts.

Part 1 wherein we interview the KOLs of major players as well as the upcoming ones across various geographic regions. This allows us to have their view over the market scenario and acts as an important tool to come closer to the accurate market numbers. As many as 45 paid and unpaid primary interviews are taken from both the demand and supply side of the industry to make sure we land at an accurate judgement and analysis of the market.

This step involves the triangulation of data wherein our team analyses the interview transcripts, online survey responses and observation of on filed participants. The below mentioned chart should give a better understanding of the part 1 of the primary interview.

Primary Research

Part 2: In this part of primary research the data collected via secondary research and the part 1 of the primary research is validated with the interviews from individual consultants and subject matter experts.

Consultants are those set of people who have at least 12 years of experience and expertise within the industry whereas Subject Matter Experts are those with at least 15 years of experience behind their back within the same space. The data with the help of two main processes i.e., FGDs (Focused Group Discussions) and IDs (Individual Discussions). This gives us a 3rd party nonbiased primary view of the market scenario making it a more dependable one while collation of the data pointers.

Step 3: Data Bank Validation

Once all the information is collected via primary and secondary sources, we run that information for data validation. At our intelligence centre our research heads track a lot of information related to the market which includes the quarterly reports, the daily stock prices, and other relevant information. Our data bank server gets updated every fortnight and that is how the information which we collected using our primary and secondary information is revalidated in real time.

Data Bank Validation

Step 4: QA/QC Process

After all the data collection and validation our team does a final level of quality check and quality assurance to get rid of any unwanted or undesired mistakes. This might include but not limited to getting rid of the any typos, duplication of numbers or missing of any important information. The people involved in this process include technical content writers, research heads and graphics people. Once this process is completed the title gets uploader on our platform for our clients to read it.

Step 5: Final QC/QA Process:

This is the last process and comes when the client has ordered the study. In this process a final QA/QC is done before the study is emailed to the client. Since we believe in giving our clients a good experience of our research studies, therefore, to make sure that we do not lack at our end in any way humanly possible we do a final round of quality check and then dispatch the study to the client.


  •            5000 (33% Discount)


  •            8950 (40% Discount)


  •            3050 (23% Discount)

Start a Conversation

Hi! Click one of our member below to chat on Phone