Process Analytical Technology Market Report Scope & Overview:
Get More Information on Process Analytical Technology Market - Request Sample Report
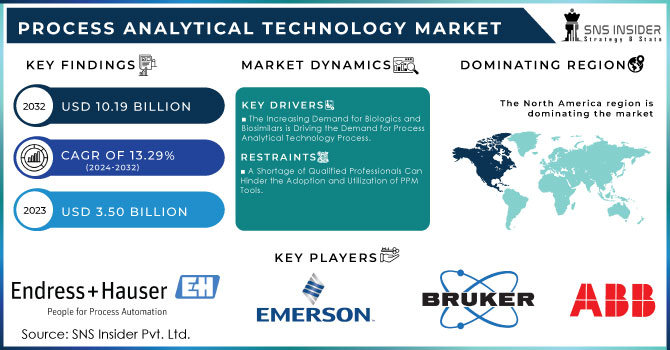
The Process Analytical Technology Market Size was valued at USD 3.50 Billion in 2023, and is expected to reach USD 10.19 Billion by 2032, and grow at a CAGR of 13.29%.
The demand for high-quality products in pharmaceuticals and biotechnology has led to the increased use of process analytical technology (PAT) in the manufacturing of drugs, vaccines, and antibiotics. PAT helps reduce downtime, increase productivity, and expedite process development and scaling in various industries. Control parameters affecting critical quality attributes are identified through PAT in the planning, analysis, and production processes in the pharmaceutical sector. The pharmaceutical industry in the Asia-Pacific (APAC) region is expected to witness a surge in demand for PAT, fueled by increased research and development spending on the use of process analytical technologies.
Real-time analytics has become increasingly crucial in sectors such as chemicals, pharmaceuticals, and food and beverages. PAT provides producers with immediate information about production processes, enabling them to take proactive measures and streamline operations. The growth of PAT is driven by technological advancements, including digital twins and artificial intelligence. Pharmaceutical artificial intelligence incorporates correction mechanisms for autonomous control and automated feedback. Digital twins, virtual representations of real manufacturing systems, gather data from control systems to adjust manufacturing processes and perform analysis.
MARKET DYNAMICS:
Key Drivers:
-
The Increasing Demand for Biologics and Biosimilars is Driving the Demand for Process Analytical Technology Process.
-
Regulatory Bodies such as the FDA are Endorsing the Adoption of Process Analytical Technology (PAT) To Enhance Manufacturing Quality, especially in the Pharmaceutical Industry.
Restraints:
-
Implementing A PPM Solution Can Require a Significant Upfront Investment, Which May Be a Barrier for Smaller Organizations or Those with Limited Budgets.
-
A Shortage of Qualified Professionals Can Hinder the Adoption and Utilization of PPM Tools.
Opportunity:
-
The Integration of Advanced Technologies Such as Artificial Intelligence, Machine Learning, and Big Data Analytics with PAT Tools is Propelling Market Growth.
-
Emerging Markets, Particularly in The Asia-Pacific Region, are Seeing Increased Adoption of PAT As Industries in These Regions Grow and Modernize.
KEY MARKET SEGMENTATION:
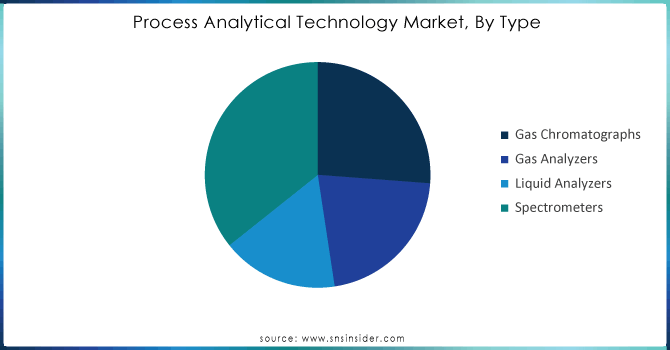
By Type
Spectrometers hold the largest market share, accounting for about 36% of the analytical instruments market in 2023. They are versatile and used across a wide range of applications in various sectors. Spectrometers can be utilized for both qualitative and quantitative analysis in fields such as pharmaceuticals, biotechnology, environmental science, and materials science. The ability of these devices to identify and quantify compounds makes them crucial in drug development, quality control, and environmental monitoring.
In the life sciences and pharmaceuticals industry, detailed analysis is essential, which necessitates the use of high-quality devices. Over the years, spectroscopic techniques have become more efficient and versatile, and they play a crucial role in the effective operation and management of research and development services in industries focused on innovation and precision.
The increasing demand for technologically advanced spectrophotometric instruments is driven by the need for detailed molecular analysis, particularly in the growing field of personalized medicine. Additionally, to adhere to international standards and regulations, it has become necessary for equipment to accurately measure and monitor. These high-precision spectrometric tools are integral due to their wide range of applications, compared to other devices in the analytical instrumentation market.
Need any customization research on Process Analytical Technology Market - Enquiry Now
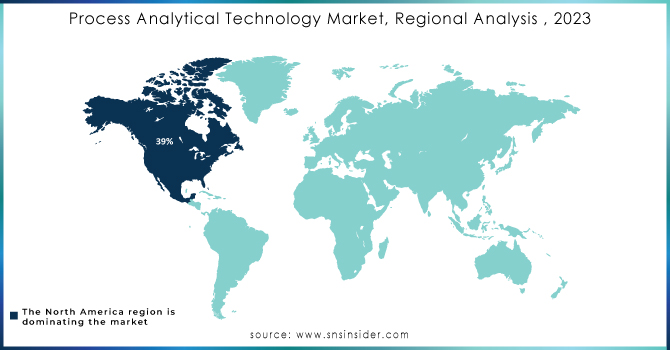
REGIONAL ANALYSIS:
The North America PAT market was held by North America in the year 2023, with a market share of 39%. However, the presence of a large number of significant pharmaceuticals and biotechnology firms and their rapid expansion, in addition to a substantial spend on research and development, and authorities’ support for using PAT in industries are some of the factors that are responsible for the growth of the market. On the other hand, the U.S. PAT market has a market share of 86.2% in the year 2023, contributing the highest to the North American market. The increasing utilization of advanced analytic technology and process optimization technology and strong R&D in PAT in the country are the major driving factors for the growth of the U.S. process analytic technology market.
The European process analytical technology market was deemed as a lucrative one in 2023. The expansion of the market was fuelled by the growing emphasis on process optimization and continuous improvement, and by the increasing need for high-quality products. The regulation pressure within Europe’s pharma and biotech is one of the contributing factors to the rising use of PAT.
KEY PLAYERS:
The key market players are Focused Photonics Inc., ABB Ltd, Mettler Toledo, Endress & Hauser AG, Emerson Electric Co., Extrel CMS LLC, Bruker Corporation, Hach Company, Siemens AG, Horiba Ltd & other players.
RECENT DEVELOPMENTS
-
The United States Pharmacopeia announced in April 2024 that it was developing a special General Chapter on Process Analytical Technology. The primary purpose of the proposed Chapter is to define PAT and its key attributes, assess its enablers, and discuss the use of its applications throughout the pharmaceutical industry. The section aims to align with prevailing scientific and regulatory standards, focusing on real-time monitoring, controlling, and quality assessment in pharmaceutical manufacturing. It also explores PAT’s contribution to better-managed processes, especially in Continuous Process Verification and Real-Time Release Testing.
-
In April 2024, Valmet announced that it had completed the acquisition of the Process Gas Chromatography & Integration business of Siemens AG. This part of Siemens AG specializes in the MAXUM II Gas Chromatograph platform, Systems Integration, and Customer Services. The gas chromatograph is used to evaluate the chemical composition of gases and evaporation liquids during various production phases. With expertise in chemical processes, liquefied natural gas, refining, and biofuels, the business provides critical knowledge for enhancing quality, sustainability, and safety on a global scale.
| Report Attributes | Details |
|---|---|
| Market Size in 2023 | US$ 3.50 Billion |
| Market Size by 2032 | US$ 10.19 Billion |
| CAGR | CAGR of 13.29% From 2024 to 2032 |
| Base Year | 2023 |
| Forecast Period | 2024-2032 |
| Historical Data | 2020-2022 |
| Report Scope & Coverage | Market Size, Segments Analysis, Competitive Landscape, Regional Analysis, DROC & SWOT Analysis, Forecast Outlook |
| Key Segments | •By Type (Gas Chromatographs, Gas Analyzers, Liquid Analyzers, and Spectrometers) •By End-User Industry (Oil & Gas, Chemicals & Petrochemicals, Pharmaceutical & Biotechnology, Metal & Mining, Water & Wastewater, and Others) |
| Regional Analysis/Coverage | North America (US, Canada, Mexico), Europe (Eastern Europe [Poland, Romania, Hungary, Turkey, Rest of Eastern Europe] Western Europe] Germany, France, UK, Italy, Spain, Netherlands, Switzerland, Austria, Rest of Western Europe]), Asia Pacific (China, India, Japan, South Korea, Vietnam, Singapore, Australia, Rest of Asia Pacific), Middle East & Africa (Middle East [UAE, Egypt, Saudi Arabia, Qatar, Rest of Middle East], Africa [Nigeria, South Africa, Rest of Africa], Latin America (Brazil, Argentina, Colombia, Rest of Latin America) |
| Company Profiles | Focused Photonics Inc., ABB Ltd, Mettler Toledo, Endress & Hauser AG, Emerson Electric Co., Extrel CMS LLC, Bruker Corporation, Hach Company, Siemens AG, Horiba Ltd & other players |
| Key Drivers | •The Increasing Demand for Biologics and Biosimilars is Driving the Demand for Process Analytical Technology Process. •Regulatory Bodies such as the FDA are Endorsing the Adoption of Process Analytical Technology (PAT) To Enhance Manufacturing Quality, especially in the Pharmaceutical Industry. |
| RESTRAINTS | •Implementing A PPM Solution Can Require a Significant Upfront Investment, Which May Be a Barrier for Smaller Organizations or Those with Limited Budgets. •A Shortage of Qualified Professionals Can Hinder the Adoption and Utilization of PPM Tools. |
Frequently Asked Questions
Ans: The Process Analytical Technology Market was valued at USD 3.50 Billion in 2023.
Ans: The expected CAGR of the Global Process Analytical Technology Market during the forecast period is 13.29%
Ans: Spectrometers held the largest share in the Process Analytical Technology Market in 2023.
Ans: The Process Analytical Technology Market will be valued at USD 10.19 Billion in 2032.
Ans: The North America led Process Analytical Technology Market.
Get in Touch
