Push to Talk Market Size & Overview:
To Get More Information on Push to Tal Market - Request Sample Report
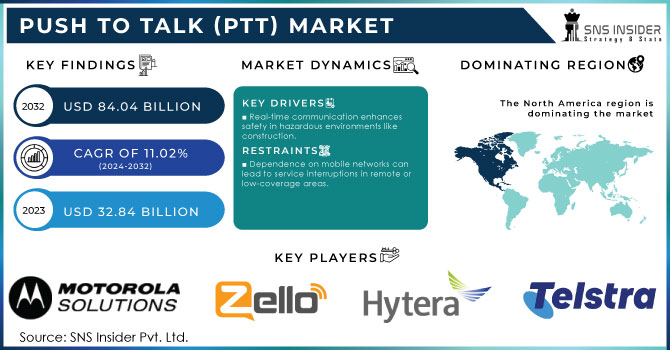
Push to Talk (PTT) Market was valued at USD 32.84 billion in 2023 and is expected to reach USD 84.04 billion by 2032, growing at a CAGR of 11.02% from 2024-2032.
The Push to Talk (PTT) market is growing rapidly, fueled by advancements in communication technology and a rising need for effective team collaboration. PTT allows instant voice communication at the press of a button, much like a walkie-talkie, and is commonly used in public safety, construction, transportation, and utilities.
The widespread implementation of LTE and 5G networks is significantly enhancing the Push to Talk (PTT) market. As of 2023, around 85% of the world's population had access to LTE networks, which boosts PTT service reliability and coverage. The global 5G adoption rate is also accelerating, with 5G subscriptions expected to reach 4.6 billion by 2028, covering nearly 60% of the world's population. These advancements in network infrastructure are crucial for improving the quality of PTT services, making them highly effective for critical communication needs in industries such as public safety, logistics, and utilities. The rise in mobile devices with PTT features and the growth of cloud-based PTT services also support market expansion by offering scalable and flexible communication solutions for businesses. For instance, Motorola Solutions provides cloud-based PTT services for various industries, enabling seamless communication among field workers. Additionally, greater emphasis on worker safety in sectors like construction and manufacturing is further boosting PTT adoption, as it allows for real-time communication in hazardous situations.
The integration of PTT with other digital technologies, like dispatch software and geolocation services, also enhances operational efficiency. Furthermore, the shift to remote and hybrid work environments following the pandemic has increased the adoption of PTT solutions, as companies look for reliable ways to keep their dispersed workforce connected.
Push to Talk (PTT) Market Dynamics
Drivers
-
Real-time communication enhances safety in hazardous environments like construction.
-
Digital Solution Integration Combines with software like dispatch systems to improve operational efficiency.
-
Adoption of LTE and 5G Improves PTT service quality and reliability, ideal for critical communications.
The adoption of LTE and 5G networks is a key driver for the push-to-talk (PTT) market, significantly improving service quality and reliability, making PTT ideal for critical communications. PTT depends on fast, seamless voice transmission, which benefits from the advanced capabilities of LTE and 5G networks. LTE provides broader coverage, lower latency, and higher data speeds than older technologies, ensuring stable and responsive PTT communications—vital for industries like public safety, logistics, and construction, where instant communication is essential in demanding environments.
The advent of 5G further enhances PTT services, offering even lower latency, greater bandwidth, and faster data transmission, which supports nearly instantaneous communication. This is especially crucial for mission-critical operations, such as emergency response and disaster management, where time is of the essence. Additionally, 5G’s expanded capacity allows for more simultaneous connections, enabling efficient team coordination without network congestion—a critical feature for sectors like utilities and large-scale logistics.
In conclusion, LTE and 5G adoption significantly enhances the quality, reliability, and functionality of Push to Talk services, making them highly effective for critical communications. These advancements drive the increased use of PTT in industries that prioritize reliable, instant communication to improve safety and operational efficiency.
Restraints
-
Dependence on mobile networks can lead to service interruptions in remote or low-coverage areas.
-
Limited compatibility with older devices can hinder adoption among companies with existing communication systems.
-
Increasing risks of data breaches and cyber threats may deter organizations from adopting PTT solutions.
Increasing risks of data breaches and cyber threats pose significant challenges to the adoption of Push to Talk (PTT) solutions. As organizations depend more on digital communication platforms, cybersecurity concerns take center stage. PTT systems often manage sensitive information, such as location data and operational communications, making them attractive targets for cyberattacks. Organizations may be reluctant to implement PTT solutions due to fears that data breaches could compromise confidential information or disrupt critical operations. A successful cyberattack can result in substantial financial losses, reputational harm, and legal consequences, particularly in industries like healthcare, finance, and public safety, where safeguarding data is essential.
Furthermore, as the PTT market advances and integrates with other digital solutions (like IoT and AR), the complexity of the security landscape increases. This interconnectedness can introduce vulnerabilities that cybercriminals could exploit. As a result, companies might lean towards established, traditional communication methods instead of newer PTT solutions that are perceived as more vulnerable.
To counter these concerns, PTT providers need to emphasize robust security measures, including encryption, secure access controls, and regular software updates, to foster trust among potential users. By showcasing a strong commitment to cybersecurity, providers can mitigate organizations' fears and promote wider adoption of PTT technologies.
Push to Talk (PTT) Market Segment Analysis
By Offering
In 2023, The hardware segment dominated the market and accounted for a revenue share of more than 45.7%. PTT devices that depend on hardware have established a strong and enduring presence in the market, offering a reliable and well-recognized communication solution for sectors such as public safety, construction, and transportation. These devices are engineered for resilience and tailored to meet specific operational needs, ensuring they remain durable in tough environments and dependable for mission-critical operations. Additionally, the hardware segment has continually progressed by incorporating advanced features such as extended battery life, increased durability, and enhanced security.
The solution segment is expected to experience substantial growth throughout the forecast period. This segment is rapidly expanding due to its flexibility and advanced capabilities. PTT solutions offer a diverse range of features that cater to the evolving requirements of businesses and organizations. They can be implemented on various devices, including smartphones, tablets, and computers, providing greater versatility in communication.
By Network
The Land Mobile Radio (LMR) segment dominated the market in 2023, capturing over 58.7% of the revenue share. This leadership can be attributed to LMR's long-established reliability and proven effectiveness. LMR systems have become essential for mission-critical communication in sectors such as public safety, utilities, and transportation. Their primary advantage is the ability to provide seamless, wide-area coverage, enabling first responders and essential personnel to communicate efficiently, even in remote or disaster-impacted areas. The reliability of LMR technology during emergencies has solidified its position as the preferred choice for many critical industries.
The cellular or Push to Talk (PoC) segment is expected to experience substantial growth throughout the forecast period. This segment is expanding rapidly due to the convergence of mobile communication technology and the increasing demand for immediate and efficient communication. PoC leverages cellular networks, offering a wider and more flexible coverage area compared to traditional LMR systems. This allows various sectors, including logistics, construction, and field services, to maintain real-time communication without geographic limitations. Additionally, the versatility and cost-effectiveness of cellular-based PTT solutions make them an attractive choice for small and medium-sized enterprises seeking reliable communication tools without significant infrastructure investments.
By Vertical
The public safety and security segment dominated the market in 2023, representing over 26.8% of total revenue. Public safety and security-related organizations, such as police, fire departments, emergency responders, and relevant others highly rely on efficient PTT systems to coordinate actions in emergencies and crises. Nowadays, these systems have transformed significantly and offer such features as real-time location, multimedia messaging, and interoperability, which allow seamless interaction between organizations and jurisdictions. These organizations have a critical need for reliable and rapid communication in high-stress conditions, coupled with continuous improvements in technological capabilities that ensure better PTT features. At the same time, compliance with numerous rigorous regulations on equipment and practice also serves to ensure that PTT systems will remain at the leading position.
The government and defense segment is expected to achieve the highest compound annual growth rate (CAGR) during the forecast period. As national security and confidentiality are critical, these organizations are increasingly utilizing state-of-the-art push-to-talk solutions to meet their requirements. PTT technology may deliver military personnel and government officials with a dependable means of communication in real-time, allowing them to quickly coordinate and pass on critical information to one another during combat or disaster scenarios and even in everyday operations. The fact that PTT systems can function in remote or challenging locations is another element spurring their acceptance. The PTT market is witnessing an increase in the number of methods available to safeguard sensitive government and defense sector communications as concerns about cybersecurity and data integrity grow.
By Enterprise Size
In 2023, the large enterprises segment dominated the market accounting for over 62.6% of total revenue. Large organizations often operate across vast geographical areas or multiple locations. Therefore, such organizations require seamless and immediate communication to enhance productivity. As a result, large enterprises have adopted Push-to-Talk solutions to connect the dispersed workforce, facilitating real-time coordination and promoting faster decision-making. Second, large enterprises usually employ over 1000 people; thus they need customized PTT systems that can integrate with the existing infrastructure. As a result, the PTT systems enable large enterprises to communicate smoothly between different departments and teams, thus optimizing their operations. Third, PTT systems have enhanced the safety protocols of large enterprises by ensuring that employees can request help without calling their seniors remotely. Therefore, large enterprises have become the main contributors to the market growth. They depend on communication solutions to maintain their operational efficiency and sustain their competitive advantage in the market.
The Small & Medium Enterprises SMEs segment is expected to grow significantly during the forecast period. While they account for a small market share, SMEs depend on PTT solutions to enhance their operations and communications. They always need a cost-effective and efficient communication system to maximize their probability and respond to customers’ needs aggressively. Since the PTT technology has helped these businesses connect instantly, the customers’ needs and have affordable and efficient team communication. Also, PTT systems have been designed to be user-friendly and span. SMEs have also varied business models and are located in different environments where they are affected by different communication challenges. As such, SMEs are increasingly becoming a favorite among PTT technology providers because of their varying needs. PTT solutions can also be programmed and expanded to accommodate increasing growth as SMEs establish more departments or business units.
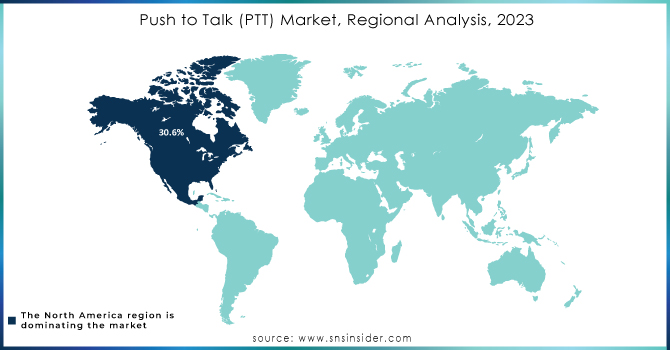
Regional Analysis
In 2023, North America led the market with more than 30.6% of the total revenue. The main factor is that there are many key players and technology innovators in PTT solutions in the area, and it contributes to the development of these systems. Besides, the extensive network of public safety and law enforcement agencies and strong industry and transportation systems demand effective communication tools. Notably, the focus on a safe and fast response to emergencies and secure communication for first responders and government entities promoted significant growth of the PTT market in the region. Outside North America, the Asia Pacific is expected to generate the highest CAGR over the foreclosure conclusion.
Asia Pacific has recorded substantial market growth since the most essential factor for the market is the rapid expansion of commercial and industrial activities. Both domains have an elevated demand for fast and effective communications associated with on-field work. As a result, such industries as construction, manufacturing, and logistics have started to implement Push to Talk solutions to improve their performance and provide their employees with additional safety in their workplaces.
Do You Need any Customization Research on Push to Tal Market - Enquire Now
Key Players
The major key players are
-
Motorola Solutions - (MOTO PTT, WAVE)
-
Zello - (Zello Push-to-Talk, Zello Work)
-
Hytera - (Hytera Push-to-Talk, Hytera DMR)
-
Tait Communications - (Tait TETRA, Tait DMR)
-
Telstra - (Telstra Team Talk, Telstra Connected Workforce)
-
Verizon - (Verizon Push-to-Talk, Verizon Connect)
-
AT&T - (AT&T Push-to-Talk, AT&T FirstNet)
-
Qualcomm - (Qualcomm Snapdragon PTT, Qualcomm 3GPP)
-
Zebra Technologies - (Zebra TC75, Zebra MC9190)
-
Airbus - (Airbus Tetra, Airbus Tactil)
-
Iridium Communications - (Iridium Push-to-Talk, Iridium Certus)
-
ServiceMax - (ServiceMax Field Service Management, ServiceMax Mobile)
-
Simoco Wireless Solutions - (Simoco TETRA, Simoco DMR)
-
GroupTalk - (GroupTalk PTT, GroupTalk Messaging)
-
Orion Labs - (Orion PTT, Orion Messenger)
-
Voxer - (Voxer Push-to-Talk, Voxer Business)
-
Procore Technologies - (Procore Field, Procore Push-to-Talk)
-
VoxerNet LLC - (VoxerNet PTT, VoxerNet Messaging)
-
International Push to Talk Ltd - (iPTT, iPTT Enterprise)
-
Enterprise Secure Chat - (ESC PTT, ESC Messaging)
Recent Developments
In May 2023, Qualcomm Technologies, Inc., a subsidiary of Qualcomm, acquired Autotalks. This acquisition aims to integrate Autotalks' standalone safety solutions into Qualcomm Technologies' growing Snapdragon Digital Chassis product line.
| Report Attributes | Details |
| Market Size in 2024 | USD 32.84 billion |
| Market Size by 2032 | USD 84.04 billion |
| CAGR | CAGR of 11.02 % From 2024 to 2032 |
| Base Year | 2023 |
| Forecast Period | 2024-2032 |
| Historical Data | 2020-2022 |
| Report Scope & Coverage | Market Size, Segments Analysis, Competitive Landscape, Regional Analysis, DROC & SWOT Analysis, Forecast Outlook |
| Key Segments | • By Offering(Hardware, Solution,Services) • By Network(Cellular or PoC, Land Mobile Radio (LMR)) • By Vertical(Public Safety & Security, Government & Defense, Transportation & Logistics, Travel & Hospitality, Energy & Utility, Others) |
| Regional Analysis/Coverage | North America (US, Canada, Mexico), Europe (Eastern Europe [Poland, Romania, Hungary, Turkey, Rest of Eastern Europe] Western Europe] Germany, France, UK, Italy, Spain, Netherlands, Switzerland, Austria, Rest of Western Europe]), Asia Pacific (China, India, Japan, South Korea, Vietnam, Singapore, Australia, Rest of Asia Pacific), Middle East & Africa (Middle East [UAE, Egypt, Saudi Arabia, Qatar, Rest of Middle East], Africa [Nigeria, South Africa, Rest of Africa], Latin America (Brazil, Argentina, Colombia Rest of Latin America) |
| Company Profiles | Motorola Solutions, Zello, Hytera, Tait Communications, Telstra, Verizon, AT&T, Qualcomm, Zebra Technologies, Airbus, Iridium Communications, ServiceMax, Simoco Wireless Solutions, GroupTalk, Orion Labs, Voxer, Procore Technologies, VoxerNet LLC, International Push to Talk Ltd, Enterprise Secure Chat |
| Key Drivers | •Real-time communication enhances safety in hazardous environments like construction. •Digital Solution Integration Combines with software like dispatch systems to improve operational efficiency. •Adoption of LTE and 5G Improves PTT service quality and reliability, ideal for critical communications. |
| Market Restraints | •Dependence on mobile networks can lead to service interruptions in remote or low-coverage areas. •Limited compatibility with older devices can hinder adoption among companies with existing communication systems. •Increasing risks of data breaches and cyber threats may deter organizations from adopting PTT solutions. |
Frequently Asked Questions
- Growing Organizational Adoption of Wireless Devices, Network Devices, and Software to Support Market Growth
- Increased demand for driver safety
North American region will continue to dominate the Push to Talk Market
The market is expected to grow to USD 65.5 billion by the forecast period of 2030.
Yes, you can ask for the customization as pas per your business requirement.
The CAGR of the Push-to-Talk Market for the forecast period 2022-2030 is 9.67 %.
Get in Touch
