Quaternary Ammonium Compounds Market Report Scope & Overview:
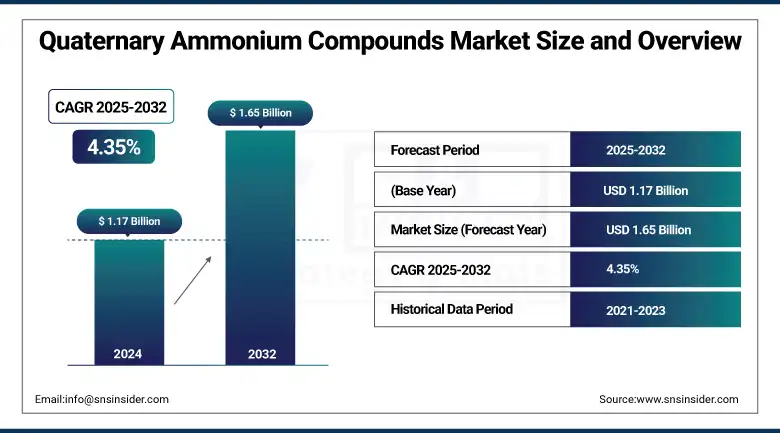
The Quaternary Ammonium Compounds Market size was valued at USD 1.17 billion in 2024 and is expected to reach USD 1.65 billion by 2032, growing at a CAGR of 4.35% over the forecast period of 2025-2032.
Quaternary ammonium compounds market growth is driven by the growing requirement for hygiene products, especially quaternary ammonium disinfectants in healthcare and residential sectors. Increased use of surface disinfectant / personal care preservatives and bio-based quaternary ammonium salts are factors driving the quaternary ammonium compounds market growth. One of the important quaternary ammonium compounds market trends is the transition to sustainable, multipurpose surfactants. Major quaternary ammonium compounds producers, including Evonik, have since 2024 started building a new special amines plant in Nanjing to increase their capacity.
To Get more information On Quaternary Ammonium Compounds Market - Request Free Sample Report
According to the U.S. EPA, approximately 10,000 quaternary ammonium-based formulations are currently in use. These are listed by the CDC as being critical for disinfecting in noncritical healthcare settings. These are the developments that have been bolstering the quaternary ammonium compounds market size and share across the world. The development of green anti-static agents and wood preservatives is another factor bolstering the quaternary ammonium compounds market growth, with enterprises responding to regulatory and consumer preferences in a number of end-use sectors.
Quaternary Ammonium Compounds Market Drivers
-
Surging demand for multifunctional bio-based quaternary ammonium surfactants across end-use industries
Throughout healthcare, personal care, and water treatment, there is a clear trend towards biodegradable, more versatile quaternary ammonium compounds (QACs) that offer diverse touch points, such as disinfection efficacy plus conditioning, or corrosion inhibition. R&D investment by leading quaternary ammonium compounds companies in bio-based cationic surfactants to address consumer and regulatory pressures towards sustainable products will impact the quaternary ammonium compounds market growth. For example, Evonik started construction of a new specialty amines plant in Nanjing in November 2024, highlighting the expansion of capacities for high-end cationic solutions. Meanwhile, the U.S. Environmental Protection Agency has more than 4,000 disinfectant products on its List N, including many that use quaternary ammonium salts – a testament to quaternary-based, multi-function use-case expansion.
-
Rapid growth in e-commerce channels enabling wider distribution of specialty disinfectants
Rapid uptake of e-procurement by health care providers, hospitality services, and end users is transforming disinfectant and preservative distribution. Through the widened online platforms, buyers can directly access an extensive catalogue of the quaternary ammonium salts market, from concentrated antimicrobial concentrates to ready-to-use surface disinfectants, which is contributing to shorter lead times as well as customization feature. And, on the U.S. EPA’s online List N, searches for quaternary ammonium-based products, which could see an increase of 30% this year over last, since 2023. This is one of the most important trends that form the quaternary ammonium compounds market analysis, as it makes faster market penetration in areas with a poorly developed traditional distribution system.
Quaternary Ammonium Compounds Market Restraints
-
Escalating regulatory scrutiny over antimicrobial resistance and occupational health concerns
Studies have demonstrated that extended exposure to quaternary ammonium compounds results in microbial resistance and occupational asthma in people involved in cleaning. A 2023 Environmental Science & Technology article emphasizes that chronic exposure can induce respiratory symptoms and potentially cultivate resistant strains, leading regulatory agencies such as the U.S. EPA and European Chemicals Agency to increase testing and labeling requirements. These increased safety measures elongate the timeline for the approval of new quaternary ammonium salts, impeding the quaternary ammonium compounds market growth and obliging companies to commit funds to acquire complete toxicological and environmental fate data.
Quaternary Ammonium Compounds Market Segmentation Analysis
By Product
Didecyldimethyl ammonium chloride (DDAC) dominated, and its C12 homolog sub-variant contributed 39.1% of the market share in 2024. Its dominance is due to its wide-spectrum effectiveness and its formulation stability, important for healthcare and food processing applications. DDAC-based products represent approximately 39% of all quaternary ammonium disinfectants registered under the List N registry of the U.S. Environmental Protection Agency, and their popularity is evident in the use of many infection-control protocols. Leading providers of QACs, including Stepan and Lonza, focus on DDAC, in which the CDC recommended that EPA-registered QACs be used for routine noncritical surface disinfection.
Benzalkonium chloride is expected to be the fastest-growing region in the forecast period of 2025 to 2032, with a CAGR of 5.59%. It's growing quickly because consumers want the convenience of the ready-to-use, ready-to-use spray and wipe disinfectant in the healthcare environment and at home. According to CDC recommendations, benzalkonium chloride is effective against the flu, as well as other common bacterial pathogens on noncritical surfaces. U.S. EPA statistics also indicate that there are more disinfectants registered containing benzalkonium than there were last year, indicating even greater formulation innovation by quaternary ammonium compounds suppliers to address updated hygiene demands.
By Application
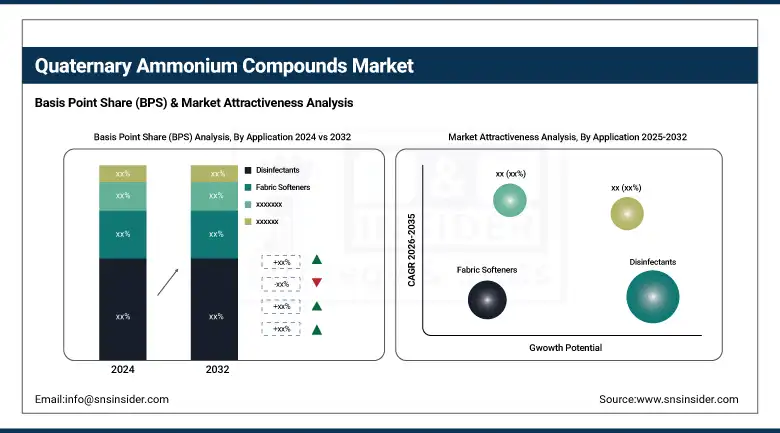
Disinfectants held 32.7% of the market in 2024, driven by hospital-grade surface sprays and wipes. This leadership has been driven by strict health care hygiene requirements, prescribing lower-level disinfectants for floors, instruments, and patient care surfaces. The U.S. Centers for Disease Control and Prevention (CDC) states that EPA-registered quaternary ammonium disinfectants are essential for preventing the risk of infection in medical facilities. In return, top quaternary ammonium compounds companies are ramping up the ready-to-use disinfectant formulations to meet increased demand due to the EPA List N expansion of over 500 new listings in 2024.
Surfactants emerged as the fastest-growing with a 5.24% CAGR through the forecast period of 2025 to 2032, supported by demand for multifunctional cationic conditioning agents. The increase is an offshoot of a continued trend toward bringing cleaning effectiveness together with fabric softening and anti-static properties in laundry and textile applications. According to EPA List N data, the registrations of surfactants for use with multifunctional quaternary ammonium salts have seen a 20% growth since 2022. Furthermore, textile agencies are witnessing increased usage, with sustainable cationic surfactants substituting conventional quats; surfactants are therefore the fastest growing application segment in the quaternary ammonium compounds market.
By Distribution Channel
Offline sales accounted for the largest market share of 68.4% in 2024 based on existing distribution at janitorial suppliers and chemical distributors. A lot of institutions also like getting big buckets and jugs of disinfectants and preservatives from established offline connections for the guarantee of supply safety and technical support. As indicated by U.S. EPA List N usage data, traditional distributors make up ~70% of high-volume institutional tenders and orders. Quaternary ammonium compounds market participants are focusing on channel partnership and distributor sales force training, maintaining offline prevalence on the back of growing online procurement.
Online was the fastest-growing channel with a 4.64% CAGR in the forecast period of 2025 to 2032, driven by direct-to-end-user sales of niche disinfectants and preservatives. The move to e-commerce mirrors clinicians and small-business operators clamouring for quick access to specialty formulations, including ready-to-use wipes and concentrated quaternary ammonium salts. According to data from the U.S. EPA’s List N online tool, digital queries for products with quaternary ammonium active ingredients are up 30% year over year. Key quaternary ammonium compounds manufacturers have fully utilized their websites for easy ordering, assisting with custom formulations, and boosting online sales growth.
Quaternary Ammonium Compounds Market Regional Outlook
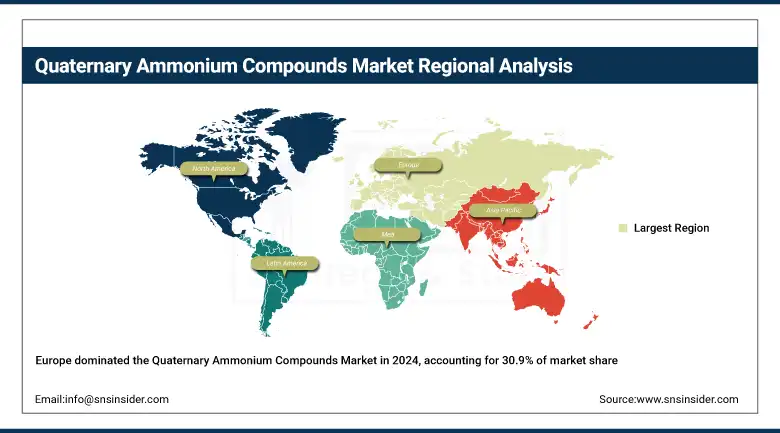
In 2024, Europe was the leading region, with a share of 30.9%, followed by North America. The European Chemicals Agency's Biocidal Products Regulation has approved more than 1,000 active quaternary ammonium compounds, with stringent safety and efficacy criteria, leaving the market with confidence. Additionally, Eurostat cites that 83.2% of Europeans reside within a 15-minute drive from a hospital, which underscores the concentration of institutional demand that is present for surface disinfectants and personal care preservatives. With 96 NUTS-3 regions in Germany having full coverage of hospital access, such as Clariant and Arkema, leading quaternary ammonium compounds producers of ready-to-use formulations are engaging in local production to meet strict EU hygiene requirements.
Get Customized Report as per Your Business Requirement - Enquiry Now
Asia Pacific emerged as the fastest-growing region with a 23.7% share in the forecast period of 2025 to 2032. In China, quaternary ammonium disinfectants received emergency listing under the viable WS 628-2018, due to the sound government procurement policies, which expedited domestic supply to the market. India’s National Centre for Disease Control’s guidelines for infection control, released in 2024, impose low-level surface disinfection with quaternary ammonium compounds as a routine, augmenting uptake in public and private healthcare institutions. In addition, there are WHO Western Pacific programs that are promoting IPC programs in 37 countries, supporting demand for biodegradable cationic surfactants in local sanitation programs
In 2024, North America had a share of 28.6%, second only to Europe’s 30.9%. The U.S. is the dominating country with a market value of USD 233.19 million, accounting for a market share of 69.4% in 2024. In the US, there are more than 10,000 quaternary ammonium disinfectants on EPA’s List N, which means they are in wide use in hospitals, food processing, and public venues. Canada’s new Biocides Regulations (part of the Food & Drug Act and due to go into effect May 31, 2025) will make it easier to approve disinfectants and sanitizers, fast-tracking licensure of quaternary ammonium compounds. The U.S. Centers for Disease Control and Prevention still recommends the use of EPA-registered quaternary ammonium compounds for noncritical surface disinfection, solidifying strong market potential in North America.
Quaternary Ammonium Compounds Market Companies are:
The major anhydrous hydrogen fluoride market competitors include Honeywell International Inc., Solvay S.A., Linde plc, Arkema S.A., Lanxess AG, Navin Fluorine International Limited (NFIL), Daikin Industries, Ltd., Mexichem S.A.B. de C.V. (Orbia/Koura), GFL Limited (Gujarat Fluorochemicals Ltd.), and Foosung Co., Ltd.
Recent Developments
-
In January 2025, ECHA released a report detailing short-chain quaternary ammonium compounds’ uses in polymers, cleaning products, assessing reproductive and neurotoxicity risks, environmental persistence, and recommending harmonized CLP classification and occupational exposure limits.
-
In November 2024, the USGS published data showing that effluents from three wastewater treatment plants contained twelve quaternary ammonium compounds at concentrations from 2.3 to 1,630 ng/L, with 49% benzalkonium, 38% dialkyldimethyl, 9% ethylbenzylalkyldimethyl, and 4% benzethonium.
-
In May 2023, A Down-To-Earth article revealed that disinfectants widely used quaternary ammonium compounds without adequate health screening, linking sustained exposure to developmental and reproductive toxicity and antimicrobial resistance, and urging safer cleaning alternatives.
| Report Attributes | Details |
|---|---|
| Market Size in 2024 | USD 1.17 billion |
| Market Size by 2032 | USD 1.65 billion |
| CAGR | CAGR of 4.35% From 2025 to 2032 |
| Base Year | 2024 |
| Forecast Period | 2025-2032 |
| Historical Data | 2021-2023 |
| Report Scope & Coverage | Market Size, Segments Analysis, Competitive Landscape, Regional Analysis, DROC & SWOT Analysis, Forecast Outlook |
| Key Segments | •By Product (Alkyl Trimethyl Ammonium Chloride (ATAC), Benzalkonium Chloride (BAC), Didecyldimethyl Ammonium Chloride (DDAC), Others) •By Application (Disinfectants, Fabric Softeners, Wood Preservatives, Surfactants, Anti-static Agents, Others) •By Distribution Channel (Online, Offline) |
| Regional Analysis/Coverage | North America (US, Canada, Mexico), Europe (Germany, France, UK, Italy, Spain, Poland, Turkey, Rest of Europe), Asia Pacific (China, India, Japan, South Korea, Singapore, Australia, Rest of Asia Pacific), Middle East & Africa (UAE, Saudi Arabia, Qatar, South Africa, Rest of Middle East & Africa), Latin America (Brazil, Argentina, Rest of Latin America) |
| Company Profiles | BASF SE, Evonik Industries AG, DuPont de Nemours, Inc., Lonza Group Ltd., Stepan Company, Kao Corporation, Huntsman Corporation, Arkema S.A., Clariant AG, and Nouryon |
Frequently Asked Questions
Europe led with 30.9% share in 2024, supported by stringent Biocidal Products Regulation driving Quaternary Ammonium Compounds Market adoption.
Evonik’s investment in a specialty amines facility in Nanjing exemplifies Quaternary Ammonium Compounds Companies’ efforts to boost production capacity.
The Quaternary Ammonium Compounds Market benefits from nearly 10,000 registered quaternary ammonium–based formulations listed on the U.S. EPA’s database.
The Quaternary Ammonium Compounds Market is expected to grow at a CAGR of 4.35% from 2025 to 2032, driven by healthcare and residential hygiene trends.
The Quaternary Ammonium Compounds Market was valued at USD 1.17 billion in 2024, reflecting robust demand for disinfectants and multifunctional surfactants.
Get in Touch
