image

Retail Colocation Market Report Scope & Overview:

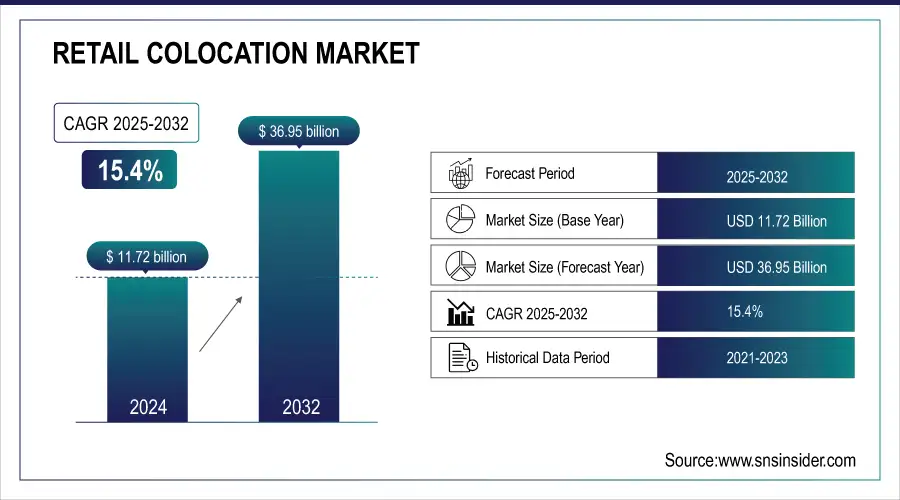
The Retail Colocation Market Size was valued at USD 11.72 billion in 2024 and is expected to reach USD 36.95 billion by 2032 and grow at a CAGR of 15.4% over the forecast period 2025-2032.

The retail colocation market is witnessing robust growth, propelled by exponential growth in IT infrastructure, data, and connectivity demands, four reasons from the pandemic to supply chain breakdowns over the past two years have necessitated enterprises across verticals to migrate away from on-premise data centers and to third-party colocation providers for efficiency, cost-effectiveness, and availability of high-speed, performant networks. Retail colocation services allow SMEs & large enterprises to lease physically smaller areas, configure power flexibly, and deploy quickly. Fueling this global market is the continued expansion of the cloud, edge deployments, and interconnection services, making retail colocation an indispensable part of the global digital infrastructure ecosystem.

As per the research, in CBRE (Commercial real estate Service) supply grew another 6,922.6 MW, a 34% annual increase, in the primary data center markets. The 6,350 MW under construction at the end of 2024 was more than two times the 3,077.8 MW at year-end 2023. High demand for space combined with longer lead times caused by power limits and supply chain bottlenecks to driving this surge.

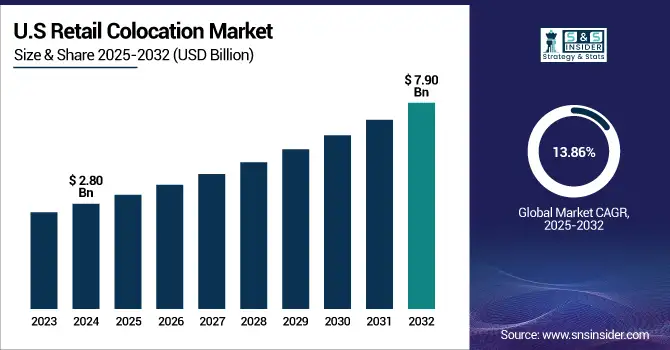
The U.S. retail colocation market size was USD 2.80 billion in 2024 and is expected to reach USD 7.90 billion by 2032, growing at a CAGR of 13.86% over the forecast period of 2025 to 2032. Due to its superior Digital Infrastructure, higher concentration of Tech Giants, along with the highest demand for Cloud and AI services. The biggest data center hubs include Northern Virginia, Dallas, and Silicon Valley, where reliable connectivity and power are present. Domestic semiconductor and data center development is also being bolstered by government initiatives such as the CHIPS Act.

Market Dynamics

Key Drivers:

  • Surging AI and Cloud Computing Needs in Enterprises Drive Retail Colocation Market Growth Across Key Global Data Center Hubs

The market is significantly driven by the increasing demand for cloud services and artificial intelligence (AI) capabilities among enterprises. The demand for reliable, scalable, and secure data center infrastructure is on the rise as businesses accelerate digital transformation. Retail colocation facilities provide cost cost-effective alternative to building customers' data centers, having immediate access to power, connectivity, and cooling infrastructure. The major part of this expansion is driven by hyperscale and cloud service providers that are launching additional colocation sites to satisfy the increasing AI workloads. This is further exacerbated by vacancies as low as 2.8% and rising rents for new centers, displaying the growing demand for colocation space. Colocation solutions are becoming increasingly essential to enabling enterprise growth and innovation as AI models become larger and more complex, and the data used to train them grows in volume.

Restraints:

  • High Operational and Energy Costs of Colocation Facilities Limit Market Expansion in Price-Sensitive and Power-Constrained Regions

Hampering the growth of the retail colocation industry is the high operational and energy costs associated with maintaining advanced colocation infrastructure. Data centers require tremendous amounts of electricity to operate and cool server hardware, particularly in areas with antiquated grid infrastructure or where renewable power is less accessible. Furthermore, rising power tariffs and strict carbon rules in some jurisdictions make things even more expensive and influence pricing models around colocation. Suited for industries or markets where cost competitiveness would be the line in the sand, these factors represent massive barriers to entry. Such costs may be absorbed by large cloud providers who benefit from scale, but for retail colocation operators serving an array of tenants over a shared infrastructure, performance comes at a price, and that price can be challenging to balance against cost. This will be an ongoing challenge for the industry as energy prices keep changing.

Opportunities:

  • Edge Computing and IoT Expansion Create New Growth Avenues for Retail Colocation Providers in Emerging and Urban Markets Worldwide

The rise of edge computing and Internet of Things (IoT) applications presents a major opportunity for the retail colocation market. As data generation moves closer to the user and device, the need for low-latency colocation at the Edge is skyrocketing. This opens up huge possibilities for retail colocation providers to create micro data centers in suburban and remote locations. Local data processing is needed for smart city projects, autonomous vehicles, and 5G rollouts, which drive this expansion. To help support this type of distributed computing, retail colocation facilities that offer modular, scalable, and high-speed connections are quickly becoming a necessity. While the edge computing environment matures, retail colocation providers will gain from serving a range of use cases in telecom, healthcare, manufacturing, and transportation over the years.

Challenges:

  • Power Supply Constraints and Delayed Infrastructure Timelines Impact Serious Challenges for New Retail Colocation Facility Deployment

The retail colocation market is experiencing a growing delay in facility deployment due to power supply constraints and infrastructure bottlenecks. With a growing demand for colocation services, and a new datacenter being set up online, with the services being provided up is a challenge. The ability for power procurement is frequently challenged by challenges with the grid from the utility, allowing enough time for permits and reaching simple or complex regulatory frameworks to align within the background, especially in cities or power-constrained areas.

According to a February 2025 CBRE report, the amount of colocation capacity under construction more than doubled from 3,077.8 MW in 2023 to 6,350 MW by the end of 2024, highlighting the gap between planned capacity and actual availability.

These prolonged timelines not only impact service delivery and lead to a backlog of enterprise clients who want to ramp up digital infrastructure quickly. These challenges can hinder the market's ability to scale with enterprise and cloud adoption needs without a well-planned augmentation of power provisioning and permitting processes.

Segments Analysis

By End-user

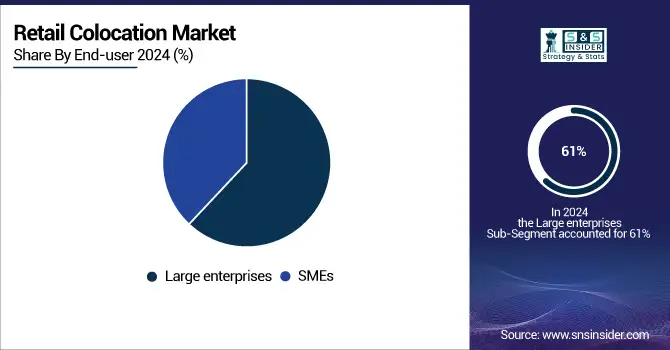
In 2024, large enterprises accounted for 61% of the retail colocation market share due to their massive IT workloads, data needs, and global presence. This increase is due to digital acceleration, economic scaling of resources, and other rising demands for safety against cyberattacks. Edge-ready colocation solutions, such as those from startups EdgeConneX and Cyxtera, are providing SMEs with enterprise-grade infrastructure without the large upfront capital investment previously required.

Small and medium-sized enterprises (SMEs) are witnessing the fastest growth in the retail colocation market, with a CAGR of 16.10%. Edge-ready colocation solutions hitting the market: Startups, including EdgeConneX and Cyxtera, are launching edge-ready colocation solutions providing much-needed access for SMEs that hope to configure enterprise-grade infrastructure with minimal CAPEX.

By Industry Application

In 2024, the IT and telecom sector led retail colocation usage with a 37% market share, fueled by explosive data growth and demand for low-latency services. Such as NTT Ltd and Colt DCS, built out high-density, cloud-adjacent colocation facilities for 5G rollouts, AI workloads, and content delivery, making colocation essential for both core telecom infrastructure and for agile IT development.

The healthcare segment is growing fastest, with a CAGR of 16.5%, as hospitals and medical providers digitize operations and adopt telehealth. Firms such as Iron Mountain and STACK Infrastructure unveiled new HIPAA-compliant colo sites to shoulder the burden of health records and AI-run diagnostics safely. The segment expansion mirrors the increased need by real-time care providers for secure, scalable data environments.

Regional Analysis

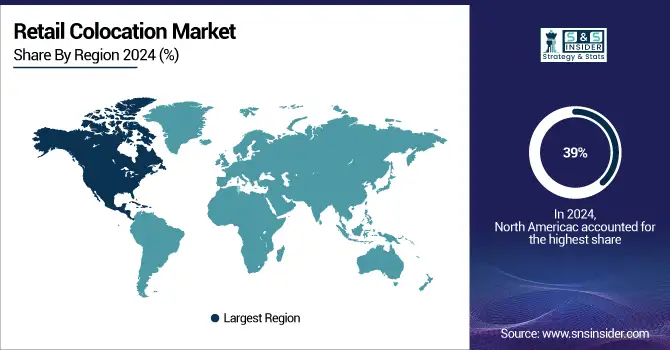
In 2024, North America held an estimated 39% market share of the global retail colocation market, making it the dominant region. High demand for cloud services, a dense internet infrastructure, and tons of digital transformation of retail businesses were supporting factors for making North America a leading region in this cloud marketplace.

North America's top data center markets experienced a 70% annual increase in construction supply, reaching 3.9 gigawatts. This growth was propelled by the expansion of AI and cloud computing by Big Tech. More than 500 megawatts of new data center capacity were brought online in the first half of 2024, nearly all of it in the same sub-markets that house existing Silicon Valley data center capacity. Vacancy rates fell to a historic low of 2.8%, and prices for newer centers increased due to the infrastructure built into them.

In 2024, the Asia-Pacific region was the fastest-growing in the retail colocation market, with an estimated CAGR of 17.1%. Asia-Pacific markets drive colocation demand due to rapid digitalization, expanding e-commerce, government smart city initiatives, and growing cloud adoption. Within the Asia-Pacific region, China is a year ahead of the UK in the retail colocation business analysis. This is due to a huge increase in internet users, a fast-growing digital infrastructure, and full support of data centers by the government.

Europe was the largest market for retail colocation in 2024, as a result of the increasing need for robust data privacy regulations, digital transformation, and growing hybrid IT infrastructures. Colocation growth in Europe was driven by GDPR compliance, enterprise cloud adoption, strong connectivity, and demand for secure, scalable IT infrastructure. The UK has been the regional leader in terms of data centre maturity, bolstered by its more developed financial sector and connectivity infrastructure. Colocation demand was also amplified by the continued global business hub positioning of London.

In 2024, the MEA and Latin America showed steady growth in the retail colocation market analysis, driven by digital transformation, cloud adoption, and rising e-commerce. The latest smart city initiatives and the investments in the data center by the UAE and Saudi Arabia put them at the forefront in MEA. Brazil leads the way in Latin America, with its strong backbone of telecom infrastructure, large base of digital consumers, and wealth of foreign investment. In both cases, supportive government policies coupled with demand from businesses modernizing operations towards a scalable, secure IT infrastructure were key enablers.

Key Players

The retail colocation market companies are AT&T Inc., China Telecom, Cogent Communications, Contegix, CoreSite Realty Corporation, Cyxtera Technologies, Inc., Digital Realty Trust, Inc., Global Switch, NTT Communications Corporation, Verizon and others.

Recent Trends

  • In March 2025, Cogent repurposed 55 former Sprint sites into edge data centers, each supporting approximately 40 racks and 350kW of power. This expansion enhances Cogent's colocation footprint, catering to the growing demand for edge computing solutions.

  • In October 2023, Seceon partnered with CoreSite to leverage its Boston data center for hosting its AI/ML-driven cybersecurity platform. CoreSite's scalable infrastructure supports Seceon's need for high-density compute environments, ensuring real-time threat detection and mitigation.

Retail Colocation Market Report Scope:

Report Attributes Details
Market Size in 2024 USD 11.72 Billion 
Market Size by 2032 USD 36.95 Billion 
CAGR CAGR of 15.4% From 2025 to 2032
Base Year 2024
Forecast Period 2025-2032
Historical Data 2021-2023
Report Scope & Coverage Market Size, Segments Analysis, Competitive Landscape, Regional Analysis, DROC & SWOT Analysis, Forecast Outlook
Key Segments • By End-user (SMEs, and Large Enterprises)
• By Industry Application (IT and Telecom, Healthcare, Retail and E-commerce, Energy and Utility, and Others)
Regional Analysis/Coverage North America (US, Canada, Mexico), Europe (Germany, France, UK, Italy, Spain, Poland, Turkey, Rest of Europe), Asia Pacific (China, India, Japan, South Korea, Singapore, Australia, Rest of Asia Pacific), Middle East & Africa (UAE, Saudi Arabia, Qatar, South Africa, Rest of Middle East & Africa), Latin America (Brazil, Argentina, Rest of Latin America)
Company Profiles AT&T Inc., China Telecom, Cogent Communications, Contegix, CoreSite Realty Corporation, Cyxtera Technologies, Inc., Digital Realty Trust, Inc., Global Switch, NTT Communications Corporation, Verizon, and others.

Frequently Asked Questions

Ans: The Retail Colocation Market is expected to grow at a CAGR of 15.4% during 2025-2032.

Ans: The Retail Colocation Market size was USD 11.72 billion in 2024 and is expected to reach USD 36.95 billion by 2032.

Ans: The major growth factor of the Retail Colocation Market is the rising demand for scalable, secure, and cost-effective data center solutions across industries.

Ans: The IT and telecom segment dominated the Retail Colocation Market.

Ans: North America dominated the Retail Colocation Market in 2024.

Table of Contents

1. Introduction

1.1 Market Definition

1.2 Scope (Inclusion and Exclusions)

1.3 Research Assumptions

2. Executive Summary

2.1 Market Overview

2.2 Regional Synopsis

2.3 Competitive Summary

3. Research Methodology

3.1 Top-Down Approach

3.2 Bottom-up Approach

3.3. Data Validation

3.4 Primary Interviews

4. Market Dynamics Impact Analysis

4.1 Market Driving Factors Analysis

4.1.2 Drivers

4.1.2 Restraints

4.1.3 Opportunities

4.1.4 Challenges

4.2 PESTLE Analysis

4.3 Porter’s Five Forces Model

5. Statistical Insights and Trends Reporting

5.1 Colocation Space and Rack Utilization

5.2 Power Consumption and PUE Metrics

5.3 Connectivity and Interconnection Data

5.4 Sustainability and Compliance Statistics

6. Competitive Landscape

6.1 List of Major Companies, By Region

6.2 Market Share Analysis, By Region

6.3 Product Benchmarking

6.3.1 Product specifications and features

6.3.2 Pricing

6.4 Strategic Initiatives

6.4.1 Marketing and promotional activities

6.4.2 Distribution and supply chain strategies

6.4.3 Expansion plans and new product launches

6.4.4 Strategic partnerships and collaborations

6.5 Technological Advancements

6.6 Market Positioning and Branding

7. Retail Colocation Market Segmentation, by End-User

7.1 Chapter Overview

7.2 SMEs

7.2.1 SMEs Market Trends Analysis (2020-2032)

7.2.2 SMEs Market Size Estimates and Forecasts to 2032 (USD Billion)

7.3 Large enterprises

7.3.1 Large enterprises Market Trends Analysis (2020-2032)

7.3.2 Large enterprises Market Size Estimates and Forecasts to 2032 (USD Billion)

8. Retail Colocation Market Segmentation, by Industry Application

8.1 Chapter Overview

8.2 IT and telecom

8.2.1 IT and Telecom Market Trends Analysis (2020-2032)

8.2.2 IT and Telecom Market Size Estimates and Forecasts to 2032 (USD Billion)

8.3 Healthcare

8.3.1 Healthcare Market Trends Analysis (2020-2032)

8.3.2 Healthcare Market Size Estimates and Forecasts to 2032 (USD Billion)

8.4 Retail and e-commerce

8.4.1 Retail and e-commerce Market Trends Analysis (2020-2032)

8.4.2 Retail and e-commerce Market Size Estimates and Forecasts to 2032 (USD Billion)

8.5 Energy and utility

8.5.1 Energy and Utility Market Trends Analysis (2020-2032)

8.5.2 Energy and Utility Market Size Estimates and Forecasts to 2032 (USD Billion)

8.6 Others

8.6.1 Other Market Trends Analysis (2020-2032)

8.6.2 Others Market Size Estimates and Forecasts to 2032 (USD Billion)

9. Regional Analysis

9.1 Chapter Overview

9.2 North America

9.2.1 Trends Analysis

9.2.2 North America Retail Colocation Market Estimates and Forecasts, by Country (2020-2032) (USD Billion)

9.2.3 North America Retail Colocation Market Estimates and Forecasts, by End-User (2020-2032) (USD Billion) 

9.2.4 North America Retail Colocation Market Estimates and Forecasts, by Industry Application (2020-2032) (USD Billion)

9.2.5 USA

9.2.5.1 USA Retail Colocation Market Estimates and Forecasts, by End-User (2020-2032) (USD Billion)

9.2.5.2 USA Retail Colocation Market Estimates and Forecasts, by Industry Application (2020-2032) (USD Billion)

9.2.6 Canada

9.2.6.1 Canada Retail Colocation Market Estimates and Forecasts, by End-User (2020-2032) (USD Billion)

9.2.6.2 Canada Retail Colocation Market Estimates and Forecasts, by Industry Application (2020-2032) (USD Billion)

9.2.7 Mexico

9.2.7.1 Mexico Retail Colocation Market Estimates and Forecasts, by End-User (2020-2032) (USD Billion)

9.2.7.2 Mexico Retail Colocation Market Estimates and Forecasts, by Industry Application (2020-2032) (USD Billion)

9.3 Europe

9.3.1 Trends Analysis

9.3.2 Europe Retail Colocation Market Estimates and Forecasts, by Country (2020-2032) (USD Billion)

9.3.3 Europe Retail Colocation Market Estimates and Forecasts, by End-User (2020-2032) (USD Billion) 

9.3.4 Europe Retail Colocation Market Estimates and Forecasts, by Industry Application (2020-2032) (USD Billion)

9.3.5 Germany

9.3.5.1 Germany Retail Colocation Market Estimates and Forecasts, by End-User (2020-2032) (USD Billion)

9.3.5.2 Germany Retail Colocation Market Estimates and Forecasts, by Industry Application (2020-2032) (USD Billion)

9.3.6 France

9.3.6.1 France Retail Colocation Market Estimates and Forecasts, by End-User (2020-2032) (USD Billion)

9.3.6.2 France Retail Colocation Market Estimates and Forecasts, by Industry Application (2020-2032) (USD Billion)

9.3.7 UK

9.3.7.1 UK Retail Colocation Market Estimates and Forecasts, by End-User (2020-2032) (USD Billion)

9.3.7.2 UK Retail Colocation Market Estimates and Forecasts, by Industry Application (2020-2032) (USD Billion)

9.3.8 Italy

9.3.8.1 Italy Retail Colocation Market Estimates and Forecasts, by End-User (2020-2032) (USD Billion)

9.3.8.2 Italy Retail Colocation Market Estimates and Forecasts, by Industry Application (2020-2032) (USD Billion)

9.3.9 Spain

9.3.9.1 Spain Retail Colocation Market Estimates and Forecasts, by End-User (2020-2032) (USD Billion)

9.3.9.2 Spain Retail Colocation Market Estimates and Forecasts, by Industry Application (2020-2032) (USD Billion)

9.3.10 Poland

9.3.10.1 Poland Retail Colocation Market Estimates and Forecasts, by End-User (2020-2032) (USD Billion)

9.3.10.2 Poland Retail Colocation Market Estimates and Forecasts, by Industry Application (2020-2032) (USD Billion)

9.3.11 Turkey

9.3.11.1 France Retail Colocation Market Estimates and Forecasts, by End-User (2020-2032) (USD Billion)

9.3.11.2 France Retail Colocation Market Estimates and Forecasts, by Industry Application (2020-2032) (USD Billion)

9.3.12 Rest of Europe

9.3.12.1 UK Retail Colocation Market Estimates and Forecasts, by End-User (2020-2032) (USD Billion)

9.3.12.2 UK Retail Colocation Market Estimates and Forecasts, by Industry Application (2020-2032) (USD Billion)

9.4 Asia-Pacific

9.4.1 Trends Analysis

9.4.2 Asia-Pacific Retail Colocation Market Estimates and Forecasts, by Country (2020-2032) (USD Billion)

9.4.3 Asia-Pacific Retail Colocation Market Estimates and Forecasts, by End-User (2020-2032) (USD Billion) 

9.4.4 Asia-Pacific Retail Colocation Market Estimates and Forecasts, by Industry Application (2020-2032) (USD Billion)

9.4.5 China

9.4.5.1 China Retail Colocation Market Estimates and Forecasts, by End-User (2020-2032) (USD Billion)

9.4.5.2 China Retail Colocation Market Estimates and Forecasts, by Industry Application (2020-2032) (USD Billion)

9.4.6 India

9.4.5.1 India Retail Colocation Market Estimates and Forecasts, by End-User (2020-2032) (USD Billion)

9.4.5.2 India Retail Colocation Market Estimates and Forecasts, by Industry Application (2020-2032) (USD Billion)

9.4.5 Japan

9.4.5.1 Japan Retail Colocation Market Estimates and Forecasts, by End-User (2020-2032) (USD Billion)

9.4.5.2 Japan Retail Colocation Market Estimates and Forecasts, by Industry Application (2020-2032) (USD Billion)

9.4.6 South Korea

9.4.6.1 South Korea Retail Colocation Market Estimates and Forecasts, by End-User (2020-2032) (USD Billion)

9.4.6.2 South Korea Retail Colocation Market Estimates and Forecasts, by Industry Application (2020-2032) (USD Billion)

9.4.7 Singapore

9.4.7.1 Singapore Retail Colocation Market Estimates and Forecasts, by End-User (2020-2032) (USD Billion)

9.4.7.2 Singapore Retail Colocation Market Estimates and Forecasts, by Industry Application (2020-2032) (USD Billion)

9.4.8 Australia

9.4.8.1 Australia Retail Colocation Market Estimates and Forecasts, by End-User (2020-2032) (USD Billion)

9.4.8.2 Australia Retail Colocation Market Estimates and Forecasts, by Industry Application (2020-2032) (USD Billion)

9.4.9 Rest of Asia-Pacific

9.4.9.1 Rest of Asia-Pacific Retail Colocation Market Estimates and Forecasts, by End-User (2020-2032) (USD Billion)

9.4.9.2 Rest of Asia-Pacific Retail Colocation Market Estimates and Forecasts, by Industry Application (2020-2032) (USD Billion)

9.5 Middle East and Africa

9.5.1 Trends Analysis

9.5.2 Middle East & Africa Retail Colocation Market Estimates and Forecasts, by Country (2020-2032) (USD Billion)

9.5.3 Middle East & Africa Retail Colocation Market Estimates and Forecasts, by End-User (2020-2032) (USD Billion) 

9.5.4 Middle East & Africa Retail Colocation Market Estimates and Forecasts, by Industry Application (2020-2032) (USD Billion)

9.5.5 UAE

9.5.5.1 UAE Retail Colocation Market Estimates and Forecasts, by End-User (2020-2032) (USD Billion)

9.5.5.2 UAE Retail Colocation Market Estimates and Forecasts, by Industry Application (2020-2032) (USD Billion)

9.5.6 Saudi Arabia

9.5.6.1 Saudi Arabia Retail Colocation Market Estimates and Forecasts, by End-User (2020-2032) (USD Billion)

9.5.6.2 Saudi Arabia Retail Colocation Market Estimates and Forecasts, by Industry Application (2020-2032) (USD Billion)

9.5.7 Qatar

9.5.7.1 Qatar Retail Colocation Market Estimates and Forecasts, by End-User (2020-2032) (USD Billion)

9.5.7.2 Qatar Retail Colocation Market Estimates and Forecasts, by Industry Application (2020-2032) (USD Billion)

9.5.8 South Africa

9.5.8.1 South Africa Retail Colocation Market Estimates and Forecasts, by End-User (2020-2032) (USD Billion)

9.5.8.2 South Africa Retail Colocation Market Estimates and Forecasts, by Industry Application (2020-2032) (USD Billion)

9.5.9 Rest of Middle East & Africa

9.5.9.1 Rest of Middle East & Africa Retail Colocation Market Estimates and Forecasts, by End-User (2020-2032) (USD Billion)

9.5.9.2 Rest of Middle East & Africa Retail Colocation Market Estimates and Forecasts, by Industry Application (2020-2032) (USD Billion)

9.6 Latin America

9.6.1 Trends Analysis

9.6.2 Latin America Retail Colocation Market Estimates and Forecasts, by Country (2020-2032) (USD Billion)

9.6.3 Latin America Retail Colocation Market Estimates and Forecasts, by End-User (2020-2032) (USD Billion) 

9.6.4 Latin America Retail Colocation Market Estimates and Forecasts, by Industry Application (2020-2032) (USD Billion)

9.6.5 Brazil

9.6.5.1 Brazil Retail Colocation Market Estimates and Forecasts, by End-User (2020-2032) (USD Billion)

9.6.5.2 Brazil Retail Colocation Market Estimates and Forecasts, by Industry Application (2020-2032) (USD Billion)

9.6.6 Argentina

9.6.6.1 Argentina Retail Colocation Market Estimates and Forecasts, by End-User (2020-2032) (USD Billion)

9.6.6.2 Argentina Retail Colocation Market Estimates and Forecasts, by Industry Application (2020-2032) (USD Billion)

9.6.7 Rest of Latin America

9.6.7.1 Rest of Latin America Retail Colocation Market Estimates and Forecasts, by End-User (2020-2032) (USD Billion)

9.6.7.2 Rest of Latin America Retail Colocation Market Estimates and Forecasts, by Industry Application (2020-2032) (USD Billion)

10. Company Profiles

10.1 AT&T Inc.

              10.1.1 Company Overview

10.1.2 Financial

10.1.3 Products/ Services Offered

10.1.4 SWOT Analysis

10.2 China Telecom

10.2.1 Company Overview

10.2.2 Financial

10.2.3 Products/ Services Offered

10.2.4 SWOT Analysis

10.3 Cogent Communications

              10.3.1 Company Overview

10.3.2 Financial

10.3.3 Products/ Services Offered

10.3.4 SWOT Analysis

10.4 Contegix

10.4.1 Company Overview

10.4.2 Financial

10.4.3 Products/ Services Offered

10.4.4 SWOT Analysis

10.5 CoreSite Realty Corporation

              10.5.1 Company Overview

10.5.2 Financial

10.5.3 Products/ Services Offered

10.5.4 SWOT Analysis

10.6 Cyxtera Technologies, Inc.

10.6.1 Company Overview

10.6.2 Financial

10.6.3 Products/ Services Offered

10.6.4 SWOT Analysis

10.7 Digital Realty Trust, Inc.

              10.7.1 Company Overview

10.7.2 Financial

10.7.3 Products/ Services Offered

10.7.4 SWOT Analysis

10.8 Global Switch

              10.8.1 Company Overview

10.8.2 Financial

10.8.3 Products/ Services Offered

10.8.4 SWOT Analysis

10.9 NTT Communications Corporation

10.9.1 Company Overview

10.9.2 Financial

10.9.3 Products/ Services Offered

10.9.4 SWOT Analysis

10.10 Verizon

             10.10.1 Company Overview

10.10.2 Financial

10.10.3 Products/ Services Offered

10.10.4 SWOT Analysis

11. Use Cases and Best Practices

12. Conclusion

An accurate research report requires proper strategizing as well as implementation. There are multiple factors involved in the completion of good and accurate research report and selecting the best methodology to compete the research is the toughest part. Since the research reports we provide play a crucial role in any company’s decision-making process, therefore we at SNS Insider always believe that we should choose the best method which gives us results closer to reality. This allows us to reach at a stage wherein we can provide our clients best and accurate investment to output ratio.

Each report that we prepare takes a timeframe of 350-400 business hours for production. Starting from the selection of titles through a couple of in-depth brain storming session to the final QC process before uploading our titles on our website we dedicate around 350 working hours. The titles are selected based on their current market cap and the foreseen CAGR and growth.


The 5 steps process:

Step 1: Secondary Research:

Secondary Research or Desk Research is as the name suggests is a research process wherein, we collect data through the readily available information. In this process we use various paid and unpaid databases which our team has access to and gather data through the same. This includes examining of listed companies’ annual reports, Journals, SEC filling etc. Apart from this our team has access to various associations across the globe across different industries. Lastly, we have exchange relationships with various university as well as individual libraries.

Secondary Research

Step 2: Primary Research

When we talk about primary research, it is a type of study in which the researchers collect relevant data samples directly, rather than relying on previously collected data.  This type of research is focused on gaining content specific facts that can be sued to solve specific problems. Since the collected data is fresh and first hand therefore it makes the study more accurate and genuine.

We at SNS Insider have divided Primary Research into 2 parts.

Part 1 wherein we interview the KOLs of major players as well as the upcoming ones across various geographic regions. This allows us to have their view over the market scenario and acts as an important tool to come closer to the accurate market numbers. As many as 45 paid and unpaid primary interviews are taken from both the demand and supply side of the industry to make sure we land at an accurate judgement and analysis of the market.

This step involves the triangulation of data wherein our team analyses the interview transcripts, online survey responses and observation of on filed participants. The below mentioned chart should give a better understanding of the part 1 of the primary interview.

Primary Research

Part 2: In this part of primary research the data collected via secondary research and the part 1 of the primary research is validated with the interviews from individual consultants and subject matter experts.

Consultants are those set of people who have at least 12 years of experience and expertise within the industry whereas Subject Matter Experts are those with at least 15 years of experience behind their back within the same space. The data with the help of two main processes i.e., FGDs (Focused Group Discussions) and IDs (Individual Discussions). This gives us a 3rd party nonbiased primary view of the market scenario making it a more dependable one while collation of the data pointers.

Step 3: Data Bank Validation

Once all the information is collected via primary and secondary sources, we run that information for data validation. At our intelligence centre our research heads track a lot of information related to the market which includes the quarterly reports, the daily stock prices, and other relevant information. Our data bank server gets updated every fortnight and that is how the information which we collected using our primary and secondary information is revalidated in real time.

Data Bank Validation

Step 4: QA/QC Process

After all the data collection and validation our team does a final level of quality check and quality assurance to get rid of any unwanted or undesired mistakes. This might include but not limited to getting rid of the any typos, duplication of numbers or missing of any important information. The people involved in this process include technical content writers, research heads and graphics people. Once this process is completed the title gets uploader on our platform for our clients to read it.

Step 5: Final QC/QA Process:

This is the last process and comes when the client has ordered the study. In this process a final QA/QC is done before the study is emailed to the client. Since we believe in giving our clients a good experience of our research studies, therefore, to make sure that we do not lack at our end in any way humanly possible we do a final round of quality check and then dispatch the study to the client.

Key Segments: 

By End-user

  • SMEs

  • Large enterprises

By Industry Application

  • IT and telecom

  • Healthcare

  • Retail and e-commerce

  • Energy and utility

  • Others

Request for Segment Customization as per your Business Requirement: Segment Customization Request

Regional Coverage: 

North America

  • US

  • Canada

  • Mexico

Europe

  • Germany

  • France

  • UK

  • Italy

  • Spain

  • Poland

  • Turkey

  • Rest of Europe

Asia Pacific

  • China

  • India

  • Japan

  • South Korea

  • Singapore

  • Australia

  • Rest of Asia Pacific

Middle East & Africa

  • UAE

  • Saudi Arabia

  • Qatar

  • South Africa

  • Rest of Middle East & Africa

Latin America

  • Brazil

  • Argentina

  • Rest of Latin America

Request for Country Level Research Report: Country Level Customization Request

Available Customization 

With the given market data, SNS Insider offers customization as per the company’s specific needs. The following customization options are available for the report: 

  • Detailed Volume Analysis 

  • Criss-Cross segment analysis (e.g. Product X Application) 

  • Competitive Product Benchmarking 

  • Geographic Analysis 

  • Additional countries in any of the regions 

  • Customized Data Representation 

  • Detailed analysis and profiling of additional market players

Explore Key Insights 


  • Analyzes market trends, forecasts, and regional dynamics
  • Covers core offerings, innovations, and industry use cases
  • Profiles major players, value chains, and strategic developments
  • Highlights innovation trends, regulatory impacts, and growth opportunities
Request an Analyst Call