Robotic Glass Installation Market Report Scope & Overview:

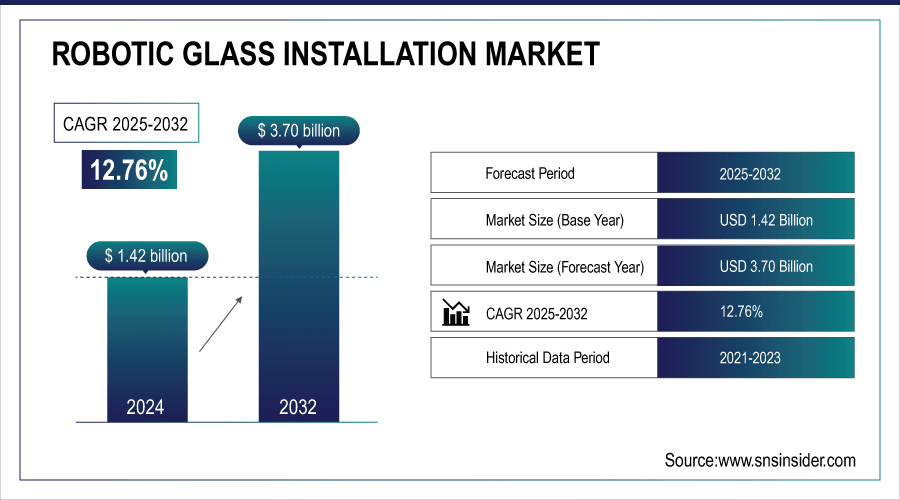
The Robotic Glass Installation Market size was valued at USD 1.42 billion in 2024 and is expected to reach USD 3.70 billion by 2032 and grow at a CAGR of 12.76% over the forecast period 2025-2032.

The global market report provides a broad-level segmentation of the market, including detailed robotic glass installation market analysis by product type, application, automation level, and end-user, and regional insights. Factors such as the growing automation in construction processes, increasing emphasis on worker safety, and the demand for precision and effective installation of glass are fueling this trend. Today, we see construction workers globally implementing robotic solutions to supplement their build—enhancing precision, minimizing reliance on manual labor, and aligning with the demands of modern architectural design and performance.

For instance, robotic handling has reduced glass breakage rates by nearly 80% in some industrial trials compared to manual setups.

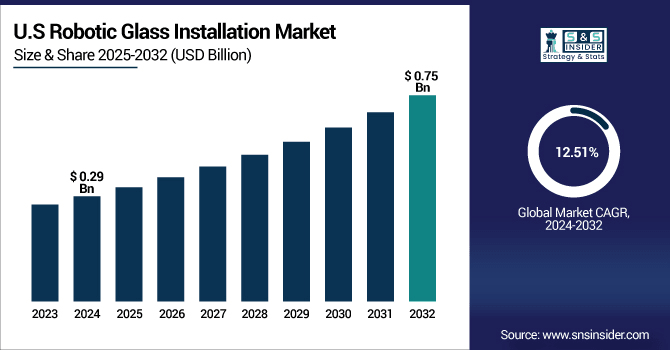
The U.S. Robotic Glass Installation Market size was USD 0.29 billion in 2024 and is expected to reach USD 0.75 billion by 2032, growing at a CAGR of 12.51% over the forecast period of 2025–2032.

The U.S. market is experiencing robust robotic glass installation market growth, driven by increasing labor costs, strong trends toward smart and automated construction, and growing demand for robotic integration in high-rise and commercial glazing applications. This, along with the presence of industry-leading robot manufacturers, is accelerating the adoption for not only renovation projects but new construction projects as well. The change is indicative of the industry's increase towards better efficiency, safety, and accuracy in the implementation of glass in metropolitan regions in the U.S.

For instance, use of robotic lifting arms has helped some U.S. companies reduce glass breakage rates by over 75%.

Market Dynamics:

Key Drivers:

  • Rising Demand for Labor-Saving and Precision Installation in the Construction Industry

Driving the robotization of construction is the increasing need of labor-saving solutions and high precision glass installation in complicated construction environments. Conventional approaches are labor-intensive, prone to mistakes and become costly as skilled labor dwindles. The benefits of robotic glass fabrication include improved quality, fewer ergonomics-related injuries, and faster project completion. The precision millimetre handling of large glass panels is increasingly attractive to commercial developers and infrastructure planners, and thus driving deployment of the technology across advanced construction sites globally, most notably in urban high-rise development and automated building systems.

For instance, implementation of robotic solutions has reduced glass misalignment and breakage incidents by more than 70% in pilot studies.

Restraints:

  • High Initial Cost and Integration Barriers Across Mid-Sized Enterprises in Emerging and Developed Regions

The initial expenditure of robotic glass systems and relevant infrastructure are rather costly, and therefore, a major entry barrier for many mid-sized construction and renovation companies. Acquisition, training, and retrofitting associated with automation add to CAPEX. Not only does this also lead to a smooth integration for robotic solutions, but also lack of technical expertise. These systems are, then, often considered unnecessary in price-sensitive markets, specifically in developing regions, and tend to slow down their widespread adoption. Unless there are scalable and cost-effective solutions, this market penetration will be limited to large enterprises and high-end projects.

Opportunities:

  • Integration of AI, IoT, and Vision Systems to Enable Smart Glass Installation Processes

AI, IoT and advanced vision systems represent a huge opportunity to increase the intelligence and autonomy of robotic glass installers. By employing real-time object detection and machine learning algorithms that interact with adaptive path planning, systems can operate effectively in unpredictable or dynamic jobsite environments. Feedback loops that can proactively anticipate objectives and discrepancies will only help in further minimizing production downtimes and maintenance costs. This could allow full automation from transportation to placement, creating novel use cases across smart cities, automated building and sustainable construction practices.

For instance, over 65% of advanced construction robots now feature real-time vision systems for object detection and obstacle avoidance.

Challenges:

  • Operational Downtime and Maintenance Complexity in Harsh and Unpredictable Jobsite Conditions

The efficiency of robotic systems is greatly reduced by forced operational downtimes due to maintenance issues or jobsite environmental exposure. Sensors, actors or navigation commonly interrupted by dust, moisture and the uneven terrain. These machines must also avoid accidental collisions and damage in construction environments with other heavy equipment, workers, many barriers, and ever-present danger. The expectation is that frequent recalibration, part replacement, and diagnostics will push projects out-of-schedule and ultimately increase the total cost of ownership. Several market players are also focused on making these systems more durable, modular and easier to maintain and replace via plug-and-play, which has become a crucial engineering & logistical challenge.

Segmentation Analysis:

By Product Type

Automated Glass Handling Robots dominated the market with a share of 41% in 2024. As they are widely used in major commercial and industrial applications where accuracy and safety are paramount. Lifting and placing oversized glass panels made possible with SmartLift handling solution. These robots minimize human effort and improve productivity in construction, thus developed into an essential machine for modern construction operations globally.

The Glass Installation Drones segment is expected to grow at the highest CAGR of 14.40% during 2024–2032. The growing use of Abatement Robots for high-rise and architecturally complex projects is paving the way for adoption. On the Aerial Robotics side, firms such as FBR Ltd. are advancing robotics for glass installation with the ability to work high above where traditional equipment stops working. These are much safer drones that are less setup intensive and are designed for modern, vertical urban construction scenarios.

By Application

The Commercial segment held highest market share of 38% in 2024, owing to the extensive utilization of glass façades in commercial buildings and shopping complexes. For big commercial glazing projects, firms which provide customized robotic systems such as AGT Robotics. They enhance operational productivity, deliver consistent installation quality, and decrease on-site labor dependency in malls, offices, and hospitals in developed and emerging nations significantly.

The Infrastructure segment embraces smart city projects and mass transit hubs and is anticipated to grow with a 13.17% CAGR until 2032. Glass installation for infrastructure contractors now depends on scalable, repeatable robotic systems. Through robotics-enabled building solutions, Saint-Gobain enables infrastructure developers to deliver energy-efficient and visually intricate designs with greater speed and accuracy of installation, thus advancing the use of robotics in public construction projects.

By Automation Level

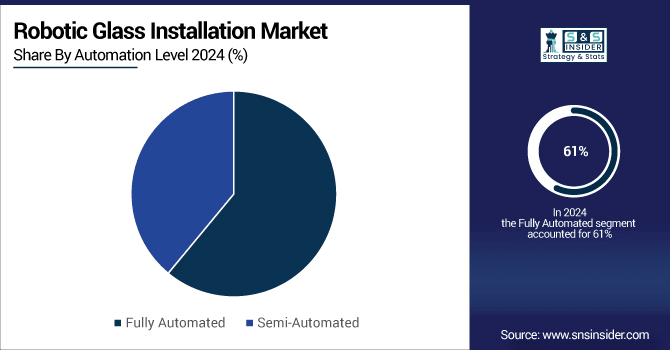
The Fully Automated segment dominated the market and accounted for 61% share in 2024 and is projected to be the fastest growing with a CAGR of 13.01% during 2024-2032. It earns its dominance due to the fact that it is deployed on a large scale with very little human intervention needed. There are fully integrated systems built for glass automation by automation firms such as KUKA AG, in which all operations related to glass lifting and positioning to its placement have been automated. Such solutions are absolutely the best-suited outlooks for contemporary construction purposes where accuracy, velocity, and round-the-clock operation are major KPIs.

By End-User

Construction Companies accounted for the highest robotic glass installation market share by 44% in 2024, driven by the extensive use of robotics for new building projects. Construction contractors increasingly partner with companies such as Hilti to offer semi- and fully-automated robotic glass solutions tailored to ensure quicker and safer installations. These enhancements to safety, time, and unprofessionalism incorporate these tools and are sure to become norms for high-end construction developments on a global scale.

Renovation & Maintenance Service Providers are expected to witness the highest CAGR of 14.06% during 2024–2032. The need for cosmetic and energy upgrades in older buildings is pushing the acceptance of robotics for retrofitting glass. The need for hassle-free replacements in operational buildings is driving the growth of the maintenance segment with companies such as GlasLift providing smaller, portable robotic systems that can be set up quickly on renovation sites with tight confines and making high-accuracy replacements.

Regional Analysis:

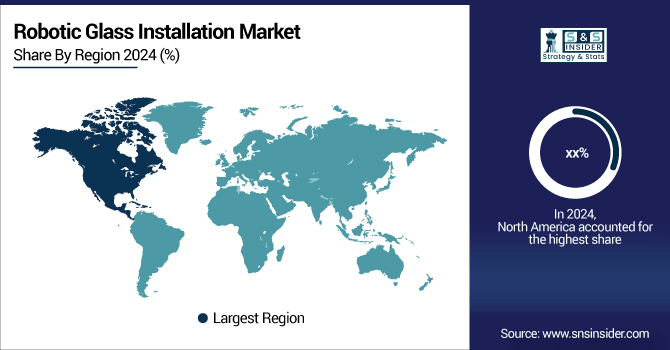
In North America, Robotic Glass Installation market is increasing at a steady pace, owing to high labor costs, advanced construction practices and high automation adoption. In the US, the region is fueled by the presence of key robotics manufacturers and a high demand for industrial precision in commercial projects. Rising emphasis on worker safety and productivity is still responsible for robotic incorporation throughout construction and refurbishment industries.

  • The U.S. dominates the North American market due to high investment in smart construction, rapid adoption of robotic automation, and presence of key manufacturers. Large-scale commercial projects and labor efficiency demands further drive robotic glass installation adoption.

Asia Pacific dominates the global market with a 32% market share as of 2024 and is the fastest-growing region, estimated to grow at a 13.70% CAGR between 2024 and 2032. This dominance is the result of rapid urbanization, increasing construction investments, and increasing adoption automation automated solutions in nations such as China, India, and Japan. Large-scale infrastructure development, a rising number of smart city projects, and government support make the region attractive. Asia Pacific is dominating the present market due to the construction boom and economical robotic solutions.

  • China leads in the Asia Pacific market due to its massive infrastructure development, urban high-rise construction boom, and government-backed smart city initiatives. Local manufacturing capabilities and increasing demand for construction automation reinforce its dominant position in robotic glass installation.

Europe’s Robotic Glass Installation industry is growing steadily, supported by strong emphasis on construction automation, worker safety, and energy-efficient buildings. Countries including Germany, France, and the UK are leading adopters due to advanced infrastructure and smart building initiatives. Strict labor regulations and high safety standards further encourage the integration of robotic systems for precise and efficient glass installation across the region.

  • Germany dominates Europe’s Robotic Glass Installation Market due to its advanced construction practices, strong robotics industry, and focus on automation. High labor costs, strict safety standards, and growing smart infrastructure projects further boost its leadership over France, UK, Italy, and Spain.

The Middle East & Africa market is led by the UAE, driven by smart city developments and high-rise construction in cities such as Dubai. In Latin America, Brazil dominates due to increasing commercial infrastructure, urbanization, and growing adoption of automation technologies in construction, placing it ahead of Argentina and other regional countries.

Key Players:

Major Key Players in Robotic Glass Installation companies are SmartLift, KUKA AG, ABB Ltd., FBR Ltd., AGT Robotics, Saint-Gobain, FANUC Corporation, Jekko S.p.A., GlasLift, Hilti Group, Schmalz GmbH, Hird Ltd., Bohle AG, Vitrum Glass Group, Z-Lift, GGR Group, Wood's Powr-Grip, Vacuworx, Baubot and Kranlyft Group and others.

Recent Developments:

  • In May 2024, KUKA robotics systems were deployed by Schüco International for autonomous loading and unloading of aluminum and glass profiles at their production facility, demonstrating expanded application beyond typical industrial uses.

  • In March 2024, SmartLift introduced its SL 1009 Outdoor glazier robot, enhancing heavy glass panel handling with extended boom and vacuum lift capabilities—ideal for large-scale façade projects.

Robotic Glass Installation Market Report Scope:

Report Attributes Details
Market Size in 2024 USD 1.42 Billion 
Market Size by 2032 USD 3.70 Billion 
CAGR CAGR of 12.76% From 2025 to 2032
Base Year 2024
Forecast Period 2025-2032
Historical Data 2021-2023
Report Scope & Coverage Market Size, Segments Analysis, Competitive Landscape, Regional Analysis, DROC & SWOT Analysis, Forecast Outlook
Key Segments • By Product Type (Automated Glass Handling Robots, Glass Installation Drones, Collaborative Robots and Others)
• By Application (Residential, Commercial, Industrial and Infrastructure)
• By Automation Level (Fully Automated and Semi-Automated)
• By End-User (Construction Companies, Glass Manufacturers, Renovation & Maintenance Service Providers and Others)
Regional Analysis/Coverage North America (US, Canada, Mexico), Europe (Germany, France, UK, Italy, Spain, Poland, Turkey, Rest of Europe), Asia Pacific (China, India, Japan, South Korea, Singapore, Australia,Taiwan, Rest of Asia Pacific), Middle East & Africa (UAE, Saudi Arabia, Qatar, South Africa, Rest of Middle East & Africa), Latin America (Brazil, Argentina, Rest of Latin America)
Company Profiles SmartLift, KUKA AG, ABB Ltd., FBR Ltd., AGT Robotics, Saint-Gobain, FANUC Corporation, Jekko S.p.A., GlasLift, Hilti Group, Schmalz GmbH, Hird Ltd., Bohle AG, Vitrum Glass Group, Z-Lift, GGR Group, Wood's Powr-Grip, Vacuworx, Baubot and Kranlyft Group

Table Of Contents

1. Introduction

1.1 Market Definition & Scope

 1.2 Research Assumptions & Abbreviations

 1.3 Research Methodology

2. Executive Summary

2.1 Market Snapshot

 2.2 Market Absolute $ Opportunity Assessment & Y-o-Y Analysis, 2021–2032

 2.3 Market Size & Forecast, By Segmentation, 2021–2032

  2.3.1 Market Size By Type

  2.3.2 Market Size By Application

         2.3.3 Market Size By Automation Level

         2.3.4 Market Size By End-User

 2.4 Market Share & Bps Analysis By Region, 2024

 2.5 Industry Growth Scenarios – Conservative, Likely & Optimistic

 2.6 Industry CxO’s Perspective

3. Market Overview

3.1 Market Dynamics

  3.1.1 Drivers

  3.1.2 Restraints

  3.1.3 Opportunities

  3.1.4 Key Market Trends

 3.2 Industry PESTLE Analysis

 3.3 Key Industry Forces (Porter’s) Impacting Market Growth

 3.4 Industry Supply Chain Analysis

  3.4.1 Raw Material Suppliers

  3.4.2 Manufacturers

  3.4.3 Distributors/Suppliers

  3.4.4 Customers/End-Users

 3.5 Industry Life Cycle Assessment

 3.6 Parent Market Overview

 3.7 Market Risk Assessment

4. Statistical Insights & Trends Reporting

4.1 Pricing Analysis & Forecast

4.1.1 Overview

4.1.2 Pricing Analysis & Forecast By Product

4.1.3 Price Benchmarking By Key Players

4.1.4 Regional Pricing Comparison

4.1.5 Historical Price Trend Analysis

4.2 Production & Manufacturing Statistics

4.2.1 Overview

4.2.2 Production Volume By Region

4.2.3 Manufacturing Capacity Utilization Rate

4.2.4 Key Component Supply Chain Analysis

4.2.5 Robotics System Assembly Time Benchmarking

4.3 Application Utilization Statistics

4.3.1 Overview

4.3.2 Utilization Rate By End-Use Industry

4.3.3 Installation Throughput (Panels/Hour) Comparison

4.3.4 Adoption Level in New vs. Retrofit Projects

4.3.5 Operational Downtime Reduction Metrics

4.4 Patent & Innovation Statistics

4.4.1 Overview

4.4.2 Number of Patents Filed By Key Players

4.4.3 Innovation Trends by Technology Type

4.4.4 Regional Patent Filing Statistics

4.4.5 R&D Investment Share of Revenue

4.5 Environmental & Energy Efficiency Metrics

4.5.1 Overview

4.5.2 Energy Consumption Per Installation

4.5.3 Reduction in Material Wastage

4.5.4 Lifecycle Emissions Comparison (Robotic vs. Manual)

4.5.5 Eco-Certifications & Compliance Rates

4.6 Safety & Compliance Metrics

4.6.1 Overview

4.6.2 Injury Rate Reduction Statistics

4.6.3 Compliance Rate with Safety Standards

4.6.4 Insurance Claim Reduction Post Automation

4.6.5 Safety Ratings By System Type

5. Robotic Glass Installation Market Segmental Analysis & Forecast, By Type, 2021 – 2032, Value (Usd Billion)

5.1 Introduction

 5.2 Automated Glass Handling Robots

  5.2.1 Key Trends

  5.2.2 Market Size & Forecast, 2021 – 2032

 5.3 Glass Installation Drones

  5.3.1 Key Trends

  5.3.2 Market Size & Forecast, 2021 – 2032

    5.4 Collaborative Robots

  5.4.1 Key Trends

  5.4.2 Market Size & Forecast, 2021 – 2032

     5.5 Others

  5.5.1 Key Trends

  5.5.2 Market Size & Forecast, 2021 – 2032

6. Robotic Glass Installation Market Segmental Analysis & Forecast, By Application, 2021 – 2032, Value (Usd Billion)

    6.1 Introduction

 6.2 Residential

  6.2.1 Key Trends

  6.2.2 Market Size & Forecast, 2021 – 2032

 6.3 Commercial

  6.3.1 Key Trends

  6.3.2 Market Size & Forecast, 2021 – 2032

 6.4 Industrial

  6.4.1 Key Trends

  6.4.2 Market Size & Forecast, 2021 – 2032

     6.5 Infrastructure

  6.5.1 Key Trends

  6.5.2 Market Size & Forecast, 2021 – 2032

7. Robotic Glass Installation Market Segmental Analysis & Forecast, By Automation Level, 2021 – 2032, Value (Usd Billion)

    7.1 Introduction

 7.2 Fully Automated

  7.2.1 Key Trends

  7.2.2 Market Size & Forecast, 2021 – 2032

 7.3 Semi-Automated

  7.3.1 Key Trends

  7.3.2 Market Size & Forecast, 2021 – 2032

8. Robotic Glass Installation Market Segmental Analysis & Forecast, By End-User, 2021 – 2032, Value (Usd Billion)

    8.1 Introduction

 8.2 Construction Companies

  8.2.1 Key Trends

  8.2.2 Market Size & Forecast, 2021 – 2032

 8.3 Glass Manufacturers

  8.3.1 Key Trends

  8.3.2 Market Size & Forecast, 2021 – 2032

 8.4 Renovation & Maintenance Service Providers

  8.4.1 Key Trends

  8.4.2 Market Size & Forecast, 2021 – 2032

    8.5 Others

  8.5.1 Key Trends

  8.5.2 Market Size & Forecast, 2021 – 2032

9. Robotic Glass Installation Market Segmental Analysis & Forecast By Region, 2021 – 2025, Value (Usd Billion)

9.1 Introduction

9.2 North America

 9.2.1 Key Trends

 9.2.2 Robotic Glass Installation Market Size & Forecast, By Type, 2021 – 2032

 9.2.3 Robotic Glass Installation Market Size & Forecast, By Application, 2021 – 2032

 9.2.4 Robotic Glass Installation Market Size & Forecast, By Automation Level, 2021 – 2032

 9.2.5 Robotic Glass Installation Market Size & Forecast, By End-User, 2021 – 2032

 9.2.6 Robotic Glass Installation Market Size & Forecast, By Country, 2021 – 2032

  9.2.6.1 USA

   9.2.6.1.1 Robotic Glass Installation Market Size & Forecast, By Type, 2021 – 2032

   9.2.6.1.2 Robotic Glass Installation Market Size & Forecast, By Application, 2021 – 2032

   9.2.6.1.3 Robotic Glass Installation Market Size & Forecast, By Automation Level, 2021 – 2032

   9.2.6.1.4 Robotic Glass Installation Market Size & Forecast, By End-User, 2021 – 2032

  9.2.6.2 Canada

   9.2.6.2.1 Robotic Glass Installation Market Size & Forecast, By Type, 2021 – 2032

   9.2.6.2.2 Robotic Glass Installation Market Size & Forecast, By Application, 2021 – 2032

   9.2.6.2.3 Robotic Glass Installation Market Size & Forecast, By Automation Level, 2021 – 2032

   9.2.6.2.4 Robotic Glass Installation Market Size & Forecast, By End-User, 2021 – 2032

9.3 Europe

 9.3.1 Key Trends

 9.3.2 Robotic Glass Installation Market Size & Forecast, By Type, 2021 – 2032

 9.3.3 Robotic Glass Installation Market Size & Forecast, By Application, 2021 – 2032

 9.3.4 Robotic Glass Installation Market Size & Forecast, By Automation Level, 2021 – 2032

 9.3.5 Robotic Glass Installation Market Size & Forecast, By End-User, 2021 – 2032

 9.3.6 Robotic Glass Installation Market Size & Forecast, By Country, 2021 – 2032

  9.3.6.1 Germany

   9.3.6.1.1 Robotic Glass Installation Market Size & Forecast, By Type, 2021 – 2032

   9.3.6.1.2 Robotic Glass Installation Market Size & Forecast, By Application, 2021 – 2032

   9.3.6.1.3 Robotic Glass Installation Market Size & Forecast, By Automation Level, 2021 – 2032

   9.3.6.1.4 Robotic Glass Installation Market Size & Forecast, By End-User, 2021 – 2032

  9.3.6.2 UK

   9.3.6.2.1 Robotic Glass Installation Market Size & Forecast, By Type, 2021 – 2032

   9.3.6.2.2 Robotic Glass Installation Market Size & Forecast, By Application, 2021 – 2032

   9.3.6.2.3 Robotic Glass Installation Market Size & Forecast, By Automation Level, 2021 – 2032

   9.3.6.2.4 Robotic Glass Installation Market Size & Forecast, By End-User, 2021 – 2032

  9.3.6.3 France

   9.3.6.3.1 Robotic Glass Installation Market Size & Forecast, By Type, 2021 – 2032

   9.3.6.3.2 Robotic Glass Installation Market Size & Forecast, By Application, 2021 – 2032

   9.3.6.3.3 Robotic Glass Installation Market Size & Forecast, By Automation Level, 2021 – 2032

   9.3.6.3.4 Robotic Glass Installation Market Size & Forecast, By End-User, 2021 – 2032

  9.3.6.4 Italy

   9.3.6.4.1 Robotic Glass Installation Market Size & Forecast, By Type, 2021 – 2032

   9.3.6.4.2 Robotic Glass Installation Market Size & Forecast, By Application, 2021 – 2032

   9.3.6.4.3 Robotic Glass Installation Market Size & Forecast, By Automation Level, 2021 – 2032

   9.3.6.4.4 Robotic Glass Installation Market Size & Forecast, By End-User, 2021 – 2032

  9.3.6.5 Spain

   9.3.6.5.1 Robotic Glass Installation Market Size & Forecast, By Type, 2021 – 2032

   9.3.6.5.2 Robotic Glass Installation Market Size & Forecast, By Application, 2021 – 2032

   9.3.6.5.3 Robotic Glass Installation Market Size & Forecast, By Automation Level, 2021 – 2032

   9.3.6.5.4 Robotic Glass Installation Market Size & Forecast, By End-User, 2021 – 2032

  9.3.6.6 Russia

   9.3.6.6.1 Robotic Glass Installation Market Size & Forecast, By Type, 2021 – 2032

   9.3.6.6.2 Robotic Glass Installation Market Size & Forecast, By Application, 2021 – 2032

   9.3.6.6.3 Robotic Glass Installation Market Size & Forecast, By Automation Level, 2021 – 2032

   9.3.6.6.4 Robotic Glass Installation Market Size & Forecast, By End-User, 2021 – 2032

  9.3.6.7 Poland

   9.3.6.7.1 Robotic Glass Installation Market Size & Forecast, By Type, 2021 – 2032

   9.3.6.7.2 Robotic Glass Installation Market Size & Forecast, By Application, 2021 – 2032

   9.3.6.7.3 Robotic Glass Installation Market Size & Forecast, By Automation Level, 2021 – 2032

   9.3.6.7.4 Robotic Glass Installation Market Size & Forecast, By End-User, 2021 – 2032

  9.3.6.8 Rest of Europe

   9.3.6.8.1 Robotic Glass Installation Market Size & Forecast, By Type, 2021 – 2032

   9.3.6.8.2 Robotic Glass Installation Market Size & Forecast, By Application, 2021 – 2032

   9.3.6.8.3 Robotic Glass Installation Market Size & Forecast, By Automation Level, 2021 – 2032

   9.3.6.8.4 Robotic Glass Installation Market Size & Forecast, By End-User, 2021 – 2032   

9.4 Asia-Pacific

 9.4.1 Key Trends

 9.4.2 Robotic Glass Installation Market Size & Forecast, By Type, 2021 – 2032

 9.4.3 Robotic Glass Installation Market Size & Forecast, By Application, 2021 – 2032

 9.4.4 Robotic Glass Installation Market Size & Forecast, By Automation Level, 2021 – 2032

 9.4.5 Robotic Glass Installation Market Size & Forecast, By End-User, 2021 – 2032

 9.4.6 Robotic Glass Installation Market Size & Forecast, By Country, 2021 – 2032

  9.4.6.1 China

   9.4.6.1.1 Robotic Glass Installation Market Size & Forecast, By Type, 2021 – 2032

   9.4.6.1.2 Robotic Glass Installation Market Size & Forecast, By Application, 2021 – 2032

   9.4.6.1.3 Robotic Glass Installation Market Size & Forecast, By Automation Level, 2021 – 2032

   9.4.6.1.4 Robotic Glass Installation Market Size & Forecast, By End-User, 2021 – 2032

  9.4.6.2 India

   9.4.6.2.1 Robotic Glass Installation Market Size & Forecast, By Type, 2021 – 2032

   9.4.6.2.2 Robotic Glass Installation Market Size & Forecast, By Application, 2021 – 2032

   9.4.6.2.3 Robotic Glass Installation Market Size & Forecast, By Automation Level, 2021 – 2032

   9.4.6.2.4 Robotic Glass Installation Market Size & Forecast, By End-User, 2021 – 2032

  9.4.6.3 Japan

   9.4.6.3.1 Robotic Glass Installation Market Size & Forecast, By Type, 2021 – 2032

   9.4.6.3.2 Robotic Glass Installation Market Size & Forecast, By Application, 2021 – 2032

   9.4.6.3.3 Robotic Glass Installation Market Size & Forecast, By Automation Level, 2021 – 2032

   9.4.6.3.4 Robotic Glass Installation Market Size & Forecast, By End-User, 2021 – 2032

  9.4.6.4 South Korea

   9.4.6.4.1 Robotic Glass Installation Market Size & Forecast, By Type, 2021 – 2032

   9.4.6.4.2 Robotic Glass Installation Market Size & Forecast, By Application, 2021 – 2032

   9.4.6.4.3 Robotic Glass Installation Market Size & Forecast, By Automation Level, 2021 – 2032

   9.4.6.4.4 Robotic Glass Installation Market Size & Forecast, By End-User, 2021 – 2032

  9.4.6.5 Australia

   9.4.6.5.1 Robotic Glass Installation Market Size & Forecast, By Type, 2021 – 2032

   9.4.6.5.2 Robotic Glass Installation Market Size & Forecast, By Application, 2021 – 2032

   9.4.6.5.3 Robotic Glass Installation Market Size & Forecast, By Automation Level, 2021 – 2032

   9.4.6.5.4 Robotic Glass Installation Market Size & Forecast, By End-User, 2021 – 2032

  9.4.6.6 ASEAN Countries

   9.4.6.6.1 Robotic Glass Installation Market Size & Forecast, By Type, 2021 – 2032

   9.4.6.6.2 Robotic Glass Installation Market Size & Forecast, By Application, 2021 – 2032

   9.4.6.6.3 Robotic Glass Installation Market Size & Forecast, By Automation Level, 2021 – 2032

   9.4.6.6.4 Robotic Glass Installation Market Size & Forecast, By End-User, 2021 – 2032

  9.4.6.7 Rest of Asia-Pacific

   9.4.6.7.1 Robotic Glass Installation Market Size & Forecast, By Type, 2021 – 2032

   9.4.6.7.2 Robotic Glass Installation Market Size & Forecast, By Application, 2021 – 2032

   9.4.6.7.3 Robotic Glass Installation Market Size & Forecast, By Automation Level, 2021 – 2032

   9.4.6.7.4 Robotic Glass Installation Market Size & Forecast, By End-User, 2021 – 2032

9.5 Latin America

 9.5.1 Key Trends

 9.5.2 Robotic Glass Installation Market Size & Forecast, By Type, 2021 – 2032

 9.5.3 Robotic Glass Installation Market Size & Forecast, By Application, 2021 – 2032

 9.5.4 Robotic Glass Installation Market Size & Forecast, By Automation Level, 2021 – 2032

 9.5.5 Robotic Glass Installation Market Size & Forecast, By End-User, 2021 – 2032

 9.5.6 Robotic Glass Installation Market Size & Forecast, By Country, 2021 – 2032

  9.5.6.1 Brazil

   9.5.6.1.1 Robotic Glass Installation Market Size & Forecast, By Type, 2021 – 2032

   9.5.6.1.2 Robotic Glass Installation Market Size & Forecast, By Application, 2021 – 2032

   9.5.6.1.3 Robotic Glass Installation Market Size & Forecast, By Automation Level, 2021 – 2032

   9.5.6.1.4 Robotic Glass Installation Market Size & Forecast, By End-User, 2021 – 2032

  9.5.6.2 Argentina

   9.5.6.2.1 Robotic Glass Installation Market Size & Forecast, By Type, 2021 – 2032

   9.5.6.2.2 Robotic Glass Installation Market Size & Forecast, By Application, 2021 – 2032

   9.5.6.2.3 Robotic Glass Installation Market Size & Forecast, By Automation Level, 2021 – 2032

   9.5.6.2.4 Robotic Glass Installation Market Size & Forecast, By End-User, 2021 – 2032

  9.5.6.3 Mexico

   9.5.6.3.1 Robotic Glass Installation Market Size & Forecast, By Type, 2021 – 2032

   9.5.6.3.2 Robotic Glass Installation Market Size & Forecast, By Application, 2021 – 2032

   9.5.6.3.3 Robotic Glass Installation Market Size & Forecast, By Automation Level, 2021 – 2032

   9.5.6.3.4 Robotic Glass Installation Market Size & Forecast, By End-User, 2021 – 2032

  9.5.6.4 Colombia

   9.5.6.4.1 Robotic Glass Installation Market Size & Forecast, By Type, 2021 – 2032

   9.5.6.4.2 Robotic Glass Installation Market Size & Forecast, By Application, 2021 – 2032

   9.5.6.4.3 Robotic Glass Installation Market Size & Forecast, By Automation Level, 2021 – 2032

   9.5.6.4.4 Robotic Glass Installation Market Size & Forecast, By End-User, 2021 – 2032

  9.5.6.5 Rest of Latin America

   9.5.6.5.1 Robotic Glass Installation Market Size & Forecast, By Type, 2021 – 2032

   9.5.6.5.2 Robotic Glass Installation Market Size & Forecast, By Application, 2021 – 2032

   9.5.6.5.3 Robotic Glass Installation Market Size & Forecast, By Automation Level, 2021 – 2032

   9.5.6.5.4 Robotic Glass Installation Market Size & Forecast, By End-User, 2021 – 2032

9.6 Middle East & Africa

 9.6.1 Key Trends

 9.6.2 Robotic Glass Installation Market Size & Forecast, By Type, 2021 – 2032

 9.6.3 Robotic Glass Installation Market Size & Forecast, By Application, 2021 – 2032

 9.6.4 Robotic Glass Installation Market Size & Forecast, By Automation Level, 2021 – 2032

 9.6.5 Robotic Glass Installation Market Size & Forecast, By End-User, 2021 – 2032

 9.6.6 Robotic Glass Installation Market Size & Forecast, By Country, 2021 – 2032

  9.6.6.1 UAE

   9.6.6.1.1 Robotic Glass Installation Market Size & Forecast, By Type, 2021 – 2032

   9.6.6.1.2 Robotic Glass Installation Market Size & Forecast, By Application, 2021 – 2032

   9.6.6.1.3 Robotic Glass Installation Market Size & Forecast, By Automation Level, 2021 – 2032

   9.6.6.1.4 Robotic Glass Installation Market Size & Forecast, By End-User, 2021 – 2032

  9.6.6.2 Saudi Arabia

   9.6.6.2.1 Robotic Glass Installation Market Size & Forecast, By Type, 2021 – 2032

   9.6.6.2.2 Robotic Glass Installation Market Size & Forecast, By Application, 2021 – 2032

   9.6.6.2.3 Robotic Glass Installation Market Size & Forecast, By Automation Level, 2021 – 2032

   9.6.6.2.4 Robotic Glass Installation Market Size & Forecast, By End-User, 2021 – 2032

  9.6.6.3 Qatar

   9.6.6.3.1 Robotic Glass Installation Market Size & Forecast, By Type, 2021 – 2032

   9.6.6.3.2 Robotic Glass Installation Market Size & Forecast, By Application, 2021 – 2032

   9.6.6.3.3 Robotic Glass Installation Market Size & Forecast, By Automation Level, 2021 – 2032

   9.6.6.3.4 Robotic Glass Installation Market Size & Forecast, By End-User, 2021 – 2032

  9.6.6.4 Egypt

   9.6.6.4.1 Robotic Glass Installation Market Size & Forecast, By Type, 2021 – 2032

   9.6.6.4.2 Robotic Glass Installation Market Size & Forecast, By Application, 2021 – 2032

   9.6.6.4.3 Robotic Glass Installation Market Size & Forecast, By Automation Level, 2021 – 2032

   9.6.6.4.4 Robotic Glass Installation Market Size & Forecast, By End-User, 2021 – 2032

  9.6.6.5 South Africa

   9.6.6.5.1 Robotic Glass Installation Market Size & Forecast, By Type, 2021 – 2032

   9.6.6.5.2 Robotic Glass Installation Market Size & Forecast, By Application, 2021 – 2032

   9.6.6.5.3 Robotic Glass Installation Market Size & Forecast, By Automation Level, 2021 – 2032

   9.6.6.5.4 Robotic Glass Installation Market Size & Forecast, By End-User, 2021 – 2032

  9.6.6.6 Rest of Middle East & Africa

   9.6.6.6.1 Robotic Glass Installation Market Size & Forecast, By Type, 2021 – 2032

   9.6.6.6.2 Robotic Glass Installation Market Size & Forecast, By Application, 2021 – 2032

   9.6.6.6.3 Robotic Glass Installation Market Size & Forecast, By Automation Level, 2021 – 2032

   9.6.6.6.4 Robotic Glass Installation Market Size & Forecast, By End-User, 2021 – 2032

10. Competitive Landscape

 10.1 Key Players' Positioning

 10.2 Competitive Developments

  10.2.1 Key Strategies Adopted (%), By Key Players, 2024

  10.2.2 Year-Wise Strategies & Development, 2021 – 2025

  10.2.3 Number Of Strategies Adopted By Key Players, 2024

 10.3 Market Share Analysis, 2024

 10.4 Product/Service & Application Benchmarking

  10.4.1 Product/Service Specifications & Features By Key Players

  10.4.2 Product/Service Heatmap By Key Players

  10.4.3 Application Heatmap By Key Players

 10.5 Industry Start-Up & Innovation Landscape

10.6 Key Company Profiles

 10.6.1 SmartLift

  10.6.1.1 Company Overview & Snapshot

  10.6.1.2 Product/Service Portfolio

  10.6.1.3 Key Company Financials

  10.6.1.4 SWOT Analysis

 10.6.2 KUKA AG

  10.6.2.1 Company Overview & Snapshot

  10.6.2.2 Product/Service Portfolio

  10.6.2.3 Key Company Financials

  10.6.2.4 SWOT Analysis

 10.6.3 ABB Ltd.

  10.6.3.1 Company Overview & Snapshot

  10.6.3.2 Product/Service Portfolio

  10.6.3.3 Key Company Financials

  10.6.3.4 SWOT Analysis

 10.6.4 FBR Ltd.

  10.6.4.1 Company Overview & Snapshot

  10.6.4.2 Product/Service Portfolio

  10.6.4.3 Key Company Financials

  10.6.4.4 SWOT Analysis

 10.6.5 AGT Robotics

  10.6.5.1 Company Overview & Snapshot

  10.6.5.2 Product/Service Portfolio

  10.6.5.3 Key Company Financials

  10.6.5.4 SWOT Analysis

 10.6.6 Saint-Gobain

  10.6.6.1 Company Overview & Snapshot

  10.6.6.2 Product/Service Portfolio

  10.6.6.3 Key Company Financials

  10.6.6.4 SWOT Analysis

 10.6.7 FANUC Corporation

  10.6.7.1 Company Overview & Snapshot

  10.6.7.2 Product/Service Portfolio

  10.6.7.3 Key Company Financials

  10.6.7.4 SWOT Analysis

 10.6.8 Jekko S.p.A.

  10.6.8.1 Company Overview & Snapshot

  10.6.8.2 Product/Service Portfolio

  10.6.8.3 Key Company Financials

  10.6.8.4 SWOT Analysis

 10.6.9 GlasLift

  10.6.9.1 Company Overview & Snapshot

  10.6.9.2 Product/Service Portfolio

  10.6.9.3 Key Company Financials

  10.6.9.4 SWOT Analysis

 10.6.10 Hilti Group

  10.6.10.1 Company Overview & Snapshot

  10.6.10.2 Product/Service Portfolio

  10.6.10.3 Key Company Financials

  10.6.10.4 SWOT Analysis

 10.6.11 Schmalz GmbH

  10.6.11.1 Company Overview & Snapshot

  10.6.11.2 Product/Service Portfolio

  10.6.11.3 Key Company Financials

  10.6.11.4 SWOT Analysis

 10.6.12 Hird Ltd.

  10.6.12.1 Company Overview & Snapshot

  10.6.12.2 Product/Service Portfolio

  10.6.12.3 Key Company Financials

  10.6.12.4 SWOT Analysis

 10.6.13 Bohle AG

  10.6.13.1 Company Overview & Snapshot

  10.6.13.2 Product/Service Portfolio

  10.6.13.3 Key Company Financials

  10.6.13.4 SWOT Analysis

 10.6.14 Vitrum Glass Group

  10.6.14.1 Company Overview & Snapshot

  10.6.14.2 Product/Service Portfolio

  10.6.14.3 Key Company Financials

  10.6.14.4 SWOT Analysis

 10.6.15 Z-Lift

  10.6.15.1 Company Overview & Snapshot

  10.6.15.2 Product/Service Portfolio

  10.6.15.3 Key Company Financials

  10.6.15.4 SWOT Analysis

 10.6.16 GGR Group

  10.6.16.1 Company Overview & Snapshot

  10.6.16.2 Product/Service Portfolio

  10.6.16.3 Key Company Financials

  10.6.16.4 SWOT Analysis

 10.6.17 Wood's Powr-Grip

  10.6.17.1 Company Overview & Snapshot

  10.6.17.2 Product/Service Portfolio

  10.6.17.3 Key Company Financials

  10.6.17.4 SWOT Analysis

 10.6.18 Vacuworx

  10.6.18.1 Company Overview & Snapshot

  10.6.18.2 Product/Service Portfolio

  10.6.18.3 Key Company Financials

  10.6.18.4 SWOT Analysis

 10.6.19 Baubot

  10.6.19.1 Company Overview & Snapshot

  10.6.19.2 Product/Service Portfolio

  10.6.19.3 Key Company Financials

  10.6.19.4 SWOT Analysis

 10.6.20 Kranlyft Group

  10.6.20.1 Company Overview & Snapshot

  10.6.20.2 Product/Service Portfolio

  10.6.20.3 Key Company Financials

  10.6.20.4 SWOT Analysis

11. Analyst Recommendations

 11.1 SNS Insider Opportunity Map

 11.2 Industry Low-Hanging Fruit Assessment

 11.3 Market Entry & Growth Strategy

 11.4 Analyst Viewpoint & Suggestions On Market Growth

12. Assumptions

13. Disclaimer

14. Appendix

 14.1 List Of Tables

 14.2 List Of Figures

Key Segments: 

By Product Type

  • Automated Glass Handling Robots

  • Glass Installation Drones

  • Collaborative Robots

  • Others

By Application

  • Residential

  • Commercial

  • Industrial

  • Infrastructure

By Automation Level

  • Fully Automated

  • Semi-Automated

By End-User

  • Construction Companies

  • Glass Manufacturers

  • Renovation & Maintenance Service Providers

  • Others

Request for Segment Customization as per your Business Requirement: Segment Customization Request

Regional Coverage:

North America

  • US

  • Canada

Europe

  • Germany

  • UK

  • France

  • Italy

  • Spain

  • Russia

  • Poland

  • Rest of Europe

Asia Pacific

  • China

  • India

  • Japan

  • South Korea

  • Australia

  • ASEAN Countries

  • Rest of Asia Pacific

Middle East & Africa

  • UAE

  • Saudi Arabia

  • Qatar

  • South Africa

  • Rest of Middle East & Africa

Latin America

  • Brazil

  • Argentina

  • Mexico

  • Colombia

  • Rest of Latin America

Request for Country Level Research Report: Country Level Customization Request

Available Customization 

With the given market data, SNS Insider offers customization as per the company’s specific needs. The following customization options are available for the report: 

  • Detailed Volume Analysis 

  • Criss-Cross segment analysis (e.g. Product X Application) 

  • Competitive Product Benchmarking 

  • Geographic Analysis 

  • Additional countries in any of the regions 

  • Customized Data Representation 

  • Detailed analysis and profiling of additional market players

An accurate research report requires proper strategizing as well as implementation. There are multiple factors involved in the completion of good and accurate research report and selecting the best methodology to compete the research is the toughest part. Since the research reports we provide play a crucial role in any company’s decision-making process, therefore we at SNS Insider always believe that we should choose the best method which gives us results closer to reality. This allows us to reach at a stage wherein we can provide our clients best and accurate investment to output ratio.

Each report that we prepare takes a timeframe of 350-400 business hours for production. Starting from the selection of titles through a couple of in-depth brain storming session to the final QC process before uploading our titles on our website we dedicate around 350 working hours. The titles are selected based on their current market cap and the foreseen CAGR and growth.


The 5 steps process:

Step 1: Secondary Research:

Secondary Research or Desk Research is as the name suggests is a research process wherein, we collect data through the readily available information. In this process we use various paid and unpaid databases which our team has access to and gather data through the same. This includes examining of listed companies’ annual reports, Journals, SEC filling etc. Apart from this our team has access to various associations across the globe across different industries. Lastly, we have exchange relationships with various university as well as individual libraries.

Secondary Research

Step 2: Primary Research

When we talk about primary research, it is a type of study in which the researchers collect relevant data samples directly, rather than relying on previously collected data.  This type of research is focused on gaining content specific facts that can be sued to solve specific problems. Since the collected data is fresh and first hand therefore it makes the study more accurate and genuine.

We at SNS Insider have divided Primary Research into 2 parts.

Part 1 wherein we interview the KOLs of major players as well as the upcoming ones across various geographic regions. This allows us to have their view over the market scenario and acts as an important tool to come closer to the accurate market numbers. As many as 45 paid and unpaid primary interviews are taken from both the demand and supply side of the industry to make sure we land at an accurate judgement and analysis of the market.

This step involves the triangulation of data wherein our team analyses the interview transcripts, online survey responses and observation of on filed participants. The below mentioned chart should give a better understanding of the part 1 of the primary interview.

Primary Research

Part 2: In this part of primary research the data collected via secondary research and the part 1 of the primary research is validated with the interviews from individual consultants and subject matter experts.

Consultants are those set of people who have at least 12 years of experience and expertise within the industry whereas Subject Matter Experts are those with at least 15 years of experience behind their back within the same space. The data with the help of two main processes i.e., FGDs (Focused Group Discussions) and IDs (Individual Discussions). This gives us a 3rd party nonbiased primary view of the market scenario making it a more dependable one while collation of the data pointers.

Step 3: Data Bank Validation

Once all the information is collected via primary and secondary sources, we run that information for data validation. At our intelligence centre our research heads track a lot of information related to the market which includes the quarterly reports, the daily stock prices, and other relevant information. Our data bank server gets updated every fortnight and that is how the information which we collected using our primary and secondary information is revalidated in real time.

Data Bank Validation

Step 4: QA/QC Process

After all the data collection and validation our team does a final level of quality check and quality assurance to get rid of any unwanted or undesired mistakes. This might include but not limited to getting rid of the any typos, duplication of numbers or missing of any important information. The people involved in this process include technical content writers, research heads and graphics people. Once this process is completed the title gets uploader on our platform for our clients to read it.

Step 5: Final QC/QA Process:

This is the last process and comes when the client has ordered the study. In this process a final QA/QC is done before the study is emailed to the client. Since we believe in giving our clients a good experience of our research studies, therefore, to make sure that we do not lack at our end in any way humanly possible we do a final round of quality check and then dispatch the study to the client.