Semiconductor Liquid Waste Treatment Market Size Analysis:
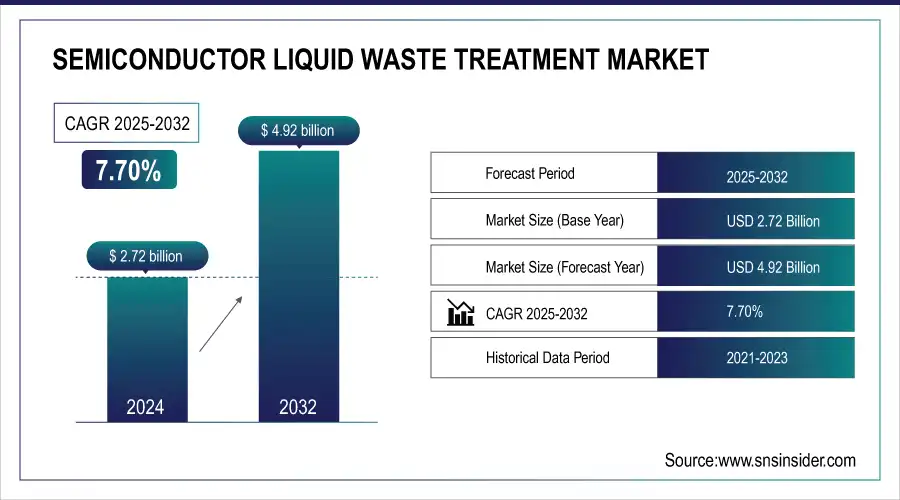
The Semiconductor Liquid Waste Treatment Market size was valued at USD 2.72 billion in 2024 and is projected to reach USD 4.92 billion by 2032, growing at a CAGR of 7.70% during 2025 to 2032.
To Get more information On Semiconductor Liquid Waste Treatment Market - Request Free Sample Report
The semiconductor liquid waste treatment market is experiencing robust growth driven by rising environmental concerns, stringent environmental legislation, and growing semiconductor production in the world. The company serves applications for the treatment of complex liquid waste generated in production processes, including etch, strip, and deposition. The major types of waste include acids, bases, metals, and organic solvents. Chemical, physical, and biological process options are used to meet compliance and sustainability needs. The users are semiconductor producers and recycling and disposal firms. Market dynamics are affected by several aspects, such as technological progress and increased concern on water reuse and zero liquid discharge.
Samsung will process 400 million liters of wastewater a day at the Hwaseong-based facility to produce ultrapure water for chipping as part of efforts to cope with increasing water usage and eco-friendly trends.
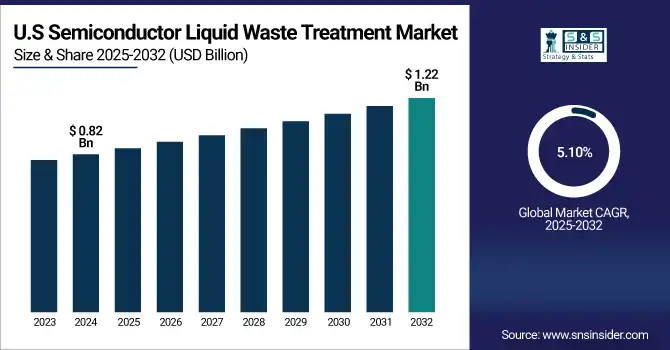
The U.S. semiconductor liquid waste treatment market size was valued at USD 0.82 billion in 2024 and projected to reach USD 1.22 billion by 2032 expanding at a CAGR of 5.10%. Demand is rising as agencies, such as the E.P.A. enact strict policies for the environment. The new regulations need hazardous liquids to be treated and disposed of in a certain manner, which is why, semiconductor manufacturers reach into their pockets to deploy these treatment technologies in an effort to ensure they are in compliance with the law and good corporate citizens.
Semiconductor Liquid Waste Treatment Market Dynamics:
Drivers:
-
Shift Toward Sustainable Solutions in Semiconductor Liquid Waste Treatment Drive Market Growth
A key driver in the semiconductor liquid waste treatment market growth is the rising demand for sustainable and efficient technologies to manage hazardous chemical waste generated during chip production. Due to increasing strict global legislations on the environment, there is a growing demand on the semiconductor industry, to recycle waste in an environment friendly way. Conventional methods, such as neutralization and incineration, are energy-intensive and environmentally caused pollution. This has led to the growth of circular economy technologies including advanced filtration technologies and chemical recovery systems, which help in waste minimization and can be effectively reused in the enterprise thereby aiding their sustainability policy and ultimately boosting the market for the waste treatment solutions.
Memsift Innovations and SIT developed advanced Nano filtration membranes for the recovery of >90% valuable chemicals from semiconductor wastewater, offering a sustainable solution instead of current treatment.
Restraints:
-
Operational Downtime During Semiconductor Impede Liquid Waste Treatment Technology Implementation
The down time during future implementation of new wastewater treatment technologies will be a major concern to semiconductor manufacturers. Suspending production while updating or installing advanced treatment systems can disrupt production schedules and result in decreased production. This period of non-use reduces revenue generation and delays the implementation of environmentally friendly options. For industries, such as food and beverages, finding the right time for upgrades is a challenge due to excessive production downtime, which causes significant financial losses. The risk of down time can further result in higher costs and longer implementation timelines.
Opportunities:
-
Eco-Friendly Tungsten Recovery Create Opportunities for the Semiconductor Liquid Waste Treatment Market Growth
Rising need for semiconductor production is expected to drive the market for sustainability of semiconductor liquid waste treatment. This move toward green initiatives creates an opportunity for the recovery of critical materials such as tungsten from semiconductor waste. By incorporating advanced and sustainable extraction techniques, manufacturers can limit waste, reduce operational costs, and make their process more resource efficient. Furthermore, eco-friendly recovery technology could not only get rid of the environmental threats, but also produce the economical requires with the process of semiconductor wastewater treatment. The tungsten recovery and recycling from semiconductor waste fits in the circular economy paradigm and to the sustainable manufacturing.
Research on Environmentally-Friendly Recycling of Tungsten from Waste Semiconductor says that, the result of the current recovery test shows the recovery rates being better by 7% of that by case. The progress is a green and sustainable way of transforming industrial waste into useful resources, and thus environment-friendly.
Challenges:
-
Balancing Water Reuse with Maintaining Semiconductor Production Quality Presents a Significant Challenge
While recycling water can reduce costs and environmental impact, the purity of the water must meet strict standards to ensure the production of high-quality semiconductors. Advanced filtering and purification systems are necessary for the water to be reused without sacrificing its quality for the manufacturing process. These technologies are required to treat difficult contaminants in a manner that can be challenging and resource and cost intensive for manufacturers as they re-design their production systems to accommodate new water treatment processes.
Semiconductor Liquid Waste Treatment Market Segmentation Analysis:
By Treatment Method
The chemical wastewater treatment segment held a dominant semiconductor liquid waste treatment market share of around 49% in 2024. This expansion is propelled by the increasing demand for the treatment of the hazardous chemical waste produced through the semiconductor manufacturing which require the effective treatment processes.
The physical wastewater treatment segment is projected to experience fastest growth in the market during 2025-2032, at a CAGR of 9.11%. This growth is driven by the growing need for more sophisticated filtration and separation systems to efficiently control and treat waste water and to limit contamination and meet semiconductor manufacturing specifications.
By Waste Composition
Acid and alkali wastewater segment held a dominant semiconductor liquid waste treatment market share of around 50% in 2024. The growth is driven by the generation of acidic and alkaline waste disposal during the process of etching and cleansing in the production of chips, which need special treatment systems in order to comply with environment protection and operation safety.
The heavy metal wastewater segment is projected to experience fastest growth in the market during 2025-2032, at a CAGR of 8.58%. Rising number of applications, growing burden of several toxic metals, such as arsenic, lead, and cadmium, that can be found in the disposal tailings requiring advanced treatment for safe disposal, are subject to increasingly stringent environmental legislations.
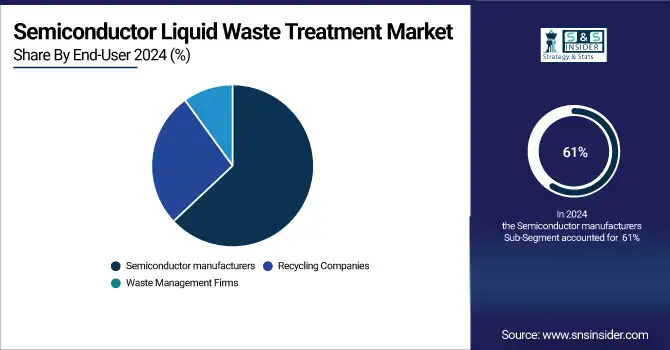
By End-User
Semiconductor manufacturers segment held a dominant semiconductor liquid waste treatment market share of around 61% in 2024 and is projected to experience fastest growth in the market during 2025-2032, at a CAGR of 8.58%. The segment’s expansion is driven by the increasing demand from the tremendous amount of wastewater generated in chip production that need to be treated to a high standard. Tight environment norms, rising semiconductor manufacturing, and industry’s active response to reduce its carbon/environmental footprint and ensure operational sustainability are other important factors leading to the growth.
Semiconductor Liquid Waste Treatment Market Regional Outlook:
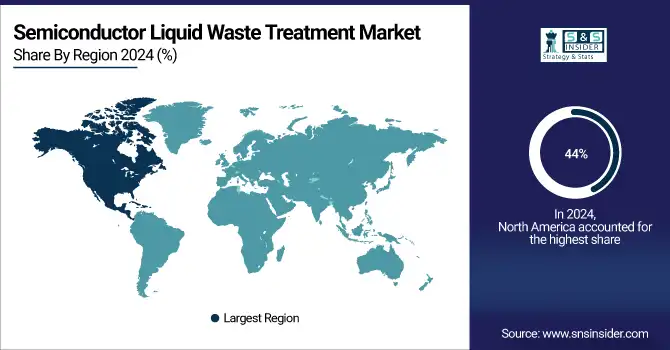
North America dominated the market with a substantial revenue share of approximately 44% in 2024, driven by a strong presence of semiconductor manufacturers, advanced infrastructure, and stringent environmental regulations. The region’s focus on sustainable production, coupled with substantial investments in wastewater treatment technologies, continues to support market leadership and accelerate the adoption of eco-friendly waste management solutions. The U.S. plays a key role in driving rapid development in the regional market.
Get Customized Report as per Your Business Requirement - Enquiry Now
Recent advancements in energy-efficient semiconductor technologies, such as improved phase-change memory (PCM) by the U.S. researchers, are expected to reduce waste generation. This aligns with the U.S. semiconductor industry's growing emphasis on eco-friendly waste management and sustainability in manufacturing processes.
The Asia Pacific is the fastest-growing region in the market, and is projected to expand at a CAGR of 36.02% during 2025-2032. This growth is attributed to rapid industrialization, emergence of semiconductor fabrication plants in countries, such as china, South korea, Taiwan and rising regulatory norms making the demand strong for advanced waste treatment systems.
In 2024, China held a significant share of the semiconductor liquid waste treatment market, driven by its robust semiconductor manufacturing capacity, rising environmental regulations, and strong government support for sustainable technologies.
In 2024, Europe emerged as a promising region in the semiconductor liquid waste treatment market, driven by increasing adoption of artificial intelligence, stringent data privacy policies, and robust government support for sustainable technologies. This growth is being driven mainly by countries, such as Germany and France, which are placing a heavy emphasis on eco-friendly manufacturing and innovative waste management strategies.
LATAM and MEA is experiencing steady growth in the semiconductor liquid waste treatment market. The increase can be attributed to rising environmental awareness, changing government regulations, and the expansion of end-user industries that has made advanced domestic and industrial wastewater treatment systems increasingly applicable in the region.
Key Players:
The semiconductor liquid waste treatment market companies include Veolia North America, AECOM, Thermo Fisher Scientific, SUEZ Water Technologies & Solutions, Applied Materials, Mitsubishi Chemical Corporation, Hach Company, Dow Inc., Entegris, Inc., and Pall Corporation and Others.
Recent Development:
-
April 2024, Veolia Water Technologies is enabling continuous recycling and reuse of water throughout the manufacturing process with its sustainable water recovery and recycling services, and energy efficient, environmentally-friendly options to support all companies in the sector in meeting their eco-focused targets and maintaining compliance with environmental regulations in general, and in particular for those operating within Taiwan’s semiconductor industry.
-
June 2024, Thermo Fisher Scientific has introduced the SuperCool X Series that cools up to 10% cooler using next generation thermoelectric materials in analytical and medical instrumentation. Laird Thermal Systems competes as well in the semiconductor market, providing precision-engineered thermal management and thermal interface materials for enhanced heat transfer and high performance.
| Report Attributes | Details |
|---|---|
| Market Size in 2024 | USD 2.72 Billion |
| Market Size by 2032 | USD 4.92 Billion |
| CAGR | CAGR of 7.70% From 2025 to 2032 |
| Base Year | 2024 |
| Forecast Period | 2025-2032 |
| Historical Data | 2021-2023 |
| Report Scope & Coverage | Market Size, Segments Analysis, Competitive Landscape, Regional Analysis, DROC & SWOT Analysis, Forecast Outlook |
| Key Segments | • By Treatment Method (Biological Wastewater Treatment, Chemical Wastewater Treatment, Physical Wastewater Treatment) • By Waste Composition(Heavy Metal Wastewater, Organic Wastewater, Acid and Alkali Wastewater) • By End User(Semiconductor Manufacturers, Recycling Companies, Waste Management Firms) |
| Regional Analysis/Coverage | North America (US, Canada, Mexico), Europe (Germany, France, UK, Italy, Spain, Poland, Turkey, Rest of Europe), Asia Pacific (China, India, Japan, South Korea, Singapore, Australia, Rest of Asia Pacific), Middle East & Africa (UAE, Saudi Arabia, Qatar, South Africa, Rest of Middle East & Africa), Latin America (Brazil, Argentina, Rest of Latin America) |
| Company Profiles | The Semiconductor Liquid Waste Treatment market companies include Veolia North America, AECOM, Thermo Fisher Scientific, SUEZ Water Technologies & Solutions, Applied Materials, Mitsubishi Chemical Corporation, Hach Company, Dow Inc., Entegris, Inc., and Pall Corporation. |
Get in Touch
