Service Laboratory Market Report Scope & Overview
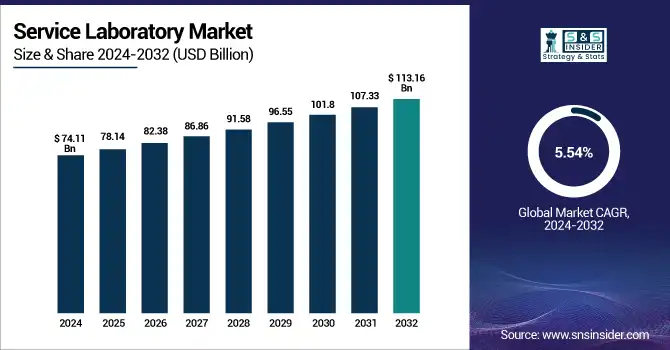
The global service laboratory market in the Information and Communication Technology (ICT) sector is entering a new era of growth and transformation, with USD 74.11 billion in 2024 to USD 113.16 billion by 2032, at a robust CAGR of 5.54%.
ICT service labs are integral to ensure reliability, security, and even innovation of everything from telecom networks to semiconductor chips, as digital infrastructure becomes the backbone of economies. The market grew quickly from 2025-2032, based on the onset of 5G, Internet of Things (IoT), and advanced electronics. What fuels this momentum is the never-ending digital transformation effort, regulatory initiatives, and the convergence of AI, cloud, and edge. With the constant changes in the ICT sector, service laboratories will occupy increasingly strategic positions around the world in terms of global competitiveness, technological leadership, and secure supply chains.
Market Size and Forecast:
-
Market Size in 2024: USD 74.11 Billion
-
Market Size by 2032: USD 113.16 Billion
-
CAGR: 5.54% from 2025 to 2032
-
Base Year: 2024
-
Forecast Period: 2025–2032
-
Historical Data: 2021–2023
For further details, data tables, and visualizations, request the full sample report: Country Level Customization Request
Service Laboratory Market Trends:
-
Increasing demand for advanced testing, calibration, and validation services across telecom, semiconductor, and IT infrastructure sectors is driving market growth.
-
Rapid deployment of 5G networks, IoT devices, and cloud computing solutions is accelerating the need for certified laboratory services.
-
Growing focus on cybersecurity testing, compliance validation, and performance benchmarking is expanding service laboratory capabilities.
-
Rising investments in data centers and next-generation communication technologies are boosting outsourcing of specialized laboratory services.
-
Stringent international quality standards and regulatory certifications are encouraging companies to partner with accredited service laboratories.
-
Technological advancements in automation, AI-based testing tools, and remote laboratory monitoring systems are enhancing operational efficiency and service accuracy.
Why ICT Service Labs Matter?
Service laboratories are the backbone of the ICT ecosystem. They ensure that every chip, device, and network component meets the highest standards of performance, safety, and security. Labs in semiconductors are critical for wafer inspections, reliability testing and lifecycle analysis as the world heats up for chip supremacy. Automotive & Industrial Labs ensure smart vehicles and factories are safe and well-connected, whilst electronics and microelectronics labs certify everything from smartphones to industrial IoT devices. The importance of the nascent service labs is evident in national programs such as India’s PLI scheme for semiconductors and the U.S. CHIPS Act, which specifically give weight to local testing and validation facilities.
Accelerating Growth and Strategic Importance in the ICT Service Laboratory Market
A major force behind this expansion is the explosive growth of digital connectivity. By the end of 2023, the number of global 5G connections had surpassed 1.5 billion, making 5G the fastest-growing mobile broadband technology in history. The GSMA projects that by 2025, 5G networks will cover one-third of the world’s population, fundamentally reshaping mobile communications and service requirements.
Simultaneously, the Internet of Things (IoT) ecosystem is experiencing exponential growth. As of 2024, there are approximately 17.08 billion connected IoT devices worldwide, a figure expected to nearly double to 29.42 billion by 2030. This surge in connected devices is driving an unprecedented need for testing, validation, and security services, as every new device and network node must meet stringent performance and interoperability standards.
Key Industries Shaping ICT Service Laboratory Demand (2024–2025)
-
Semiconductor & Electronics Drive Lab Demand
In Q4 2024, global IC sales grew by 29% YoY, with memory-related capital expenditures up 53% QoQ, fueled by demand for AI and high-performance computing. This surge has amplified the need for advanced testing, validation, and cleanroom services in electronics and semiconductor labs.
-
Cloud and AI Redefine Laboratory Operations
Global spending on public cloud services is projected to hit USD 675.4B in 2024, according to study. ICT labs are rapidly adopting cloud-based LIMS and AI-powered analytics for real-time collaboration, automated testing, and workflow efficiency, essential for distributed R&D environments.
2024 Service Laboratory Market Segmentation Insights
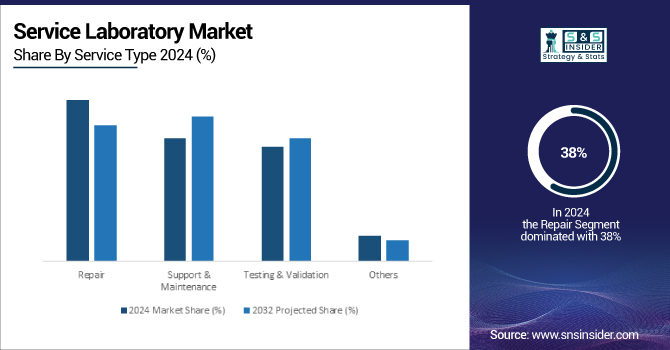
By Service Type
Repair services are currently dominant, reflecting the high turnover and rapid obsolescence of ICT hardware. As devices and networks become more complex, minimizing downtime is critical for telecom operators, data centers, and electronics manufacturers.
Support & Maintenance is the fastest-growing segment, driven by AI-powered predictive maintenance, remote diagnostics, and the need for continuous equipment optimization in smart factories and cloud data hubs.
Testing & Validation remains essential for compliance with global standards (3GPP, IEEE, ISO/IEC), especially as regulatory requirements intensify.
By Deployment
On-premise solutions dominate in highly regulated, security-sensitive environments such as national telecom networks and semiconductor fabs, where data sovereignty and direct control are paramount.
Cloud deployment is the fastest-growing, enabling scalable, collaborative, and cost-effective lab management. Cloud-based LIMS, remote diagnostics, and virtualized test environments are becoming the norm for global ICT labs.
| Deployment | 2024 Market Share (%) | 2032 Projected Share (%) |
|
On-premise |
61% |
xx% |
|
Cloud |
39% |
|
By Channel
Third-party providers are currently dominant, offering cost-effective, specialized solutions and access to advanced equipment.
OEM Service Labs are gaining share as manufacturers bundle certified services with their products, ensuring seamless updates, compliance, and lifecycle management.
| Deployment | 2024 Market Share (%) | 2032 Projected Share (%) |
|
On-premise |
54% |
xx% |
|
Cloud |
46% |
xx% |
By End-User Industry

Telecom & Networking is the largest end-user segment, reflecting the ongoing rollout of 5G, fiber broadband, and IoT networks.
Semiconductor Manufacturing is the fastest-growing, driven by national investments in domestic chip production and the need for advanced validation and failure analysis.
Electronics & Microelectronics and Automotive are also expanding rapidly as the world embraces connected devices and autonomous vehicles.
Regional Insights
North America stands as the undisputed leader in the global service laboratory market, commanding an impressive 40% share in 2024. The United States is the powerhouse, responsible for nearly 88% of the region’s market, due to its advanced ICT infrastructure, world-class R&D, and rapid adoption of cloud and AI-driven laboratory solutions. Canada adds momentum with its investments in digital transformation and telecom innovation. North America’s dominance is further solidified by a robust regulatory environment and a high concentration of top-tier service providers.
According to the U.S. Bureau of Economic Analysis, the ICT sector contributed over USD 2 trillion to U.S. GDP in 2023, illustrating the scale and strategic importance of service laboratories in supporting digital growth and security.

Europe Secures 28% Market Share with Digital Lab Innovation and Green ICT Leadership
Germany, France, and the United Kingdom are at the forefront, leveraging strict regulatory frameworks and a strong focus on laboratory informatics and green ICT practices. The European Commission’s Digital Europe Programme and GDPR have spurred investments in secure, interoperable, and efficient laboratory systems.
Europe’s leadership in research and sustainability is evident, with Eurostat reporting the EU ICT sector generated over €800 billion in value added in 2023. The region’s emphasis on accredited labs and global standards ensures it remains a beacon of excellence in the service laboratory landscape.
Asia Pacific Emerges as Fastest-Growing Market with 24% Share, Powered by 5G, Semiconductors, and Lab Digitalization
China leads the charge, followed closely by Japan, South Korea, and India-all investing heavily in 5G, semiconductor manufacturing, and smart cities. Regional growth is fueled by surging ICT and healthcare spending, government incentives for local production, and rapid adoption of cloud-based lab solutions.
The Ministry of Industry and Information Technology of China notes the country’s ICT sector expanded by over 8% in 2023, while India’s digital economy is set to hit USD 1 trillion by 2026. Asia Pacific’s dynamic innovation ecosystem is attracting global investment and accelerating advances in lab automation and digitalization.
Latin America & MEA: Emerging Market Fueled by ICT Investment and Digital Lab Innovation
Latin America represents a promising 5% of the global service laboratory market in 2024, with Brazil and Mexico leading regional development. The region is on an upward trajectory as both public and private sectors invest in modern lab infrastructure, broadband expansion, and digital health solutions.
According to ECLAC, ICT investments in Latin America surpassed USD 70 billion in 2023, driving the creation of new labs and the integration of AI and cloud technologies. With ongoing regulatory modernization and public health initiatives, Latin America is steadily enhancing its presence and competitiveness in the global laboratory market.
The Middle East & Africa region, while currently holding a 3% share of the global market in 2024, is rapidly building momentum. Countries such as the United Arab Emirates, Saudi Arabia, and South Africa are spearheading national strategies to boost ICT capacity, attract international investment, and expand laboratory networks. The International Telecommunication Union (ITU) reports that internet penetration in the region exceeded 50% in 2023, and ICT spending is forecast to grow at over 7% CAGR through 2027. With targeted investments in public health, telecom, and industrial automation, the region is laying a strong foundation for future expansion in the service laboratory sector.
Key Market Players Include:
-
Keysight Technologies
-
Anritsu Corporation
-
Spirent Communications
-
Tektronix (Fortive)
-
Advantest Corporation
-
Bureau Veritas
-
SGS SA
-
TÜV Rheinland
These organizations are at the forefront of technological adoption, offering advanced automation, and comprehensive laboratory services.
-
Keysight Technologies launched a cloud-based 6G testbed in 2024, enabling global telecom R&D collaboration.
-
Rohde & Schwarz opened an AI-powered EMC lab in Munich in 2025, focusing on next-gen wireless and automotive electronics.
-
Anritsu partnered with leading chipmakers in 2025 to develop quantum device validation protocols, supporting the next wave of semiconductor innovation.
Report Customization
This research report categorizes the Service Laboratory Market for ICT based on Service Type, Deployment, Channel, End-User, Technology, and Region. Market size estimates and forecasts are provided for each segment from 2025 to 2032. Detailed competitive analysis, technology trends, and regional opportunities are included to support strategic decision-making.
Key Takeaways: Market Growth Drivers Snapshot
-
The rollout of 5G networks and the exponential increase in IoT devices have dramatically increased the volume and complexity of testing and validation required. For example, global 5G subscriptions surpassed 1.6 billion in 2024 (GSMA Intelligence), with over 30 billion connected IoT devices worldwide.
-
The global semiconductor industry exceeded USD 600 billion in annual revenue in 2024 (SEMI), with nations investing billions in domestic chip manufacturing and validation labs to secure supply chains and technological sovereignty.
-
Over 60% of enterprises globally now rely on cloud-based infrastructure, driving demand for cloud-enabled lab management and remote validation services.
-
Governments and international bodies have intensified compliance requirements for telecom, electronics, and data security, necessitating advanced laboratory services for certification and ongoing monitoring.
Frequently Asked Questions
Ans: North America dominated the Service Laboratory Market in 2024.
Ans: The “Repair services” segment dominated the Service Laboratory Market.
Ans: Key drivers of the Service Laboratory Market include increasing demand for quality assurance, regulatory compliance, technological advancements, and growth in healthcare, pharmaceuticals, and environmental testing sectors.
Ans: The Service Laboratory was USD 74.11 Billion in 2024 and is expected to Reach USD 113.16 Billion by 2032.
Ans: The Service Laboratory Market is expected to grow at a CAGR of 5.54% during 2025-2032.
Get in Touch
