Public Cloud Market Size & Overview:
Get more information on Public Cloud Market - Request Free Sample Report
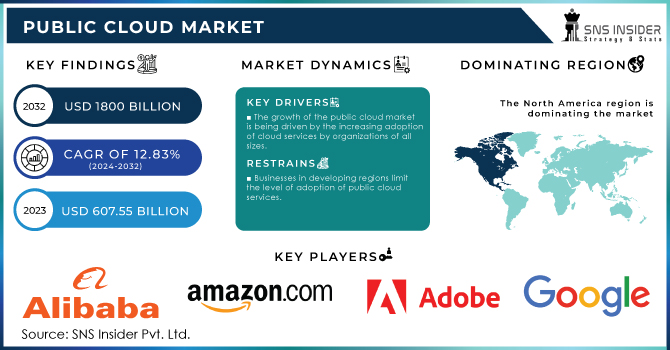
The Public Cloud Market size was USD 607.55 Billion in 2023 and is expected to Reach USD 1800 Billion by 2032 and grow at a CAGR of 12.83% over the forecast period of 2024-2032.
The public cloud market is a rapidly growing industry, with significant projected growth in the coming years. The public cloud market refers to the sector of the cloud computing industry where cloud services are provided by third-party vendors and made available to the general public over the internet. These vendors own and operate the infrastructure required to deliver cloud services, such as computing resources, storage, and networking capabilities. The growing adoption of cloud computing solutions in developing countries is slated to have a positive impact on the industry outlook. Rapid uptake in emerging countries such as India and Singapore due to thriving digitalization and the development of advanced network grid infrastructure is playing a key role in establishing cloud-operated businesses. In September 2022, the Government of India announced an investment of USD 30 billion for digital transformation in rural areas that will ensure good quality, high-speed data connectivity across the nation.
AWS is the largest provider of public cloud services and offers a wide range of cloud computing products and services, including computing power, storage, databases, machine learning, and artificial intelligence capabilities. GCP offers a variety of cloud services, including computing power, data storage, data analytics, and machine learning tools. Google has been investing heavily in its cloud infrastructure to compete with AWS and Azure. Whereas private clouds are provided, the vendor often owns and maintains the physical infrastructure. In addition to the advantages of accountability, they may offer a dedicated or shared operating environment that can scale effortlessly as needed. Up-front server purchases are becoming redundant thanks to advantages offered by these services, such as infinite capacity, potentially appealing costs resulting from massive infrastructures and associated operational techniques, and a pay-as-you-go pricing model.
The public cloud market is growing actively, with greater adoption of cloud computing solutions in various industries being one of the factors promoting the development. The U.S. Government Accountability Office informs that spending on public cloud solutions is projected to increase to $148 billion by 2024, which will be 25% greater than the expected spending in 2023. The Government Accountability Office (GAO) also emphasizes that public service providers are currently focused on the improvement of operational efficiency and service quality by utilizing cloud solutions. Meanwhile, many digitalization-oriented strategies, such as the Federal Cloud Computing Strategy, are aimed at the promotion of cloud services use in the framework of federal operations.
Public Cloud Market dynamics
Driver
- Organizations are increasingly adopting public cloud services as a budget-friendly alternative to traditional IT infrastructures, allowing them to allocate resources more effectively while reducing capital expenditures
- The rise of AI and machine learning technologies is driving significant cloud spending as businesses seek to leverage cloud platforms for the development and deployment of AI applications.
- The shift towards remote work has accelerated the adoption of cloud-based collaboration and productivity tools, with organizations relying on public cloud services to facilitate seamless communication and workflow.
The main driver of growth in the public cloud market is the development of artificial intelligence and machine learning technologies. More and more companies are using the public cloud to build and test AI applications. Public clouds are necessary for implementing AI technologies as they leverage big data analytics to make better decisions and optimize workflows. According to recent studies, spending on AI platforms is expected to grow at a significant compound annual growth rate through 2032, illustrating the robust demand for cloud-based AI solutions. Companies in the public and banking sectors use public cloud services to create AI applications that improve customer service and efficiency. Google Cloud and AWS are the two leaders in providing cloud-based AI and ML services that leverage the company’s vast computing infrastructure to make available their algorithms. Information technology companies are actively working on the implementation of AI functions in the cloud to enable automation and more intelligent data management. As the players in the business environment research the accumulated data, they are beginning to better understand the technology’s capabilities and benefits, without using the public cloud for the company’s digitalization, and this transformation is impossible.
Restrain
-
Organizations often hesitate to migrate sensitive data to the cloud due to fears regarding data breaches, compliance with regulations, and the overall security of cloud services.
-
The public cloud model heavily relies on stable internet connections; any disruption in connectivity can hinder access to essential applications and data.
-
Many businesses face challenges in migrating legacy systems to the cloud, which can be time-consuming and complex, often leading to hesitation in adopting public cloud solutions.
The major restraints affecting the public cloud market are data security and compliance concerns. Organizations are increasingly wary of migrating sensitive data to cloud environments due to fears of data breaches and the challenges of meeting regulatory requirements. A recent survey indicated that 83% of IT decision-makers cite security concerns as the primary reason for hesitancy in adopting cloud solutions.
For instance, the 2020 Capital One breach, where the personal data of over 100 million customers was exposed, underscored the vulnerabilities associated with cloud services and heightened awareness about the need for robust security measures. Additionally, industries such as healthcare and finance face stringent compliance regulations, which further complicates cloud adoption. Organizations often find themselves in a dilemma, needing to balance the benefits of cloud computing with the potential risks to their data integrity and privacy.
Public Cloud Market Segmentation
By Services
In the public cloud market, the SaaS segment led in 2023 with a revenue proportion of 53% showing an increase in the dominance of cloud-based software solutions. SaaS platforms not only offer flexibility, ease of use, and reduced IT costs among businesses but also provide organizations with an opportunity to streamline their operations. According to the U.S. Census Bureau, by the end of 2023, approximately 71% of small and medium enterprises use at least one SaaS application.
Conversely, the IaaS segment is projected to have the fastest CAGR during the forecast period. The rapid growth of the IaaS segment can be attributed to the increasing need for virtualized computing solutions and scalable storage services. The U.S. Department of Commerce notes that spending on IaaS will rise at 20% annually since companies want to upgrade their IT infrastructure without heavy capital spending. This growth is indicative of a broader trend where organizations are prioritizing cloud solutions to remain competitive and responsive to changing market dynamics.
By End-Use
The Banking, Financial Services, and Insurance segment dominated the end use of the global public cloud industry in 2023. The BFSI segment accounted for around 30% of the market share as the need to improve data security, compliance, and enhanced customer engagement drives adoption rates. Government statistics offered by the Federal Reserve indicate that 80% of financial institutions have adopted cloud solutions as a way of enhancing operational efficiency and improving customer service delivery.
On the other hand, the manufacturing segment is expected to register the fastest CAGR from 2024 to 2032. The growth will be driven by a rising need for real-time data analytics in conjunction with automation of production processes. According to the U.S. Bureau of Economic Analysis, in the previous year, cloud adoption in manufacturing has risen by 35% as players focus on leveraging cloud technologies to optimize supply chain management and boost productivity.
Regional Analysis
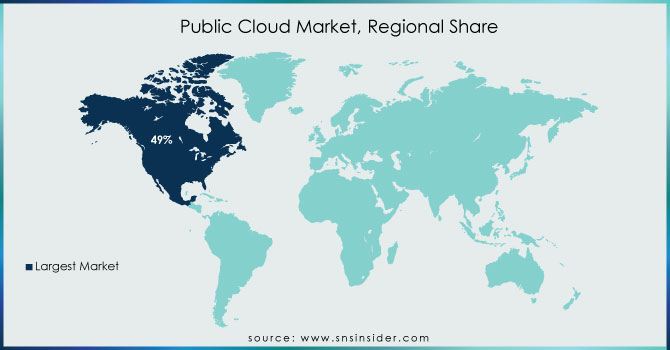
North America dominated the market in 2023 with 49% of the total. In 2023, North America captured the largest share of the public cloud market, driven by the rapid adoption of cloud computing in the US and Canada. The region is home to top vendors such as Adobe, Salesforce, Oracle, AWS, Google, and IBM. North America is experiencing significant technological innovations in cloud computing Due to the early adoption of the technology. It is anticipated that the presence of multiple vendors in the region, including IBM Corporation, Amazon.com Inc., Oracle Corporation, Microsoft Corporation, and others, as well as a stronger inclination to adopt new technologies, will aid these areas in maintaining their market positions. Additionally, it is predicted that more than 50% of American government entities have implemented the services. Additionally, the European nations have developed into a center for cloud technology development, especially in the banking industry, which draws billions of dollars in investment from all over the world.
The Asia Pacific is probably going to become the market's fastest-growing region in the public cloud market from 2024 to 2032. Recent years have had a significant impact on the expansion of the regional market due to the rapid rise of China and India as well as the emergence of local firms like the Alibaba Group. Additionally, hyper-scale cloud providers like Azure, Amazon Web Services, and Google LLP are developing their data centers in countries like Indonesia and Thailand to accommodate the governments' needs for data sovereignty. The region is characterized by a high adoption rate among small and medium-sized enterprises and increased attention from cloud service providers. Countries like China, Japan, India, and Australia are driving the growth in the Asia Pacific region. There is a strong shift towards cloud technologies in the Asia Pacific, with overall cloud spending expected to reach USD 200 billion in the region. This trend is driven by the need for digital transformation and the adoption of cloud-native applications by several business sectors, such as banking and supply chain automation.
Need any customization research on Public Cloud Market - Enquiry Now
Key Players
-
Amazon Web Services (AWS) (Amazon EC2, Amazon S3)
-
Microsoft Azure (Azure Virtual Machines, Azure SQL Database)
-
Google Cloud Platform (GCP) (Google Kubernetes Engine, BigQuery)
-
IBM Cloud (IBM Cloud Kubernetes Service, IBM Watson)
-
Oracle Cloud (Oracle Cloud Infrastructure, Oracle Autonomous Database)
-
Alibaba Cloud (Elastic Compute Service, Alibaba Cloud Storage)
-
Salesforce (Salesforce Customer 360, Salesforce Einstein)
-
VMware (VMware Cloud on AWS, VMware vCloud Director)
-
DigitalOcean (Droplets, App Platform)
-
SAP Cloud (SAP Business Technology Platform, SAP Analytics Cloud)
-
Cisco (Cisco Webex, Cisco AppDynamics)
-
Huawei Cloud (Cloud Container Engine, Huawei Cloud Database)
-
Red Hat (Red Hat OpenShift, Red Hat Ansible Automation)
-
Rackspace Technology (Rackspace Managed Cloud, Rackspace Cloud Backup)
-
Zendesk (Zendesk Support Suite, Zendesk Sunshine)
-
Mendix (Mendix Low-Code Platform, Mendix Cloud)
-
ServiceNow (ServiceNow IT Service Management, ServiceNow Cloud Management)
-
Atlassian (Jira Cloud, Confluence Cloud)
-
Dropbox (Dropbox Business, Dropbox Paper)
-
Box (Box Platform, Box Governance) and others.
Recent News
-
In August 2024, Microsoft announced its partnership with several American federal agencies, such as defence, to support their transition into cloud computing. This collaboration will be supported by Microsoft’s Azure cloud to facilitate data management and provide operational support.
-
Amazon Web Services has announced that the company is increasing its cloud services with new data centers in the U.S. The new resources will accommodate for the expanding demand for cloud solutions and improve service delivery.
-
In May 2024, Huawei Cloud Computing Technologies Co., Ltd., along with Telecom Egypt, became the presenter of the first Huawei public cloud disk launched in the country and Northern Africa. This platform establishes the services at the local company’s data centers and uses its 14 submarine cable systems to cover up to 60 countries.
-
In July 2024, Google Cloud unveiled new security features aimed at strengthening data protection for its public cloud customers, responding to increasing cybersecurity concerns highlighted by government reports.
-
In April 2023, VMware Cross-Cloud expands with the launch of VMware Cross-Cloud Managed Services. This initiative brings new benefits to partners and customers and simplifies obtaining access to managed services. The move will ensure greater profitability for VMware’s 4,000-plus cloud service providers supporting thousands of clients globally.
| Report Attributes | Details |
| Market Size in 2023 | US$ 607.55 Bn |
| Market Size by 2032 | US$ 1800 Bn |
| CAGR | CAGR of 12.83% From 2024 to 2032 |
| Base Year | 2023 |
| Forecast Period | 2024-2032 |
| Historical Data | 2020-2022 |
| Report Scope & Coverage | Market Size, Segments Analysis, Competitive Landscape, Regional Analysis, DROC & SWOT Analysis, Forecast Outlook |
| Key Segments | • By Service(Infrastructure as a Service (IaaS), Platform as a Service (PaaS), Software as a Service (SaaS)) • By Enterprise Size(SMEs, Large Enterprises) • By End Use(BFSI, IT & Telecom, Retail & Consumer Goods, Manufacturing, Energy & Utilities, Healthcare, Media & Entertainment, Government & Public Sector, Others) |
| Regional Analysis/Coverage | North America (US, Canada, Mexico), Europe (Eastern Europe [Poland, Romania, Hungary, Turkey, Rest of Eastern Europe] Western Europe] Germany, France, UK, Italy, Spain, Netherlands, Switzerland, Austria, Rest of Western Europe]). Asia Pacific (China, India, Japan, South Korea, Vietnam, Singapore, Australia, Rest of Asia Pacific), Middle East & Africa (Middle East [UAE, Egypt, Saudi Arabia, Qatar, Rest of Middle East], Africa [Nigeria, South Africa, Rest of Africa], Latin America (Brazil, Argentina, Colombia Rest of Latin America) |
| Company Profiles |
Amazon Web Services (AWS), Microsoft Azure, Google Cloud Platform (GCP), IBM Cloud, Oracle Cloud, Alibaba Cloud, Salesforce, VMware, SAP Cloud, Cisco, Huawei Cloud, Red Hat, Rackspace Technology, Zendesk |
| Key Drivers | •Organizations are increasingly adopting public cloud services as a budget-friendly alternative to traditional IT infrastructures, allowing them to allocate resources more effectively while reducing capital expenditure •The rise of AI and machine learning technologies is driving significant cloud spending as businesses seek to leverage cloud platforms for the development and deployment of AI applications •The shift towards remote work has accelerated the adoption of cloud-based collaboration and productivity tools, with organizations relying on public cloud services to facilitate seamless communication and workflow |
| Market Restraints | •Organizations often hesitate to migrate sensitive data to the cloud due to fears regarding data breaches, compliance with regulations, and the overall security of cloud services •The public cloud model heavily relies on stable internet connections; any disruption in connectivity can hinder access to essential applications and data •Many businesses face challenges in migrating legacy systems to the cloud, which can be time-consuming and complex, often leading to hesitation in adopting public cloud solutions. |
Frequently Asked Questions
Software as a Service accounted for the largest market share of 54.8% in 2023 owing to its flexible costs, easy maintenance, and enterprise size. Moreover, user spending on business intelligence SaaS applications, growth of technologies such as machine learning, and IoT will also propel the growth of the market
Amazon Web Services is the biggest cloud provider in the world. After AWS, Microsoft Azure and Google Cloud Platform are the biggest cloud companies by revenue and market share. Collectively, these three companies capture more than 65% of the total spending on cloud services.
Businesses in developing regions limit the level of adoption of public cloud services.
The Public Cloud Market size is estimated to reach USD 1800 Billion by 2032.
The Public Cloud Market is to grow at a CAGR of 12.83% From 2024 to 2032.
The North American region dominated the Public Cloud Market in 2023.
Yes, you can customize the report as per your requirements.
Get in Touch
