Get More Information About This Research Report - Request For Sample Report
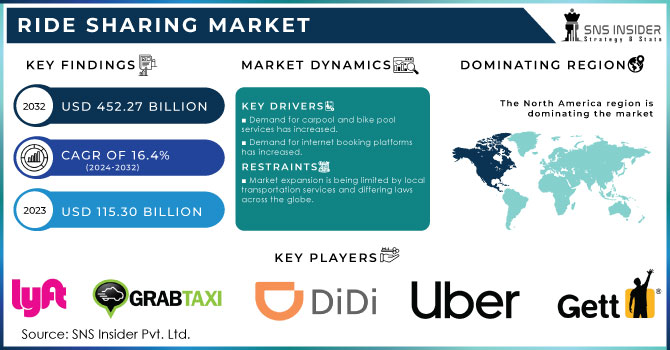
Ride Sharing Market Size was valued at USD 115.30 billion in 2023 and is expected to reach USD 452.27 billion by 2032 and grow at a CAGR of 16.4% over the forecast period 2024-2032.
Ride sharing is the act of sharing a ride with another passenger, preferably in the same direction. It can be used by numerous travelers on a shared basis. There is usually a middleman that provides an app that allows riders and drivers to find and connect in order to use these ride-share services. A passenger can schedule a shared ride through the use of e-hailing, which is short for electronic hailing, by making a phone call and sending a text message, or by going to the actual location of the service provider and using the internet to access a smartphone application or website. Taxis and cabs are available for passengers to reserve or hire for predetermined trips along routes that the passenger establishes in advance. The ride-sharing market came into being at the confluence of key factors urbanization that led to increased traffic congestion and a lack of proper parking options for personal car owners, coupled with millennial preferences toward experiences rather than ownership a push for wanting easy hassle-free transport. Further, rising fuel prices and improved environmental consciousness increasingly drove consumers toward shared mobility solutions. Many US ride-sharing consumers, especially within cities, have chosen ride-sharing services because it is felt that public transit offerings are inadequate, making up over 40% of riders. Furthermore, realizing real-time tracking, fare estimates, and cashless payments, technology has made this process more user-friendly, which in turn will help promote market growth.
Ride-sharing services typically make use of passenger cars, motorbikes, scooters, minivans, vans, buses and coaches, auto-rickshaws, and other types of vehicles. Ride-sharing is a relatively new concept in the mobility sector that has grown in popularity alongside car-sharing, car-hailing, and carpooling. The ride-sharing system operates by people offering and accepting rides at the driver's convenience. Ride-sharing makes short and lengthy travels easier by providing one-way and two-way rides. Because many people in economically developing countries do not own cars, they rely on car-hailing services.
MARKET DYNAMICS:
KEY DRIVERS:
Demand for carpool and bike pool services has increased.
Demand for internet booking platforms has increased.
The rise in the cost of owning a car is expected to propel the market forward.
The growing expenses associated with owning a car act as a significant changing force for the ride-sharing market. The rising cost of vehicles, insurance premium prices, fuel prices, and maintenance are reducing the attractiveness of owning cars, particularly in urban areas. Another trend picking up steam is that millennials and Generation Z are increasingly opting for car-less lives. For instance, in the US, there has been a 5% rise in the use of public transport in the past two years, which shows a changing preference in transport. As more and more remote work is adopted, the necessity of commuting daily has decreased, hence reliance on personal vehicles has decreased.
RESTRAINTS:
Improvement of the public transportation system.
Market expansion is being limited by local transportation services and differing laws across the globe.
The presence of ride-sharing services usually provokes strong reactions from well-established taxi markets through protests and lawsuits, creating entry barriers. For instance, traditional taxi medallions in New York City have lost more than 90% of their value since the entry of Uber and Lyft—just one case of the disruptiveness to incumbent players. Beyond these challenges, regulations vary in many countries for ride-sharing firms. The US has been a lead market, with more than 70% of Americans claiming familiarity with ride-sharing, but tighter regulation in Europe and Asia has inhibited the pace of expansion.
Market, By Type:
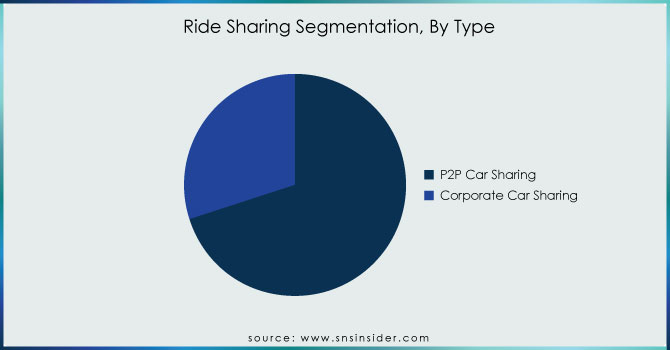
The global market has been divided into P2P car sharing, and Corporate Car Sharing based on the type segment. It is expected that the P2P car-sharing segment would lead the car-sharing market. P2P car sharing is a sort of vehicle sharing in which users share their automobiles with other travelers. A further benefit of the P2P approach is that the owner is present in the vehicle at all times.
Get Customized Report as per your Business Requirement - Request For Customized Report
Market, By Service Type:
The global market has been divided into E-hailing, Car sharing, Station-based mobility, and Car rental based on the service type segment. During the projected period, the e-hailing segment is expected to be the largest ride-sharing market. E-expanding hailing's popularity can be ascribed to a variety of factors, including the convenience of online reservations, increasing traffic congestion, improved passenger experience, and increased government efforts to raise public awareness about the dangers of air pollution.
Market, By Distance:
The global market has been divided into Long Distance, and Short Distance based on the commute type segment. Short-distance and corporate commutes are expected to dominate the market. However, because of the increasing tendency of ride-hailing platform providers to delve into these services through their current platforms, the short distance type is expected to lead during the projected period.
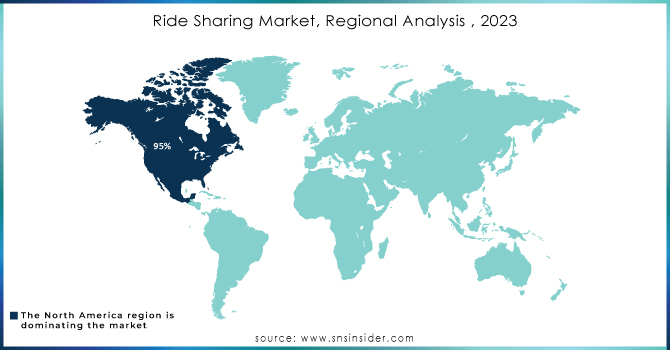
North America was the most successful region, with the United States accounting for approximately 95% of the regional market share. On the other hand, it is projected that Asia would eventually overtake North America within the period of the forecast. Due to the region's huge number of cities and towns that are undergoing fast urbanization, Asia is a prospective market for ride-sharing services. China and India, the two most populous countries in the world, both call this area of the world their home. China already holds a dominant position in the market for ride-hailing services and is expected to experience explosive growth in ride-sharing over the course of the projection period.
Although India has had healthy expansion over the past few years, the business sector there has not yet made the most of the opportunities presented by the country. There is still some resistance to the idea being implemented in some European nations, like Germany, therefore the content is not yet fully functional. Over the course of the past ten years, developed nations such as the United Kingdom and France have enthusiastically adopted platforms for sharing four-wheelers and bicycles.
KEY PLAYERS:
Uber Technologies Inc. (U.S.), Gett, Lyft Inc. (U.S.), Didi Chuxing Technology Co. (China), GrabTaxi Holdings Pte. Ltd. (Singapore), car2go (Germany), Cabify (Spain), Careem (UAE), Bolt Technology, Zimride are some of the affluent competitors with significant market share in the Ride Sharing Market.
Report Attributes | Details |
---|---|
Market Size in 2023 | US$ 115.30 Billion |
Market Size by 2032 | US$ 452.27 Billion |
CAGR | CAGR of 16.4% From 2024 to 2032 |
Base Year | 2023 |
Forecast Period | 2024-2032 |
Historical Data | 2020-2022 |
Report Scope & Coverage | Market Size, Segments Analysis, Competitive Landscape, Regional Analysis, DROC & SWOT Analysis, Forecast Outlook |
Key Segments |
|
Regional Analysis/Coverage | North America (US, Canada, Mexico), Europe (Eastern Europe [Poland, Romania, Hungary, Turkey, Rest of Eastern Europe] Western Europe] Germany, France, UK, Italy, Spain, Netherlands, Switzerland, Austria, Rest of Western Europe]), Asia Pacific (China, India, Japan, South Korea, Vietnam, Singapore, Australia, Rest of Asia Pacific), Middle East & Africa (Middle East [UAE, Egypt, Saudi Arabia, Qatar, Rest of Middle East], Africa [Nigeria, South Africa, Rest of Africa], Latin America (Brazil, Argentina, Colombia, Rest of Latin America) |
Company Profiles |
Uber Technologies Inc. (U.S.), Gett, Lyft Inc. (U.S.), Didi Chuxing Technology Co. (China), GrabTaxi Holdings Pte. Ltd. (Singapore), car2go (Germany), Cabify (Spain), Careem (UAE), Bolt Technology, Zimride |
Key Drivers | •Demand for carpool and bike pool services has increased. •Demand for internet booking platforms has increased. |
RESTRAINTS | •Improvement of the public transportation system. •Market expansion is being limited by local transportation services and differing laws across the globe. |
Ans:- The market forecast period is 2024-2031 according to the study report.
Ans;- Ride sharing is the act of sharing a ride with another passenger, preferably in the same direction.
Ans:- Progress on Robo-cabs & Eco-friendly electric cab services are projected are the most promising aspects/opportunities of the market.
Ans:- The e-hailing segment is expected to see the most significant growth.
Ans:- Raw material vendors, Distributors/traders/wholesalers/suppliers, Regulatory authorities, government agencies and NGOs, Commercial research & development (R&D) institutions, Trade/Industrial associations, and End-use industries are the stakeholder of this report.
Table of Contents:
1. Introduction
1.1 Market Definition
1.2 Scope (Inclusion and Exclusions)
1.3 Research Assumptions
2. Executive Summary
2.1 Market Overview
2.2 Regional Synopsis
2.3 Competitive Summary
3. Research Methodology
3.1 Top-Down Approach
3.2 Bottom-up Approach
3.3. Data Validation
3.4 Primary Interviews
4. Market Dynamics Impact Analysis
4.1 Market Driving Factors Analysis
4.1.1 Drivers
4.1.2 Restraints
4.1.3 Opportunities
4.1.4 Challenges
4.2 PESTLE Analysis
4.3 Porter’s Five Forces Model
5. Statistical Insights and Trends Reporting
5.1 Vehicle Production and Sales Volumes, 2020-2032, by Region
5.2 Emission Standards Compliance, by Region
5.3 Vehicle Technology Adoption, by Region
5.4 Consumer Preferences, by Region
5.4 Aftermarket Trends (Data on vehicle maintenance, parts, and services)
6. Competitive Landscape
6.1 List of Major Companies, By Region
6.2 Market Share Analysis, By Region
6.3 Product Benchmarking
6.3.1 Product specifications and features
6.3.2 Pricing
6.4 Strategic Initiatives
6.4.1 Marketing and promotional activities
6.4.2 Distribution and supply chain strategies
6.4.3 Expansion plans and new product launches
6.4.4 Strategic partnerships and collaborations
6.5 Technological Advancements
6.6 Market Positioning and Branding
7. Ride Sharing Market Segmentation, by Data Service
7.1 Chapter Overview
7.2 Information Service
7.2.1 Information Service Market Trends Analysis (2020-2032)
7.2.2 Information Service Market Size Estimates and Forecasts to 2032 (USD Billion)
7.3 Navigation
7.3.1 Navigation Market Trends Analysis (2020-2032)
7.3.2 Navigation Market Size Estimates and Forecasts to 2032 (USD Billion)
7.4 Payment
7.4.1 Payment Market Trends Analysis (2020-2032)
.2.2 Payment Market Size Estimates And Forecasts To 2032 (USD Billion)
7.4 Other
7.4.1 Other Market Trends Analysis (2020-2032)
7.4.2 Other Market Size Estimates And Forecasts To 2032 (USD Billion)
8. Ride Sharing Market Segmentation, By Service Type
8.1 Chapter Overview
8.2 Car Sharing
8.2.1 Car Sharing Market Trends Analysis (2020-2032)
8.2.2 Car Sharing Market Size Estimates And Forecasts To 2032 (USD Billion)
8.3 Car Rental
8.3.1 Car Rental Market Trends Analysis (2020-2032)
8.3.2 Car Rental Market Size Estimates And Forecasts To 2032 (USD Billion)
8.4 E-Hailing
8.4.1 E-Hailing Market Trends Analysis (2020-2032)
8.4.2 E-Hailing Market Size Estimates And Forecasts To 2032 (USD Billion)
8.5 Station Based Mobility
8.5.1 Station Based Mobility Market Trends Analysis (2020-2032)
8.5.2 Station Based Mobility Market Size Estimates And Forecasts To 2032 (USD Billion)
9. Ride Sharing Market Segmentation, By Vehicle Type
9.1 Chapter Overview
9.2 ICE Vehicle
9.2.1 ICE Vehicle Market Trends Analysis (2020-2032)
9.2.2 ICE Vehicle Market Size Estimates And Forecasts To 2032 (USD Billion)
9.3 CNG/LPG Vehicle
9.3.1 CNG/LPG Vehicle Market Trends Analysis (2020-2032)
9.3.2 CNG/LPG Vehicle Market Size Estimates And Forecasts To 2032 (USD Billion)
9.4 Electric Vehicle
9.4.1 Electric Vehicle Market Trends Analysis (2020-2032)
9.4.2 Electric Vehicle Market Size Estimates And Forecasts To 2032 (USD Billion)
9.5 Micro Mobility Vehicle
9.5.1 Micro Mobility Vehicle Market Trends Analysis (2020-2032)
9.5.2 Micro Mobility Vehicle Market Size Estimates And Forecasts To 2032 (USD Billion)
9.5.1 Bike/Bicycle
9.5.1.1 Bike/Bicycle Market Trends Analysis (2020-2032)
9.5.1.2 Bike/Bicycle Market Size Estimates And Forecasts To 2032 (USD Billion)
9.5.2 Scooter
9.5.2.1 Scooter Market Trends Analysis (2020-2032)
9.5.2.2 Scooter Market Size Estimates And Forecasts To 2032 (USD Billion)
9.5.3 Others
9.5.3.1 Others Market Trends Analysis (2020-2032)
9.5.3.2 Others Market Size Estimates And Forecasts To 2032 (USD Billion)
10. Ride Sharing Market Segmentation, By Type
10.1 Chapter Overview
10.2 P2P Car Sharing
10.2.1 P2P Car Sharing Market Trends Analysis (2020-2032)
10.2.2 P2P Car Sharing Market Size Estimates And Forecasts To 2032 (USD Billion)
10.3 Corporate Car Sharing
10.3.1 Corporate Car Sharing Market Trends Analysis (2020-2032)
10.3.2 Corporate Car Sharing Market Size Estimates And Forecasts To 2032 (USD Billion)
11. Ride Sharing Market Segmentation, By Distance
11.1 Chapter Overview
11.2 Long Distance
11.2.1 Long Distance Market Trends Analysis (2020-2032)
11.2.2 Long Distance Market Size Estimates And Forecasts To 2032 (USD Billion)
11.3 Short Distance
11.3.1 Short Distance Market Trends Analysis (2020-2032)
11.3.2 Short Distance Market Size Estimates And Forecasts To 2032 (USD Billion)
12. Regional Analysis
12.1 Chapter Overview
12.2 North America
12.2.1 Trends Analysis
12.2.2 North America Ride Sharing Market Estimates And Forecasts, By Country (2020-2032) (USD Billion)
12.2.3 North America Ride Sharing Market Estimates And Forecasts, By Data Service (2020-2032) (USD Billion)
12.2.4 North America Ride Sharing Market Estimates And Forecasts, By Service Type (2020-2032) (USD Billion)
12.2.5 North America Ride Sharing Market Estimates And Forecasts, By Vehicle Type (2020-2032) (USD Billion)
12.2.6 North America Ride Sharing Market Estimates And Forecasts, By Type (2020-2032) (USD Billion)
12.2.7 North America Ride Sharing Market Estimates And Forecasts, By Distance (2020-2032) (USD Billion)
12.2.8 USA
12.2.8.1 USA Ride Sharing Market Estimates And Forecasts, By Data Service (2020-2032) (USD Billion)
12.2.8.2 USA Ride Sharing Market Estimates And Forecasts, By Service Type (2020-2032) (USD Billion)
12.2.8.3 USA Ride Sharing Market Estimates And Forecasts, By Vehicle Type (2020-2032) (USD Billion)
12.2.8.4 USA Ride Sharing Market Estimates And Forecasts, By Type (2020-2032) (USD Billion)
12.2.8.5 USA Ride Sharing Market Estimates And Forecasts, By Distance (2020-2032) (USD Billion)
12.2.9 Canada
12.2.9.1 Canada Ride Sharing Market Estimates And Forecasts, By Data Service (2020-2032) (USD Billion)
12.2.9.2 Canada Ride Sharing Market Estimates And Forecasts, By Service Type (2020-2032) (USD Billion)
12.2.9.3 Canada Ride Sharing Market Estimates And Forecasts, By Vehicle Type (2020-2032) (USD Billion)
12.2.9.4 Canada Ride Sharing Market Estimates And Forecasts, By Type (2020-2032) (USD Billion)
12.2.9.5 Canada Ride Sharing Market Estimates And Forecasts, By Distance (2020-2032) (USD Billion)
12.2.10 Mexico
12.2.10.1 Mexico Ride Sharing Market Estimates And Forecasts, By Data Service (2020-2032) (USD Billion)
12.2.10.2 Mexico Ride Sharing Market Estimates And Forecasts, By Service Type (2020-2032) (USD Billion)
12.2.10.3 Mexico Ride Sharing Market Estimates And Forecasts, By Vehicle Type (2020-2032) (USD Billion)
12.2.10.4 Mexico Ride Sharing Market Estimates And Forecasts, By Type (2020-2032) (USD Billion)
12.2.10.5 Mexico Ride Sharing Market Estimates And Forecasts, By Distance (2020-2032) (USD Billion)
12.3 Europe
12.3.1 Eastern Europe
12.3.1.1 Trends Analysis
12.3.1.2 Eastern Europe Ride Sharing Market Estimates And Forecasts, By Country (2020-2032) (USD Billion)
12.3.1.3 Eastern Europe Ride Sharing Market Estimates And Forecasts, By Data Service (2020-2032) (USD Billion)
12.3.1.4 Eastern Europe Ride Sharing Market Estimates And Forecasts, By Service Type (2020-2032) (USD Billion)
12.3.1.5 Eastern Europe Ride Sharing Market Estimates And Forecasts, By Vehicle Type (2020-2032) (USD Billion)
12.3.1.6 Eastern Europe Ride Sharing Market Estimates And Forecasts, By Type (2020-2032) (USD Billion)
12.3.1.7 Eastern Europe Ride Sharing Market Estimates And Forecasts, By Distance (2020-2032) (USD Billion)
12.3.1.8 Poland
12.3.1.8.1 Poland Ride Sharing Market Estimates And Forecasts, By Data Service (2020-2032) (USD Billion)
12.3.1.8.2 Poland Ride Sharing Market Estimates And Forecasts, By Service Type (2020-2032) (USD Billion)
12.3.1.8.3 Poland Ride Sharing Market Estimates And Forecasts, By Vehicle Type (2020-2032) (USD Billion)
12.3.1.8.4 Poland Ride Sharing Market Estimates And Forecasts, By Type (2020-2032) (USD Billion)
12.3.1.8.5 Poland Ride Sharing Market Estimates And Forecasts, By Distance (2020-2032) (USD Billion)
12.3.1.9 Romania
12.3.1.9.1 Romania Ride Sharing Market Estimates And Forecasts, By Data Service (2020-2032) (USD Billion)
12.3.1.9.2 Romania Ride Sharing Market Estimates And Forecasts, By Service Type (2020-2032) (USD Billion)
12.3.1.9.3 Romania Ride Sharing Market Estimates And Forecasts, By Vehicle Type (2020-2032) (USD Billion)
12.3.1.9.4 Romania Ride Sharing Market Estimates And Forecasts, By Type (2020-2032) (USD Billion)
12.3.1.9.5 Romania Ride Sharing Market Estimates And Forecasts, By Distance (2020-2032) (USD Billion)
12.3.1.10 Hungary
12.3.1.10.1 Hungary Ride Sharing Market Estimates And Forecasts, By Data Service (2020-2032) (USD Billion)
12.3.1.10.2 Hungary Ride Sharing Market Estimates And Forecasts, By Service Type (2020-2032) (USD Billion)
12.3.1.10.3 Hungary Ride Sharing Market Estimates And Forecasts, By Vehicle Type (2020-2032) (USD Billion)
12.3.1.10.4 Hungary Ride Sharing Market Estimates And Forecasts, By Type (2020-2032) (USD Billion)
12.3.1.10.5 Hungary Ride Sharing Market Estimates And Forecasts, By Distance (2020-2032) (USD Billion)
12.3.1.11 Turkey
12.3.1.11.1 Turkey Ride Sharing Market Estimates And Forecasts, By Data Service (2020-2032) (USD Billion)
12.3.1.11.2 Turkey Ride Sharing Market Estimates And Forecasts, By Service Type (2020-2032) (USD Billion)
12.3.1.11.3 Turkey Ride Sharing Market Estimates And Forecasts, By Vehicle Type (2020-2032) (USD Billion)
12.3.1.11.4 Turkey Ride Sharing Market Estimates And Forecasts, By Type (2020-2032) (USD Billion)
12.3.1.11.5 Turkey Ride Sharing Market Estimates And Forecasts, By Distance (2020-2032) (USD Billion)
12.3.1.12 Rest Of Eastern Europe
12.3.1.12.1 Rest Of Eastern Europe Ride Sharing Market Estimates And Forecasts, By Data Service (2020-2032) (USD Billion)
12.3.1.12.2 Rest Of Eastern Europe Ride Sharing Market Estimates And Forecasts, By Service Type (2020-2032) (USD Billion)
12.3.1.12.3 Rest Of Eastern Europe Ride Sharing Market Estimates And Forecasts, By Vehicle Type (2020-2032) (USD Billion)
12.3.1.12.4 Rest Of Eastern Europe Ride Sharing Market Estimates And Forecasts, By Type (2020-2032) (USD Billion)
12.3.1.12.5 Rest Of Eastern Europe Ride Sharing Market Estimates And Forecasts, By Distance (2020-2032) (USD Billion)
12.3.2 Western Europe
12.3.2.1 Trends Analysis
12.3.2.2 Western Europe Ride Sharing Market Estimates And Forecasts, By Country (2020-2032) (USD Billion)
12.3.2.3 Western Europe Ride Sharing Market Estimates And Forecasts, By Data Service (2020-2032) (USD Billion)
12.3.2.4 Western Europe Ride Sharing Market Estimates And Forecasts, By Service Type (2020-2032) (USD Billion)
12.3.2.5 Western Europe Ride Sharing Market Estimates And Forecasts, By Vehicle Type (2020-2032) (USD Billion)
12.3.2.6 Western Europe Ride Sharing Market Estimates And Forecasts, By Type (2020-2032) (USD Billion)
12.3.2.7 Western Europe Ride Sharing Market Estimates And Forecasts, By Distance (2020-2032) (USD Billion)
12.3.2.8 Germany
12.3.2.8.1 Germany Ride Sharing Market Estimates And Forecasts, By Data Service (2020-2032) (USD Billion)
12.3.2.8.2 Germany Ride Sharing Market Estimates And Forecasts, By Service Type (2020-2032) (USD Billion)
12.3.2.8.3 Germany Ride Sharing Market Estimates And Forecasts, By Vehicle Type (2020-2032) (USD Billion)
12.3.2.8.4 Germany Ride Sharing Market Estimates And Forecasts, By Type (2020-2032) (USD Billion)
12.3.2.8.5 Germany Ride Sharing Market Estimates And Forecasts, By Distance (2020-2032) (USD Billion)
12.3.2.9 France
12.3.2.9.1 France Ride Sharing Market Estimates And Forecasts, By Data Service (2020-2032) (USD Billion)
12.3.2.9.2 France Ride Sharing Market Estimates And Forecasts, By Service Type (2020-2032) (USD Billion)
12.3.2.9.3 France Ride Sharing Market Estimates And Forecasts, By Vehicle Type (2020-2032) (USD Billion)
12.3.2.9.4 France Ride Sharing Market Estimates And Forecasts, By Type (2020-2032) (USD Billion)
12.3.2.9.5 France Ride Sharing Market Estimates And Forecasts, By Distance (2020-2032) (USD Billion)
12.3.2.10 UK
12.3.2.10.1 UK Ride Sharing Market Estimates And Forecasts, By Data Service (2020-2032) (USD Billion)
12.3.2.10.2 UK Ride Sharing Market Estimates And Forecasts, By Service Type (2020-2032) (USD Billion)
12.3.2.10.3 UK Ride Sharing Market Estimates And Forecasts, By Vehicle Type (2020-2032) (USD Billion)
12.3.2.10.4 UK Ride Sharing Market Estimates And Forecasts, By Type (2020-2032) (USD Billion)
12.3.2.10.5 UK Ride Sharing Market Estimates And Forecasts, By Distance (2020-2032) (USD Billion)
12.3.2.11 Italy
12.3.2.11.1 Italy Ride Sharing Market Estimates And Forecasts, By Data Service (2020-2032) (USD Billion)
12.3.2.11.2 Italy Ride Sharing Market Estimates And Forecasts, By Service Type (2020-2032) (USD Billion)
12.3.2.11.3 Italy Ride Sharing Market Estimates And Forecasts, By Vehicle Type (2020-2032) (USD Billion)
12.3.2.11.4 Italy Ride Sharing Market Estimates And Forecasts, By Type (2020-2032) (USD Billion)
12.3.2.11.5 Italy Ride Sharing Market Estimates And Forecasts, By Distance (2020-2032) (USD Billion)
12.3.2.12 Spain
12.3.2.12.1 Spain Ride Sharing Market Estimates And Forecasts, By Data Service (2020-2032) (USD Billion)
12.3.2.12.2 Spain Ride Sharing Market Estimates And Forecasts, By Service Type (2020-2032) (USD Billion)
12.3.2.12.3 Spain Ride Sharing Market Estimates And Forecasts, By Vehicle Type (2020-2032) (USD Billion)
12.3.2.12.4 Spain Ride Sharing Market Estimates And Forecasts, By Type (2020-2032) (USD Billion)
12.3.2.12.5 Spain Ride Sharing Market Estimates And Forecasts, By Distance (2020-2032) (USD Billion)
12.3.2.13 Netherlands
12.3.2.13.1 Netherlands Ride Sharing Market Estimates And Forecasts, By Data Service (2020-2032) (USD Billion)
12.3.2.13.2 Netherlands Ride Sharing Market Estimates And Forecasts, By Service Type (2020-2032) (USD Billion)
12.3.2.13.3 Netherlands Ride Sharing Market Estimates And Forecasts, By Vehicle Type (2020-2032) (USD Billion)
12.3.2.13.4 Netherlands Ride Sharing Market Estimates And Forecasts, By Type (2020-2032) (USD Billion)
12.3.2.13.5 Netherlands Ride Sharing Market Estimates And Forecasts, By Distance (2020-2032) (USD Billion)
12.3.2.14 Switzerland
12.3.2.14.1 Switzerland Ride Sharing Market Estimates And Forecasts, By Data Service (2020-2032) (USD Billion)
12.3.2.14.2 Switzerland Ride Sharing Market Estimates And Forecasts, By Service Type (2020-2032) (USD Billion)
12.3.2.14.3 Switzerland Ride Sharing Market Estimates And Forecasts, By Vehicle Type (2020-2032) (USD Billion)
12.3.2.14.4 Switzerland Ride Sharing Market Estimates And Forecasts, By Type (2020-2032) (USD Billion)
12.3.2.12.5 Switzerland Ride Sharing Market Estimates And Forecasts, By Distance (2020-2032) (USD Billion)
12.3.2.15 Austria
12.3.2.15.1 Austria Ride Sharing Market Estimates And Forecasts, By Data Service (2020-2032) (USD Billion)
12.3.2.15.2 Austria Ride Sharing Market Estimates And Forecasts, By Service Type (2020-2032) (USD Billion)
12.3.2.15.3 Austria Ride Sharing Market Estimates And Forecasts, By Vehicle Type (2020-2032) (USD Billion)
12.3.2.15.4 Austria Ride Sharing Market Estimates And Forecasts, By Type (2020-2032) (USD Billion)
12.3.2.15.5 Austria Ride Sharing Market Estimates And Forecasts, By Distance (2020-2032) (USD Billion)
12.3.2.16 Rest Of Western Europe
12.3.2.16.1 Rest Of Western Europe Ride Sharing Market Estimates And Forecasts, By Data Service (2020-2032) (USD Billion)
12.3.2.16.2 Rest Of Western Europe Ride Sharing Market Estimates And Forecasts, By Service Type (2020-2032) (USD Billion)
12.3.2.16.3 Rest Of Western Europe Ride Sharing Market Estimates And Forecasts, By Vehicle Type (2020-2032) (USD Billion)
12.3.2.16.4 Rest Of Western Europe Ride Sharing Market Estimates And Forecasts, By Type (2020-2032) (USD Billion)
12.3.2.16.5 Rest Of Western Europe Ride Sharing Market Estimates And Forecasts, By Distance (2020-2032) (USD Billion)
12.4 Asia Pacific
12.4.1 Trends Analysis
12.4.2 Asia Pacific Ride Sharing Market Estimates And Forecasts, By Country (2020-2032) (USD Billion)
12.4.3 Asia Pacific Ride Sharing Market Estimates And Forecasts, By Data Service (2020-2032) (USD Billion)
12.4.4 Asia Pacific Ride Sharing Market Estimates And Forecasts, By Service Type (2020-2032) (USD Billion)
12.4.5 Asia Pacific Ride Sharing Market Estimates And Forecasts, By Vehicle Type (2020-2032) (USD Billion)
12.4.6 Asia Pacific Ride Sharing Market Estimates And Forecasts, By Type (2020-2032) (USD Billion)
12.4.7 Asia Pacific Ride Sharing Market Estimates And Forecasts, By Distance (2020-2032) (USD Billion)
12.4.8 China
12.4.8.1 China Ride Sharing Market Estimates And Forecasts, By Data Service (2020-2032) (USD Billion)
12.4.8.2 China Ride Sharing Market Estimates And Forecasts, By Service Type (2020-2032) (USD Billion)
12.4.8.3 China Ride Sharing Market Estimates And Forecasts, By Vehicle Type (2020-2032) (USD Billion)
12.4.8.4 China Ride Sharing Market Estimates And Forecasts, By Type (2020-2032) (USD Billion)
12.4.8.5 China Ride Sharing Market Estimates And Forecasts, By Distance (2020-2032) (USD Billion)
12.4.9 India
12.4.9.1 India Ride Sharing Market Estimates And Forecasts, By Data Service (2020-2032) (USD Billion)
12.4.9.2 India Ride Sharing Market Estimates And Forecasts, By Service Type (2020-2032) (USD Billion)
12.4.9.3 India Ride Sharing Market Estimates And Forecasts, By Vehicle Type (2020-2032) (USD Billion)
12.4.9.4 India Ride Sharing Market Estimates And Forecasts, By Type (2020-2032) (USD Billion)
12.4.9.5 India Ride Sharing Market Estimates And Forecasts, By Distance (2020-2032) (USD Billion)
12.4.10 Japan
12.4.10.1 Japan Ride Sharing Market Estimates And Forecasts, By Data Service (2020-2032) (USD Billion)
12.4.10.2 Japan Ride Sharing Market Estimates And Forecasts, By Service Type (2020-2032) (USD Billion)
12.4.10.3 Japan Ride Sharing Market Estimates And Forecasts, By Vehicle Type (2020-2032) (USD Billion)
12.4.10.4 Japan Ride Sharing Market Estimates And Forecasts, By Type (2020-2032) (USD Billion)
12.4.10.5 Japan Ride Sharing Market Estimates And Forecasts, By Distance (2020-2032) (USD Billion)
12.4.11 South Korea
12.4.11.1 South Korea Ride Sharing Market Estimates And Forecasts, By Data Service (2020-2032) (USD Billion)
12.4.11.2 South Korea Ride Sharing Market Estimates And Forecasts, By Service Type (2020-2032) (USD Billion)
12.4.11.3 South Korea Ride Sharing Market Estimates And Forecasts, By Vehicle Type (2020-2032) (USD Billion)
12.4.11.4 South Korea Ride Sharing Market Estimates And Forecasts, By Type (2020-2032) (USD Billion)
12.4.11.5 South Korea Ride Sharing Market Estimates And Forecasts, By Distance (2020-2032) (USD Billion)
12.4.12 Vietnam
12.4.12.1 Vietnam Ride Sharing Market Estimates And Forecasts, By Data Service (2020-2032) (USD Billion)
12.4.12.2 Vietnam Ride Sharing Market Estimates And Forecasts, By Service Type (2020-2032) (USD Billion)
12.4.12.3 Vietnam Ride Sharing Market Estimates And Forecasts, By Vehicle Type (2020-2032) (USD Billion)
12.4.12.4 Vietnam Ride Sharing Market Estimates And Forecasts, By Type (2020-2032) (USD Billion)
12.4.12.5 Vietnam Ride Sharing Market Estimates And Forecasts, By Distance (2020-2032) (USD Billion)
12.4.13 Singapore
12.4.13.1 Singapore Ride Sharing Market Estimates And Forecasts, By Data Service (2020-2032) (USD Billion)
12.4.13.2 Singapore Ride Sharing Market Estimates And Forecasts, By Service Type (2020-2032) (USD Billion)
12.4.13.3 Singapore Ride Sharing Market Estimates And Forecasts, By Vehicle Type (2020-2032) (USD Billion)
12.4.13.4 Singapore Ride Sharing Market Estimates And Forecasts, By Type (2020-2032) (USD Billion)
12.4.13.5 Singapore Ride Sharing Market Estimates And Forecasts, By Distance (2020-2032) (USD Billion)
12.4.14 Australia
12.4.14.1 Australia Ride Sharing Market Estimates And Forecasts, By Data Service (2020-2032) (USD Billion)
12.4.14.2 Australia Ride Sharing Market Estimates And Forecasts, By Service Type (2020-2032) (USD Billion)
12.4.14.3 Australia Ride Sharing Market Estimates And Forecasts, By Vehicle Type (2020-2032) (USD Billion)
12.4.14.4 Australia Ride Sharing Market Estimates And Forecasts, By Type (2020-2032) (USD Billion)
12.4.14.5 Australia Ride Sharing Market Estimates And Forecasts, By Distance (2020-2032) (USD Billion)
12.4.15 Rest Of Asia Pacific
12.4.15.1 Rest Of Asia Pacific Ride Sharing Market Estimates And Forecasts, By Data Service (2020-2032) (USD Billion)
12.4.15.2 Rest Of Asia Pacific Ride Sharing Market Estimates And Forecasts, By Service Type (2020-2032) (USD Billion)
12.4.15.3 Rest Of Asia Pacific Ride Sharing Market Estimates And Forecasts, By Vehicle Type (2020-2032) (USD Billion)
12.4.15.4 Rest Of Asia Pacific Ride Sharing Market Estimates And Forecasts, By Type (2020-2032) (USD Billion)
12.4.15.5 Rest Of Asia Pacific Ride Sharing Market Estimates And Forecasts, By Distance (2020-2032) (USD Billion)
12.5 Middle East And Africa
12.5.1 Middle East
12.5.1.1 Trends Analysis
12.5.1.2 Middle East Ride Sharing Market Estimates And Forecasts, By Country (2020-2032) (USD Billion)
12.5.1.3 Middle East Ride Sharing Market Estimates And Forecasts, By Data Service (2020-2032) (USD Billion)
12.5.1.4 Middle East Ride Sharing Market Estimates And Forecasts, By Service Type (2020-2032) (USD Billion)
12.5.1.5 Middle East Ride Sharing Market Estimates And Forecasts, By Vehicle Type (2020-2032) (USD Billion)
12.5.1.6 Middle East Ride Sharing Market Estimates And Forecasts, By Type (2020-2032) (USD Billion)
12.5.1.7 Middle East Ride Sharing Market Estimates And Forecasts, By Distance (2020-2032) (USD Billion)
12.5.1.8 UAE
12.5.1.8.1 UAE Ride Sharing Market Estimates And Forecasts, By Data Service (2020-2032) (USD Billion)
12.5.1.8.2 UAE Ride Sharing Market Estimates And Forecasts, By Service Type (2020-2032) (USD Billion)
12.5.1.8.3 UAE Ride Sharing Market Estimates And Forecasts, By Vehicle Type (2020-2032) (USD Billion)
12.5.1.8.4 UAE Ride Sharing Market Estimates And Forecasts, By Type (2020-2032) (USD Billion)
12.5.1.8.5 UAE Ride Sharing Market Estimates And Forecasts, By Distance (2020-2032) (USD Billion)
12.5.1.9 Egypt
12.5.1.9.1 Egypt Ride Sharing Market Estimates And Forecasts, By Data Service (2020-2032) (USD Billion)
12.5.1.9.2 Egypt Ride Sharing Market Estimates And Forecasts, By Service Type (2020-2032) (USD Billion)
12.5.1.9.3 Egypt Ride Sharing Market Estimates And Forecasts, By Vehicle Type (2020-2032) (USD Billion)
12.5.1.9.4 Egypt Ride Sharing Market Estimates And Forecasts, By Type (2020-2032) (USD Billion)
12.5.1.9.5 Egypt Ride Sharing Market Estimates And Forecasts, By Distance (2020-2032) (USD Billion)
12.5.1.10 Saudi Arabia
12.5.1.10.1 Saudi Arabia Ride Sharing Market Estimates And Forecasts, By Data Service (2020-2032) (USD Billion)
12.5.1.10.2 Saudi Arabia Ride Sharing Market Estimates And Forecasts, By Service Type (2020-2032) (USD Billion)
12.5.1.10.3 Saudi Arabia Ride Sharing Market Estimates And Forecasts, By Vehicle Type (2020-2032) (USD Billion)
12.5.1.10.4 Saudi Arabia Ride Sharing Market Estimates And Forecasts, By Type (2020-2032) (USD Billion)
12.5.1.10.5 Saudi Arabia Ride Sharing Market Estimates And Forecasts, By Distance (2020-2032) (USD Billion)
12.5.1.11 Qatar
12.5.1.11.1 Qatar Ride Sharing Market Estimates And Forecasts, By Data Service (2020-2032) (USD Billion)
12.5.1.11.2 Qatar Ride Sharing Market Estimates And Forecasts, By Service Type (2020-2032) (USD Billion)
12.5.1.11.3 Qatar Ride Sharing Market Estimates And Forecasts, By Vehicle Type (2020-2032) (USD Billion)
12.5.1.11.4 Qatar Ride Sharing Market Estimates And Forecasts, By Type (2020-2032) (USD Billion)
12.5.1.11.5 Qatar Ride Sharing Market Estimates And Forecasts, By Distance (2020-2032) (USD Billion)
12.5.1.12 Rest Of Middle East
12.5.1.12.1 Rest Of Middle East Ride Sharing Market Estimates And Forecasts, By Data Service (2020-2032) (USD Billion)
12.5.1.12.2 Rest Of Middle East Ride Sharing Market Estimates And Forecasts, By Service Type (2020-2032) (USD Billion)
12.5.1.12.3 Rest Of Middle East Ride Sharing Market Estimates And Forecasts, By Vehicle Type (2020-2032) (USD Billion)
12.5.1.12.4 Rest Of Middle East Ride Sharing Market Estimates And Forecasts, By Type (2020-2032) (USD Billion)
12.5.1.12.5 Rest Of Middle East Ride Sharing Market Estimates And Forecasts, By Distance (2020-2032) (USD Billion)
12.5.2 Africa
12.5.2.1 Trends Analysis
12.5.2.2 Africa Ride Sharing Market Estimates And Forecasts, By Country (2020-2032) (USD Billion)
12.5.2.3 Africa Ride Sharing Market Estimates And Forecasts, By Data Service (2020-2032) (USD Billion)
12.5.2.4 Africa Ride Sharing Market Estimates And Forecasts, By Service Type (2020-2032) (USD Billion)
12.5.2.5 Africa Ride Sharing Market Estimates And Forecasts, By Vehicle Type (2020-2032) (USD Billion)
12.5.2.6 Africa Ride Sharing Market Estimates And Forecasts, By Type (2020-2032) (USD Billion)
12.5.2.7 Africa Ride Sharing Market Estimates And Forecasts, By Distance (2020-2032) (USD Billion)
12.5.2.8 South Africa
12.5.2.8.1 South Africa Ride Sharing Market Estimates And Forecasts, By Data Service (2020-2032) (USD Billion)
12.5.2.8.2 South Africa Ride Sharing Market Estimates And Forecasts, By Service Type (2020-2032) (USD Billion)
12.5.2.8.3 South Africa Ride Sharing Market Estimates And Forecasts, By Vehicle Type (2020-2032) (USD Billion)
12.5.2.8.4 South Africa Ride Sharing Market Estimates And Forecasts, By Type (2020-2032) (USD Billion)
12.5.2.8.5 South Africa Ride Sharing Market Estimates And Forecasts, By Distance (2020-2032) (USD Billion)
12.5.2.9 Nigeria
12.5.2.9.1 Nigeria Ride Sharing Market Estimates And Forecasts, By Data Service (2020-2032) (USD Billion)
12.5.2.9.2 Nigeria Ride Sharing Market Estimates And Forecasts, By Service Type (2020-2032) (USD Billion)
12.5.2.9.3 Nigeria Ride Sharing Market Estimates And Forecasts, By Vehicle Type (2020-2032) (USD Billion)
12.5.2.9.4 Nigeria Ride Sharing Market Estimates And Forecasts, By Type (2020-2032) (USD Billion)
12.5.2.9.5 Nigeria Ride Sharing Market Estimates And Forecasts, By Distance (2020-2032) (USD Billion)
12.5.2.10 Rest Of Africa
12.5.2.10.1 Rest Of Africa Ride Sharing Market Estimates And Forecasts, By Data Service (2020-2032) (USD Billion)
12.5.2.10.2 Rest Of Africa Ride Sharing Market Estimates And Forecasts, By Service Type (2020-2032) (USD Billion)
12.5.2.10.3 Rest Of Africa Ride Sharing Market Estimates And Forecasts, By Vehicle Type (2020-2032) (USD Billion)
12.5.2.10.4 Rest Of Africa Ride Sharing Market Estimates And Forecasts, By Type (2020-2032) (USD Billion)
12.5.2.10.5 Rest Of Africa Ride Sharing Market Estimates And Forecasts, By Distance (2020-2032) (USD Billion)
12.6 Latin America
12.6.1 Trends Analysis
12.6.2 Latin America Ride Sharing Market Estimates And Forecasts, By Country (2020-2032) (USD Billion)
12.6.3 Latin America Ride Sharing Market Estimates And Forecasts, By Data Service (2020-2032) (USD Billion)
12.6.4 Latin America Ride Sharing Market Estimates And Forecasts, By Service Type (2020-2032) (USD Billion)
12.6.5 Latin America Ride Sharing Market Estimates And Forecasts, By Vehicle Type (2020-2032) (USD Billion)
12.6.6 Latin America Ride Sharing Market Estimates And Forecasts, By Type (2020-2032) (USD Billion)
12.6.7 Latin America Ride Sharing Market Estimates And Forecasts, By Distance (2020-2032) (USD Billion)
12.6.8 Brazil
12.6.8.1 Brazil Ride Sharing Market Estimates And Forecasts, By Data Service (2020-2032) (USD Billion)
12.6.8.2 Brazil Ride Sharing Market Estimates And Forecasts, By Service Type (2020-2032) (USD Billion)
12.6.8.3 Brazil Ride Sharing Market Estimates And Forecasts, By Vehicle Type (2020-2032) (USD Billion)
12.6.8.4 Brazil Ride Sharing Market Estimates And Forecasts, By Type (2020-2032) (USD Billion)
12.6.8.5 Brazil Ride Sharing Market Estimates And Forecasts, By Distance (2020-2032) (USD Billion)
12.6.9 Argentina
12.6.9.1 Argentina Ride Sharing Market Estimates And Forecasts, By Data Service (2020-2032) (USD Billion)
12.6.9.2 Argentina Ride Sharing Market Estimates And Forecasts, By Service Type (2020-2032) (USD Billion)
12.6.9.3 Argentina Ride Sharing Market Estimates And Forecasts, By Vehicle Type (2020-2032) (USD Billion)
12.6.9.4 Argentina Ride Sharing Market Estimates And Forecasts, By Type (2020-2032) (USD Billion)
12.6.9.5 Argentina Ride Sharing Market Estimates And Forecasts, By Distance (2020-2032) (USD Billion)
12.6.10 Colombia
12.6.10.1 Colombia Ride Sharing Market Estimates And Forecasts, By Data Service (2020-2032) (USD Billion)
12.6.10.2 Colombia Ride Sharing Market Estimates And Forecasts, By Service Type (2020-2032) (USD Billion)
12.6.10.3 Colombia Ride Sharing Market Estimates And Forecasts, By Vehicle Type (2020-2032) (USD Billion)
12.6.10.4 Colombia Ride Sharing Market Estimates And Forecasts, By Type (2020-2032) (USD Billion)
12.6.10.5 Colombia Ride Sharing Market Estimates And Forecasts, By Distance (2020-2032) (USD Billion)
12.6.11 Rest Of Latin America
12.6.11.1 Rest Of Latin America Ride Sharing Market Estimates And Forecasts, By Data Service (2020-2032) (USD Billion)
12.6.11.2 Rest Of Latin America Ride Sharing Market Estimates And Forecasts, By Application (2020-2032) (USD Billion)
12.6.11.3 Rest Of Latin America Ride Sharing Market Estimates And Forecasts, By Vehicle Type (2020-2032) (USD Billion)
12.6.11.4 Rest Of Latin America Ride Sharing Market Estimates And Forecasts, By Type (2020-2032) (USD Billion)
12.6.11.5 Rest Of Latin America Ride Sharing Market Estimates And Forecasts, By Distance (2020-2032) (USD Billion)
13. Company Profiles
13.1 Uber Technologies Inc.
13.1.1 Company Overview
13.1.2 Financial
13.1.3 Products/ Services Offered
13.1.4 SWOT Analysis
13.2 Gett
13.2.1 Company Overview
13.2.2 Financial
13.2.3 Products/ Services Offered
13.2.4 SWOT Analysis
13.3 Lyft Inc
13.3.1 Company Overview
13.3.2 Financial
13.3.3 Products/ Services Offered
13.3.4 SWOT Analysis
13.4 Didi Chuxing Technology Co.
13.4.1 Company Overview
13.4.2 Financial
13.4.3 Products/ Services Offered
13.4.4 SWOT Analysis
13.5 GrabTaxi Holdings Pte. Ltd.
13.5.1 Company Overview
13.5.2 Financial
13.5.3 Products/ Services Offered
13.5.4 SWOT Analysis
13.6 car2go
13.6.1 Company Overview
13.6.2 Financial
13.6.3 Products/ Services Offered
13.6.4 SWOT Analysis
13.7 Cabify
13.7.1 Company Overview
13.7.2 Financial
13.7.3 Products/ Services Offered
13.7.4 SWOT Analysis
13.8 Careem
13.8.1 Company Overview
13.8.2 Financial
13.8.3 Products/ Services Offered
13.8.4 SWOT Analysis
13.9 Bolt Technology
13.9.1 Company Overview
13.9.2 Financial
13.9.3 Products/ Services Offered
13.9.4 SWOT Analysis
13.10 Others
13.12.1 Company Overview
13.12.2 Financial
13.12.3 Products/ Services Offered
13.12.4 SWOT Analysis
14. Use Cases and Best Practices
15. Conclusion
An accurate research report requires proper strategizing as well as implementation. There are multiple factors involved in the completion of good and accurate research report and selecting the best methodology to compete the research is the toughest part. Since the research reports we provide play a crucial role in any company’s decision-making process, therefore we at SNS Insider always believe that we should choose the best method which gives us results closer to reality. This allows us to reach at a stage wherein we can provide our clients best and accurate investment to output ratio.
Each report that we prepare takes a timeframe of 350-400 business hours for production. Starting from the selection of titles through a couple of in-depth brain storming session to the final QC process before uploading our titles on our website we dedicate around 350 working hours. The titles are selected based on their current market cap and the foreseen CAGR and growth.
The 5 steps process:
Step 1: Secondary Research:
Secondary Research or Desk Research is as the name suggests is a research process wherein, we collect data through the readily available information. In this process we use various paid and unpaid databases which our team has access to and gather data through the same. This includes examining of listed companies’ annual reports, Journals, SEC filling etc. Apart from this our team has access to various associations across the globe across different industries. Lastly, we have exchange relationships with various university as well as individual libraries.
Step 2: Primary Research
When we talk about primary research, it is a type of study in which the researchers collect relevant data samples directly, rather than relying on previously collected data. This type of research is focused on gaining content specific facts that can be sued to solve specific problems. Since the collected data is fresh and first hand therefore it makes the study more accurate and genuine.
We at SNS Insider have divided Primary Research into 2 parts.
Part 1 wherein we interview the KOLs of major players as well as the upcoming ones across various geographic regions. This allows us to have their view over the market scenario and acts as an important tool to come closer to the accurate market numbers. As many as 45 paid and unpaid primary interviews are taken from both the demand and supply side of the industry to make sure we land at an accurate judgement and analysis of the market.
This step involves the triangulation of data wherein our team analyses the interview transcripts, online survey responses and observation of on filed participants. The below mentioned chart should give a better understanding of the part 1 of the primary interview.
Part 2: In this part of primary research the data collected via secondary research and the part 1 of the primary research is validated with the interviews from individual consultants and subject matter experts.
Consultants are those set of people who have at least 12 years of experience and expertise within the industry whereas Subject Matter Experts are those with at least 15 years of experience behind their back within the same space. The data with the help of two main processes i.e., FGDs (Focused Group Discussions) and IDs (Individual Discussions). This gives us a 3rd party nonbiased primary view of the market scenario making it a more dependable one while collation of the data pointers.
Step 3: Data Bank Validation
Once all the information is collected via primary and secondary sources, we run that information for data validation. At our intelligence centre our research heads track a lot of information related to the market which includes the quarterly reports, the daily stock prices, and other relevant information. Our data bank server gets updated every fortnight and that is how the information which we collected using our primary and secondary information is revalidated in real time.
Step 4: QA/QC Process
After all the data collection and validation our team does a final level of quality check and quality assurance to get rid of any unwanted or undesired mistakes. This might include but not limited to getting rid of the any typos, duplication of numbers or missing of any important information. The people involved in this process include technical content writers, research heads and graphics people. Once this process is completed the title gets uploader on our platform for our clients to read it.
Step 5: Final QC/QA Process:
This is the last process and comes when the client has ordered the study. In this process a final QA/QC is done before the study is emailed to the client. Since we believe in giving our clients a good experience of our research studies, therefore, to make sure that we do not lack at our end in any way humanly possible we do a final round of quality check and then dispatch the study to the client.
By Service Type
Car Sharing
Car Rental
E-Hailing
Station Based Mobility
By Type
P2P Car Sharing
Corporate Car Sharing
By Vehicle Type
ICE Vehicle
CNG/LPG Vehicle
Electric Vehicle
Micro Mobility Vehicle
Bike/Bicycle
Scooter
Others
By Data Service
Information Service
Navigation
Payment
Other
By Distance
Long Distance
Short Distance
Request for Segment Customization as per your Business Requirement: Segment Customization Request
Regional Coverage
North America
US
Canada
Mexico
Europe
Eastern Europe
Poland
Romania
Hungary
Turkey
Rest of Eastern Europe
Western Europe
Germany
France
UK
Italy
Spain
Netherlands
Switzerland
Austria
Rest of Western Europe
Asia Pacific
China
India
Japan
South Korea
Vietnam
Singapore
Australia
Rest of Asia Pacific
Middle East & Africa
Middle East
UAE
Egypt
Saudi Arabia
Qatar
Rest of the Middle East
Africa
Nigeria
South Africa
Rest of Africa
Latin America
Brazil
Argentina
Colombia
Rest of Latin America
Request for Country Level Research Report: Country Level Customization Request
Available Customization
With the given market data, SNS Insider offers customization as per the company’s specific needs. The following customization options are available for the report:
Product Analysis
Criss-Cross segment analysis (e.g. Product X Application)
Product Matrix which gives a detailed comparison of product portfolio of each company
Geographic Analysis
Additional countries in any of the regions
Company Information
Detailed analysis and profiling of additional market players (Up to five)
The Automotive Collision Repair Market size is expected to reach USD 229.85 Bn by 2032 and is valued at USD 197.51 Bn in 2023, the CAGR is anticipated to be over 1.7% over the forecast period of 2024-2032.
The Automotive Telematics Market size was valued at USD 59 billion in 2023 & will reach USD 233.23 billion by 2032 and grow at a CAGR of 16.5% by 2024-2032
The Automotive Display Market size was valued at USD 15.98 billion in 2023 and is expected to reach USD 29.14 billion by 2031 and grow at a CAGR of 7.87% over the forecast period 2024-2031.
The Automotive DC-DC Converters Market Size was valued at US$ 813.143 million in 2023 expected to reach USD 8253.129 million by 2031 and grow at a CAGR of 33.6% over the forecast period 2024-2031.
Teen Driver Technology market size was valued at USD 2.52 billion in 2023 and is expected to reach at USD 4.37 billion by 2031, and grow at a CAGR of 7.1% over the forecast period of 2024-2031.
The Solar-Powered Vehicle Market Size was valued at USD 1.27 Billion in 2023 and is expected to reach USD 7.33 Billion by 2032 and grow at a CAGR of 21.5% over the forecast period 2024-2032.
Hi! Click one of our member below to chat on Phone