Silicon Metal Market Report Scope & Overview:
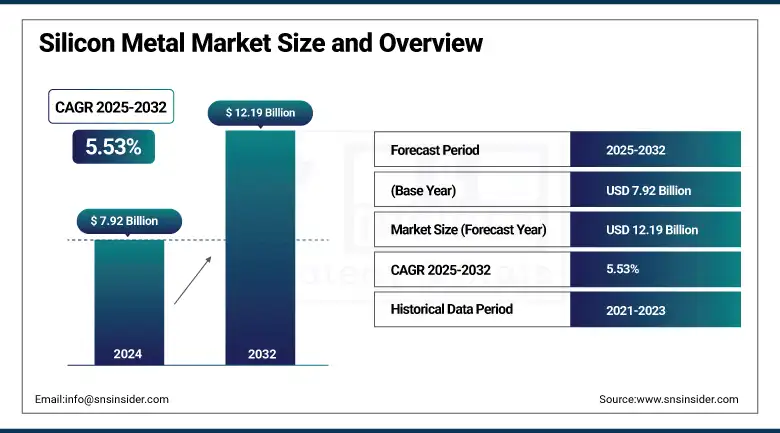
The Silicon Metal Market Size was valued at USD 7.92 billion in 2024 and is expected to reach USD 12.19 billion by 2032 and grow at a CAGR of 5.53% over the forecast period 2025-2032.
Silicon metal market analysis indicates that the growing use of silicon in the production of aluminium alloys for lightweighting in automotive, aerospace, and renewable energy industries is one of the driving factors for market growth. Silicon can greatly improve the strength, plasticity, and corrosion resistance of aluminium alloys, so it is indispensable in high-performance aluminium alloy manufacturing, which drives the silicon metal market growth.
Silicon Metal Market Size and Forecast
-
Market Size in 2024: USD 7.92 Billion
-
Market Size by 2032: USD 12.19 Billion
-
CAGR: 5.53% from 2025 to 2032
-
Base Year: 2024
-
Forecast Period: 2025–2032
-
Historical Data: 2022–2024
Silicon Metal Market Trends
-
Rising demand from the aluminum alloy industry is driving silicon metal consumption, with aluminum applications accounting for over 40% of total global demand.
-
Rapid growth in the solar photovoltaic (PV) sector is boosting high-purity silicon metal usage, as global solar capacity installations are expanding at over 15% annually.
-
Increasing adoption in the electronics and semiconductor industry is supporting demand for ultra-high purity silicon, with semiconductor-grade silicon consumption growing at 8–10% CAGR.
-
Expansion of the electric vehicle (EV) market is accelerating demand for lightweight aluminum-silicon alloys, with global EV sales rising by over 25% year-on-year.
-
Strong production concentration in Asia-Pacific, particularly China, which accounts for more than 65% of global silicon metal output, is influencing global supply dynamics and pricing trends.
Consistent with this vision, the United States government took an unprecedented step in early 2024 with the $500mm+ grant to Century aluminium to construct the first “green” primary aluminium smelter in 45 years. This facility will help to potentially double the nation’s domestic aluminium capacity to match rising alloy demand driven by electrification and efforts to develop clean energy infrastructure
The alignment between growing alloy consumption and strategic national investment also explains why silicon metal demand is still on the rise as we move closer to lightweight, energy-efficient material systems.
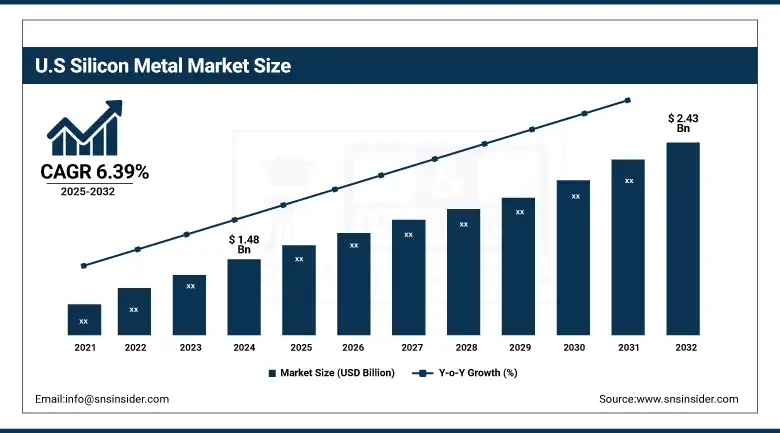
The U.S. silicon metal market size was USD 1.48 billion in 2024 and is expected to reach USD 2.43 billion by 2032 and grow at a CAGR of 6.39% over the forecast period of 2025-2032. The U.S. is the dominant country, backed by the Inflation Reduction Act, which includes $369 billion for clean energy investments, boosting domestic silicon metal usage. The fastest-growing sub-segment is solar-grade silicon, as companies like Hemlock Semiconductor expand high-purity silicon production. Canada also supports the sector with clean tech incentives and raw material availability, enhancing cross-border supply chains for aluminium and electronics.
Silicon Metal Market Dynamics
Key Drivers:
-
Surge in Silicon Use in EV Battery Anodes Drive the Market Growth
The silicon metal market is being driven predominantly by the growing inclusion of silicon metal in lithium-ion battery anodes for electric cars (EVs). Silicon has much greater theoretical capacity than commonly used graphite, and is therefore an attractive material to enable new battery concepts with higher energy content and faster charging rates. This is supported by the worldwide move towards EVs and green mobility. For example, in 2022, Group14 Technologies was awarded a USD 100 million investment by the U.S. Department of Energy (DoE) to commercialize its production processes for advanced silicon-carbon composite materials for EV batteries. In 2024, it was also awarded an extra USD 200 million to grow its Moses Lake, Washington facility, which became one of the world’s largest advanced silicon material plants.
Restrain:
-
Consistency & Quality Challenges in Metallurgical Grade Production May Hamper the Market Growth
Silicon metal is mainly manufactured by a carbothermic reduction of quartz in electric arc furnaces, which is complex and dependent on raw materials quality and operating conditions. The slightest anomalies in furnace operation or impure feedstock composition can cause significant quality differences, which could impair downstream applications, especially in aluminium alloy and chemical grade markets. In addition, getting silicon to the ultrahigh purities (>99.9%) required for silicon in electronics or silicon in solar panels is a very expensive secondary refining process, which can add 15-25% to production costs. Such quality issues drive up manufacturing costs and may scare off long-term supply contracts. This is further complicated by the absence of universal quality frameworks and inconsistent regulations that restrict market dynamics.
Opportunities:
-
Infrastructure & EV Battery Gigafactory Support Has Created the Opportunity in the Market.
Silicon Metal Market is the sudden proliferation of EV battery gigafactories as well as infrastructure projects worldwide, both of which extensively employ silicon-based materials. Silicon’s use to support aluminium alloying for lightweight vehicle manufacture and its growing use in battery applications make it an essential raw material. Governments and private investors are driving this growth on the strength of targeted incentives and grants that will ensure domestic supply chains which drive the silicon metal market trends.
For instance, in 2025, Silicon Metals Corp. disclosed $320,000 tranche investment round to expand its high-purity metallurgical-grade production capacity. The move is consistent with the country’s wider push towards localised materials sourcing for EVs and renewable energy storage.
Silicon Metal Market Segments:
By Type
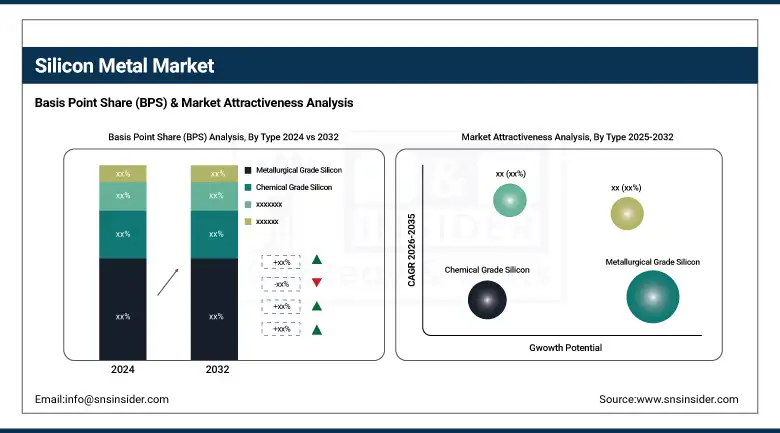
Metallurgical Grade Silicon dominates the silicon metal market share with over 68% share due to its extensive use in aluminum alloys and automotive components. It enhances strength and castability, making it essential in die-casting parts like engine blocks.
Solar Grade Silicon is the fastest-growing type, propelled by the expanding photovoltaic industry. Countries like China and India are aggressively investing in solar infrastructure, where high-purity silicon wafers form the base of solar cells (e.g., LONGi Green Energy's 2024 solar wafer expansion).
By Purity
Standard Grade (<99%) holds the largest market share, largely due to its cost-effectiveness and suitability for bulk applications like aluminum manufacturing. It meets structural performance needs without the cost of high refinement.
Ultra-High Purity (>99.9%) is witnessing the fastest growth, driven by demand in semiconductors and advanced solar modules. For instance, Wacker Chemie’s investment in upgrading its high-purity silicon plant in Germany reflects the push toward electronics-grade applications.
By Application
Aluminum Alloys industry remains the leading application area, owing to their broad use in automotive frames, aerospace structures, and packaging industries. Silicon metal improves wear resistance and lowers weight, making it indispensable.
Semiconductors are the fastest-growing segment, fueled by demand for advanced chips in AI, EVs, and 5G devices. Companies like TSMC and Intel continue increasing their silicon input needs as chip architectures become more complex.
By End-Use Industry
Automotive is the dominant end-use industry, especially as OEMs increasingly adopt lightweight aluminum-silicon alloys for fuel-efficient and electric vehicles. For example, Tesla uses high-silicon aluminum in battery enclosures and motor casings.
Energy & Power is the fastest-growing end-use segment, mainly due to rising deployment of solar panels and battery storage units. Massive grid upgrades and solar farm installations, such as India's 500 GW renewable energy plan by 2030, are catalyzing this growth.
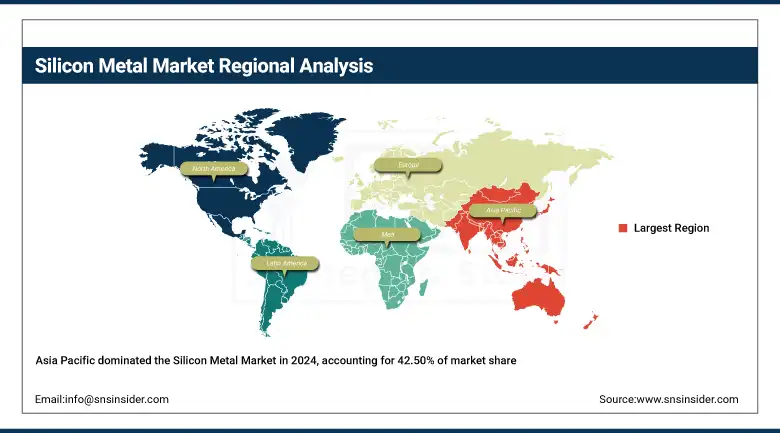
Silicon Metal Market Regional Analysis:
Asia Pacific holds the largest share in the global silicon metal market, around 42.50% in 2024. It is driven by strong demand from the aluminium alloy, semiconductor, and solar industries. China dominates the region due to its massive production capacity and consumption, accounting for over 65% of global silicon metal output, supported by government subsidies and export-oriented manufacturing. The fastest-growing country is India, owing to its National Solar Mission and booming automotive sector. India targets 500 GW of non-fossil fuel capacity by 2030, pushing solar-grade silicon usage. Japan and South Korea also contribute significantly through high-end electronics and EV industries. For instance, Japan’s Shin-Etsu Chemical continues investing in electronics-grade silicon to support chip manufacturing.
The North America region is expected to grow at the fastest CAGR of about 6.10% in from 2025 to 2032 in silicon metal industry forecast. It is due to rising investments in solar energy, electric vehicles, and semiconductor fabs.
Europe held a significant market share due to its stringent environmental regulations, thriving automotive and aerospace sectors, and renewable energy mandates. Germany dominates due to its leadership in engineering, auto manufacturing, and solar integration. The fastest-growing country is France, supported by rising demand for low-carbon aluminum and solar panels. For example, Ferroglobe (which has silicon operations in Europe) announced expansions in response to growing European demand for semiconductors and green aluminum. Additionally, EU directives like the Green Deal are driving the shift toward high-purity silicon in clean technologies.
Key Players:
The Silicon Metals Companies are Ferroglobe PLC, Elkem ASA, Dow Inc., RIMA Group, Simcoa Operations Pty Ltd, Mississippi Silicon, Hoshine Silicon Industry Co. Ltd., Wacker Chemie AG, PCC SE, RW Silicium GmbH, Xinjiang GCL, China National Bluestar (Group) Co. Ltd., Silicon Smelters, Anyang Wanhua Metal Materials Co. Ltd., Daqo New Energy Corp., Globe Specialty Metals, Qinghai Wutong Group, Ligas de Alumínio S.A., Thermo Fisher Scientific Inc., HPQ Silicon Inc.
Recent Development:
-
In March 2024, Elkem increased its high-purity silicon capacity at its Tennessee plant in the US to better meet demand from the semiconductor and solar markets. This capacity addition further enhances Elkem’s position in the supply of electronics-grade silicon.
-
In March 2024, Ferroglobe and LONGi signed an agreement with one of the world's largest solar wafers manufacturers for the supply of metallurgical-grade silicon. the contract highlights demand from the solar sector and a cooperation approach.
| Report Attributes | Details |
| Market Size in 2024 | USD 7.92 Billion |
| Market Size by 2032 | USD 12.19 Billion |
| CAGR | CAGR of 5.53% From 2025 to 2032 |
| Base Year | 2024 |
| Forecast Period | 2025-2032 |
| Historical Data | 2021-2023 |
| Report Scope & Coverage | Market Size, Segments Analysis, Competitive Landscape, Regional Analysis, DROC & SWOT Analysis, Forecast Outlook |
| Key Segments | • By Type (Metallurgical Grade Silicon, Chemical Grade Silicon, Solar Grade Silicon, Others (High-Purity, Electronics Grade, etc.) • By Purity (Standard Grade (<99%), High Purity (99%–99.9%), Ultra-High Purity (>99.9%) • By Application (Aluminium Alloys, Semiconductors, Solar Panels, Silicones, Others (Batteries, Optical Fibers, etc.) • By End-Use Industry (Automotive, Construction, Electronics & Electrical, Energy & Power, Others (Healthcare, Consumer Goods, etc.) |
| Regional Analysis/Coverage | North America (US, Canada), Europe (Germany, France, UK, Italy, Spain, Poland, Russsia, Rest of Europe), Asia Pacific (China, India, Japan, South Korea, Australia,ASEAN Countries, Rest of Asia Pacific), Middle East & Africa (UAE, Saudi Arabia, Qatar, Egypt, South Africa, Rest of Middle East & Africa), Latin America (Brazil, Argentina, Mexico, Colombia Rest of Latin America) |
| Company Profiles | Ferroglobe PLC, Elkem ASA, Dow Inc., RIMA Group, Simcoa Operations Pty Ltd, Mississippi Silicon, Hoshine Silicon Industry Co. Ltd., Wacker Chemie AG, PCC SE, RW Silicium GmbH, Xinjiang GCL, China National Bluestar (Group) Co. Ltd., Silicon Smelters, Anyang Wanhua Metal Materials Co. Ltd., Daqo New Energy Corp., Globe Specialty Metals, Qinghai Wutong Group, Ligas de Alumínio S.A., Thermo Fisher Scientific Inc., HPQ Silicon Inc. |
Frequently Asked Questions
Ans Asia Pacific, led by China and India, is dominating due to strong solar panel and electronics manufacturing. North America is the fastest-growing, fueled by domestic EV battery supply chains and clean energy incentives.
Ans Strict emission norms (e.g., EU’s Carbon Border Adjustment Mechanism) and green energy policies are pushing producers to adopt low-carbon silicon manufacturing and recycling practices
Ans EV growth is boosting demand for silicon–carbon composite anodes, offering higher battery capacity and faster charging. This trend is driving R&D investments into ultra-high purity silicon.
Ans The automotive, electronics, and solar energy sectors are major consumers. Their demand is evolving toward high-purity silicon for EV batteries, solar cells, and advanced semiconductors to meet energy efficiency goals.
Ans Rising demand from aluminum alloys, solar photovoltaics, and semiconductors is driving market growth. Rapid industrialization and decarbonization efforts are also pushing demand for silicon-based materials in EVs and electronics.
Get in Touch
