Simulators Market Report Scope & Overview:
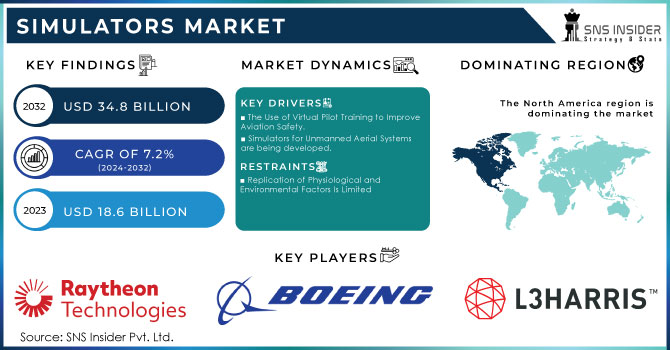
The Simulators Market Size was valued at USD 18.6 billion in 2023 and is expected to reach USD 34.8 billion by 2032 with a growing CAGR of 7.2% over the forecast period 2024-2032. Simulation software is a tool for simulating a real-time environment in order to verify the suitability and efficiency of various products and processes. Benefits such as lower production costs and lower training expenses are projected to drive the market. Additionally, simulation techniques are important in determining the effects of military weaponry. Simulation software is widely used by businesses to reduce production costs. The software aids in the development of several prototypes and their virtual testing. Furthermore, it aids in the realization of error-free output in a production process, thereby avoiding the production of faulty products and the associated costs. It also saves time spent on R&D activities. All of these factors are expected to fuel market growth. Historically, manufacturers incurred enormous costs when prototyping products with complex mechanisms. Despite the availability of prototypes, the chances of failure were high, necessitating additional R&D expenses to reduce such product failures.
To get more information on Simulators Market - Request Free Sample Report
MARKET DYNAMICS
KEY DRIVERS
-
The Use of Virtual Pilot Training to Improve Aviation Safety.
-
Simulators for Unmanned Aerial Systems are being developed.
RESTRAINTS
-
Replication of Physiological and Environmental Factors Is Limited
-
Interoperability issues and a lengthy product life-cycle
OPPORTUNITIES
-
Simulation spending is high in aerospace, healthcare, and defence.
-
particularly in the healthcare sector Organizations can use simulation modelling to develop methods for responding swiftly, securely, and successfully.
CHALLENGES
-
There is a lack of a consistent benchmark for measuring outputs.
-
Despite the availability of an effective MBS simulation tool, there is a lack of consistent criteria for evaluating such software applications.
IMPACT OF COVID-19
The COVID-19 epidemic has affected all sectors of society, including individuals and businesses. The internet ecosystem has played a significant role worldwide. As a result of the COVID-19 epidemic, dependence on online businesses has grown exponentially. BFSI, health and health sciences, manufacturing, automotive, retail, transportation, and transportation, among others, uses the Internet to provide much-needed services to consumers. Simulation software is a tool used to create a real-time environment to test the efficiency and usefulness of different products. Vendors are experiencing a growing need for simulation solutions in the aftermath of this epidemic. Simulation software is to analyze the spread of the virus, as well as the success of social isolation. The restrictions imposed by governments in responding to the COVID-19 epidemic have encouraged workers to work from home, and to 'stay at home'. Therefore, technology has become very important in both working and personal life.
Despite this growing demand for technology, it is noteworthy that many organizations have not yet provided a 'safe online' workplace. Where business meetings were usually held in person, many are now almost complete. Retailers of simulation software are making efforts to combat the status of COVID-19 by providing simulation analysis related to the spread of the disease. In addition, retailers also introduced new products and services to maintain their competitive position in the market. The use of simulation software empowers car manufacturers to test multiple car models in a simulated environment before deciding and finalizing the final car. The benefits of simulation software such as reduced production costs and reduced training costs are expected to further the simulation software market.
Because of the growing adoption of simulators for both commercial and military applications, the airborne segment is expected to grow at the fastest CAGR during the forecast period. Due to the increasing adoption of simulators to provide enhanced training experience to commercial truck, bus, and car drivers, this segment is expected to grow at a steady CAGR during the forecast period.
The growing use of simulators by naval forces in countries such as the United States is expected to drive the segment's growth.
On a segmented basis, the global market is divided into software and services.
The segment is expected to remain active throughout the forecast period. The growth of this component can be attributed to the benefits of the software, such as data security, reliability, and seamless testing. In addition, under the software component, limited content analysis is expected to have a significant impact on component growth. FEA is generally utilized in enterprises, for example, auto, aviation, protection, and gadgets, to assess item quality, execution, and plan.
On the other hand, part of the service is expected to register the rate of rapid growth during the forecast period. Partial growth can be attributed to the growing awareness of empowered processes that are likely to be used for product development between companies and governments. Services, such as design and consultation, implementation, and maintenance are gaining popularity among various businesses. ANSYS, Inc., one of the key players in the market, provides consulting and professional services for performance improvement simulation and process compression.
The bulk of the share is due to the strong adoption of software to emulate key end-use companies such as Airbus, Boeing, Volkswagen Group, and others for product engineering, modeling, research, and testing purposes. In addition, segment growth is driven by client needs for rapid and cost-effective development, allowing companies to enter the market with new products faster and lower warranty costs. In addition, from real prototyping to simulation is universal in many industries and the need for modeling, design, and simulation testing tools is reinforced by large investments in well-developed applications including 5G, clinical trials, autonomy, electrification, and industry. Internet of Things. In addition, Cyber threats have plagued a number of industries, such as the military and defense, businesses, and others. The introduction of simulation solutions gives organizations an awareness of the online situation. This helps users identify malicious internet attacks on that network. Therefore, with the growing concern for Cyber threats around the world, it is expected to see greater adoption of Cyber simulation tools and help the sector grow to a significant CAGR from 2022 to 2030.
KEY MARKET SEGMENTATION
By Type
-
Full Mission Bridge Simulators
-
Full Flight Simulators
-
Driving Simulators
-
Fixed Base Simulators
-
Flight Training Devices
-
Vessel Traffic Control Simulators
-
Air Traffic Control Simulators & Others
By Platform
-
Airborne
-
Land
-
Maritime
By Solution
-
Products
-
Services
By Application
-
Military Training
-
Commercial Training
By Technique
-
Gamming Simulation
-
Synthetic Environment Simulation
-
Live, Virtual & Constructive (LVC) Simulation
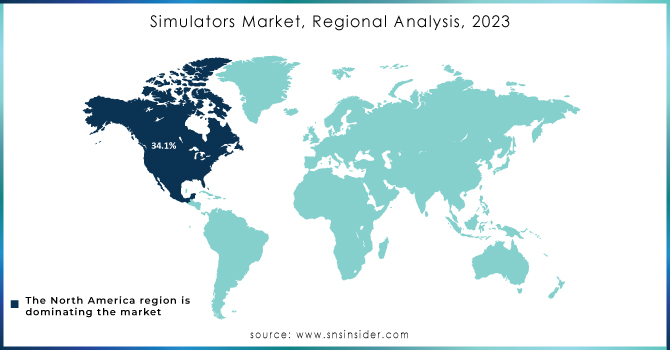
REGIONAL ANALYSIS
North America dominated the market and had a maximum revenue share of 34.1%. The region is expected to continue to dominate the forecast period due to the presence of major players in the US and Canada. Companies in these countries are considered to be investing in research and development activities in order to present the most technologically advanced products on the market. In addition, this region is well known as the first recipient of advanced technology. In Asia Pacific, the market is expected to witness the fastest CAGR in the forecast period.
Rapid growth could be attributed to an increase in manufacturing activities in regional and regional industries, such as automotive and healthcare. The growth of construction and health care facilities in countries such as Japan and India, thereafter driven regional market growth. Europe had an important role to perform. Countries, such as Germany and the U.K., have made significant contributions to regional market growth. The high penetration of AI technology and the increase in security costs in the region are some of the key factors driving market growth.
Need any customization research on Simulators Market - Enquiry Now
REGIONAL COVERAGE:
-
North America
-
USA
-
Canada
-
Mexico
-
-
Europe
-
Germany
-
UK
-
France
-
Italy
-
Spain
-
The Netherlands
-
Rest of Europe
-
-
Asia-Pacific
-
Japan
-
south Korea
-
China
-
India
-
Australia
-
Rest of Asia-Pacific
-
-
The Middle East & Africa
-
Israel
-
UAE
-
South Africa
-
Rest of Middle East & Africa
-
-
Latin America
-
Brazil
-
Argentina
-
Rest of Latin America
-
KEY PLAYERS
The Major Players are CAE Inc., L3Harris Technologies Inc., Thales SA, Saab AB, Indra, Flight Safety International, The Boeing Company, Airbus S.A.S, Tru Simulation + Training Inc., Raytheon Company & Other Players
| Report Attributes | Details |
|---|---|
| Market Size in 2023 | USD 18.6 Billion |
| Market Size by 2032 | USD 34.8 Billion |
| CAGR | CAGR of 7.2% From 2024 to 2032 |
| Base Year | 2023 |
| Forecast Period | 2024-2032 |
| Historical Data | 2020-2022 |
| Report Scope & Coverage | Market Size, Segments Analysis, Competitive Landscape, Regional Analysis, DROC & SWOT Analysis, Forecast Outlook |
| Key Segments | • By Type (Full Mission Bridge Simulators, Full Flight Simulators, Driving Simulators, Fixed Base Simulators, Flight Training Devices, Vessel Traffic Control Simulators, Air Traffic Control Simulators & Others) • By Platform (Airborne, Land, Maritime) • By Solution (Products, Services) • By Application (Military Training, Commercial Training) • By Technique (Gamming Simulation, Synthetic Environment Simulation, Live, Virtual & Constructive (LVC) Simulation) |
| Regional Analysis/Coverage | North America (USA, Canada, Mexico), Europe (Germany, UK, France, Italy, Spain, Netherlands, Rest of Europe), Asia-Pacific (Japan, South Korea, China, India, Australia, Rest of Asia-Pacific), The Middle East & Africa (Israel, UAE, South Africa, Rest of Middle East & Africa), Latin America (Brazil, Argentina, Rest of Latin America) |
| Company Profiles | CAE Inc., L3Harris Technologies Inc., Thales SA, Saab AB, Indra, Flight Safety International, The Boeing Company, Airbus S.A.S, Tru Simulation + Training Inc., Raytheon Company |
| DRIVERS | • The Use of Virtual Pilot Training to Improve Aviation Safety. • Simulators for Unmanned Aerial Systems are being developed. |
| RESTRAINTS | • Replication of Physiological and Environmental Factors Is Limited • Interoperability issues and a lengthy product life-cycle |
Frequently Asked Questions
The Simulators Market was worth USD 18.6 billion in 2023 and is projected to increase to USD 34.8 billion by 2032, with a 7.2% CAGR expected from 2024-2032.
Replication of Physiological and Environmental Factors Is Limited and Interoperability issues along with a lengthy product life-cycle
North America dominated the market and had a maximum revenue share of 34.1%
dependence on online businesses has grown exponentially, where Vendors are experiencing a growing need for simulation solutions in the aftermath of this epidemic
Manufacturers/Service providers, Consultants, Association, Research institutes, private and universities libraries, Suppliers, and Distributors of the product.
Get in Touch
