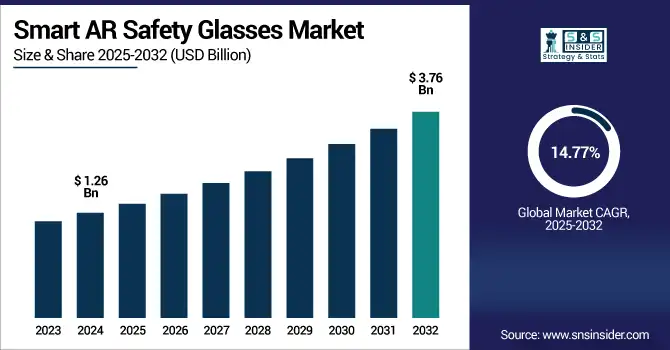
The Smart AR Safety Glasses Market Size was valued at USD 1.26 billion in 2024 and is expected to reach USD 3.76 billion by 2032 and grow at a CAGR of 14.77% over the forecast period 2025-2032.
The global Smart AR Safety Glasses Market is witnessing rapid growth in demand due to the preference for advanced wearable solutions in dangerous and high-risk surroundings. Sectors are embracing hands-free, real-time operation data tools that are designed to make the field worker safer and more productive, and provide better decision-making capability. Improvements to AR systems, display resolution, battery life, and IoT integration are driving acceptance even faster. Furthermore, rising demand for workplace safety and proliferation of AR applications at work in numerous industries are augmenting the growth of the world market.
The U.S. Smart AR Safety Glasses Market size was USD 0.31 billion in 2024 and is expected to reach USD 0.79 billion by 2032, growing at a CAGR of 12.50% over the forecast period of 2025–2032.
The US smart AR safety glasses market demand from manufacturing, logistics and construction sectors will witness substantial growth owing to higher adoption of real-time data and hands-free operations to improve workforce efficiency and safety. Government regulations and investment in AR integrated PPE driving demand across US market Government mandates around workplace safety and investment in AR integrated PPE are also driving demand across the US market with innovation-focused companies pushing for deployments across essential operational functions.
According to research, about 48% of logistics and warehousing companies in the U.S. have adopted AR-based solutions for real-time inventory tracking and worker safety.
Key Drivers:
Growing Integration Of AR With IoT and AI Technologies Improves The Functionality And Adoption Of Smart Safety Wearables.
As IoT and AI become central to industrial automation, their integration with AR wearables is driving market growth. Smart AR glasses now offer features like object recognition, hazard alerts, predictive maintenance, and gesture-controlled interfaces. These advanced capabilities enable proactive decision-making and reduce equipment downtime. The synergy of AI-AR-IoT ecosystems makes these glasses indispensable tools in connected operations, facilitating seamless collaboration and smarter workflows, thereby encouraging enterprises to scale up deployment across large-scale facilities.
According to Deloitte, integrating AI-powered AR tools with real-time sensors can lead to a reduction of up to 40% in workplace accidents by enhancing situational awareness and proactive safety interventions.
Restrain:
Technical Limitations, Such As Battery Life, Connectivity Issues, And Field-Of-View Constraints, Reduce Product Effectiveness In Certain Work Conditions.
Although AR safety glasses have evolved, challenges like limited battery life, slow processing speeds, and unreliable connectivity affect their usability. In industries with continuous operations or environments with electromagnetic interference, such as mining or heavy manufacturing, these limitations restrict effective deployment. Additionally, narrow field-of-view and lack of compatibility with certain safety helmets or prescription lenses further limit their acceptance. These technical hurdles necessitate ongoing R&D investment, delaying adoption and undermining end-user confidence in current-generation products.
Opportunities:
Expansion Of Smart Cities And Infrastructure Projects Fuels Demand For Advanced AR Safety Tools In Construction And Urban Planning.
With governments globally investing in smart city initiatives, infrastructure development is seeing rapid technological integration. AR safety glasses provide engineers, site managers, and field workers with live blueprints, hazard alerts, and guided instructions on-site. Their use in inspection, asset tracking, and quality assurance is growing. These glasses enhance real-time decision-making during complex builds, reduce project delays, and improve safety compliance, creating substantial opportunities for vendors to supply smart eyewear solutions tailored for civil engineering and urban planning environments.
According to research, augmented reality can enhance construction productivity by up to 30% while reducing project errors and delays by approximately 25% to 35% through real-time guidance and improved visualization.
Challenges:
Regulatory And Certification Complexities Across Regions Create Entry Barriers For Manufacturers Entering Safety-Critical AR Markets.
Safety equipment must meet strict industry standards and regional certification requirements before deployment, and AR safety glasses are no exception. However, the hybrid nature of these devices, combining wearables, electronics, and optics, makes compliance more complex. Navigating varying safety codes, data privacy regulations, and wireless communication standards across regions delays time-to-market. These compliance burdens are particularly challenging for startups or new entrants, often requiring costly product reengineering and limiting fast market penetration globally.
By Type
Binocular segment dominated the highest Smart AR Safety Glasses Market share of about 58.23% in 2024, owing to its ability to offer an immersive, wide-angle view of augmented data overlays for both eyes. This enhances spatial awareness, visual precision, and comfort in demanding work environments. It is favored in industries requiring detailed visual information, such as aerospace, automotive, and medical fields. Smart AR Safety Glasses Companies like Microsoft, with its HoloLens series, have significantly contributed to the popularity of binocular AR systems in professional environments.
Hybrid segment is expected to grow at the fastest CAGR of about 16.18% from 2025–2032 due to its combination of both assisted reality and full AR capabilities, enabling users to switch modes based on task complexity. This flexibility is attractive to enterprise users who require both simple data prompts and advanced visualization. Magic Leap is actively advancing hybrid AR technologies that serve multifunctional roles across logistics, manufacturing, and defense sectors. Continuous hardware miniaturization and software optimization are driving further demand for such versatile smart glasses.
By End-User
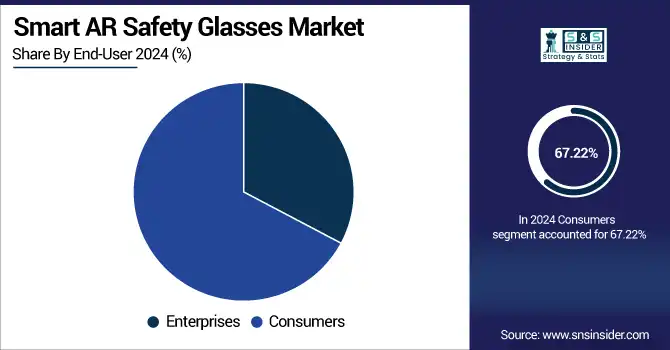
Consumers segment dominated the Smart AR Safety Glasses Market with the highest revenue share of about 67.22% in 2024, primarily due to growing demand for immersive digital experiences in gaming, fitness, and personal safety applications. Wearables integrated with AR functionalities are becoming increasingly popular in lifestyle electronics. With rising consumer interest in smart gadgets and health-focused AR eyewear, Rokid has emerged as a key player, delivering innovative consumer-focused AR glasses through retail and e-commerce platforms.
Enterprises segment is expected to grow at the fastest CAGR of about 15.83% from 2025–2032, propelled by industrial digitization and rising deployment of AR glasses for workforce optimization and safety monitoring. Use cases in sectors like warehousing, field service, utilities, and energy have expanded, with companies leveraging smart eyewear for real-time analytics, remote support, and equipment diagnostics. RealWear has gained strong traction by offering rugged, voice-controlled AR glasses tailored for enterprise-grade field operations and compliance-driven environments.
By Application
Industrial segment dominated the Smart AR Safety Glasses Market with the highest revenue share of about 32.92% in 2024, driven by the need for real-time data access, worker safety, and operational efficiency in hazardous or complex work environments. Use in sectors such as manufacturing, mining, and utilities has surged due to benefits like improved workflow navigation, quality checks, and remote collaboration. Vuzix has been instrumental in supporting industrial deployments with its smart glasses that integrate well with enterprise resource systems.
Automotive segment is expected to grow at the fastest CAGR of about 16.63% from 2025–2032 due to growing applications in assembly line automation, maintenance, and design visualization. Smart AR safety glasses aid in real-time diagnostics, remote expert assistance, and 3D model interaction, enhancing accuracy and productivity. Bosch, a key innovator in automotive technologies, has been advancing AR integration for automotive workflows, helping transform assembly and service operations through smart glasses.
By Connectivity
Wi-Fi segment dominated the Smart AR Safety Glasses Market with the highest revenue share of about 35.63% in 2024, as it provides reliable connectivity for real-time data transmission and remote operations in controlled environments. Industries operating within structured facilities prefer Wi-Fi-based AR glasses for seamless integration with local networks, facilitating remote guidance, task tracking, and cloud access. Google, through its enterprise-focused Google Glass editions, has capitalized on Wi-Fi-connected solutions for industrial and corporate users.
Cellular segment is expected to grow at the fastest CAGR of about 15.72% from 2025–2032, fueled by increasing demand for AR usage in outdoor and remote environments where Wi-Fi is unavailable. With the rollout of 5G, cellular-connected smart glasses can now support high-speed, low-latency data exchange, enabling real-time video streaming, cloud computing, and AR-enabled field support. Epson, through its Moverio series, is enhancing mobile and cellular-connected AR experiences suited for field-based industries and on-the-go professionals.
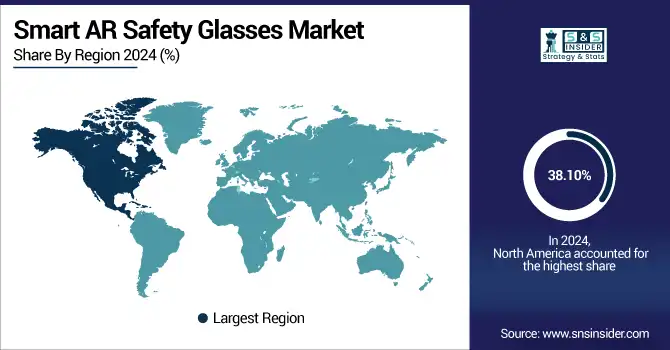
North America dominated the Smart AR Safety Glasses Market with the highest revenue share of about 38.10% in 2024, driven by the strong presence of advanced digital infrastructure, high adoption of AR technologies across industries, and significant investments in workplace safety innovations. The region benefits from supportive regulatory frameworks, early technology adoption in sectors like manufacturing and defense, and a well-established ecosystem for enterprise wearables. High R&D spending and a skilled workforce further reinforce North America’s leadership in driving innovation and widespread implementation of AR safety solutions.
The U.S. leads in North America due to advanced technological infrastructure, early adoption of AR wearables, and strong demand from industrial sectors like manufacturing, defense, and logistics, supported by high R&D investments and stringent workplace safety regulations.
The Asia Pacific segment is expected to grow at the fastest CAGR of about 16.13% from 2025–2032, owing to rapid industrial expansion, increasing labor safety awareness, and growing government investments in smart manufacturing. Countries such as China, Japan, and South Korea are leading the region’s adoption of AR technologies across automotive, electronics, and logistics sectors. The rollout of 5G networks, rising consumer tech engagement, and a surge in digital transformation initiatives are also fueling demand for smart AR safety glasses across industrial and commercial settings in Asia Pacific.
China dominates the Asia Pacific market owing to its large-scale manufacturing base, government-backed smart industry initiatives, rapid adoption of AR in factories, and presence of leading hardware producers accelerating local production and deployment of smart AR safety glasses.
Europe is witnessing steady growth in the Smart AR Safety Glasses Market, driven by strong safety compliance regulations, increasing automation in industries, and rising investments in digital transformation. Countries like Germany, France, and the UK are adopting AR wearables in sectors such as automotive, energy, and healthcare to enhance worker efficiency, reduce risks, and support remote operations.
Germany dominates the European Smart AR Safety Glasses Market due to its strong industrial and automotive sectors, advanced manufacturing infrastructure, and leadership in Industry 4.0 adoption. High emphasis on worker safety and automation further drives demand for AR-integrated safety solutions across German industries.
The Middle East & Africa Smart AR Safety Glasses Market is led by the UAE, driven by its smart infrastructure projects and growing use of AR in oil, gas, and construction sectors. In Latin America, Brazil dominates due to industrial expansion, rising safety standards, and increased adoption of AR in manufacturing environments.
Major Key Players in Smart AR Safety Glasses Market are Microsoft, Google, Meta, Vuzix, Epson, RealWear, Magic Leap, Lenovo, Iristick, Snap and others.
Recent Development:
In October 2024, RealWear rolled out Firmware 2.0 for its Navigator 500/520 Series, introducing an upgrade to Android 13. This update enhanced device security, optimized voice recognition, extended battery performance, and added support for robust 4G LTE connectivity, improving overall functionality in industrial AR applications.
In June 2025, Vuzix announced a strategic AI partnership with Ramblr to upgrade its M400 smart glasses with real-time AI-powered guidance and documentation features. Previously, in September 2022, the company launched Blade 2 as ANSI Z87.1-certified AR eyewear, reinforcing its suitability for industrial safety applications.
Report Attributes | Details |
---|---|
Market Size in 2024 | USD 1.26 Billion |
Market Size by 2032 | USD 3.76 Billion |
CAGR | CAGR of 14.77% From 2025 to 2032 |
Base Year | 2024 |
Forecast Period | 2025-2032 |
Historical Data | 2021-2023 |
Report Scope & Coverage | Market Size, Segments Analysis, Competitive Landscape, Regional Analysis, DROC & SWOT Analysis, Forecast Outlook |
Key Segments | • By Type (Monocular, Binocular, Hybrid) • By End-User (Enterprises, Consumers) • By Application (Industrial, Healthcare, Automotive, Aerospace & Defense, Construction, Others) • By Connectivity (Wi-Fi, Bluetooth, Cellular, Others) |
Regional Analysis/Coverage | North America (US, Canada, Mexico), Europe (Germany, France, UK, Italy, Spain, Poland, Turkey, Rest of Europe), Asia Pacific (China, India, Japan, South Korea, Singapore, Australia,Taiwan, Rest of Asia Pacific), Middle East & Africa (UAE, Saudi Arabia, Qatar, South Africa, Rest of Middle East & Africa), Latin America (Brazil, Argentina, Rest of Latin America) |
Company Profiles | Microsoft, Google, Meta, Vuzix, Epson, RealWear, Magic Leap, Lenovo, Iristick, Snap |
Ans: The Smart AR Safety Glasses Market is expected to grow at a CAGR of 14.77% from 2025-2032.
Ans: The Smart AR Safety Glasses Market size was USD 1.26 billion in 2024 and is expected to reach USD 3.76 billion by 2032.
Ans: The major growth factor of the Smart AR Safety Glasses Market is the increasing demand for hands-free, real-time data visualization in industrial safety, training, and remote support.
Ans: Binocular segment dominated the Smart AR Safety Glasses Market.
Ans: North America dominated the Smart AR Safety Glasses Market in 2024.
Table Of Content
1. Introduction
1.1 Market Definition
1.2 Scope (Inclusion and Exclusions)
1.3 Research Assumptions
2. Executive Summary
2.1 Market Overview
2.2 Regional Synopsis
2.3 Competitive Summary
3. Research Methodology
3.1 Top-Down Approach
3.2 Bottom-up Approach
3.3. Data Validation
3.4 Primary Interviews
4. Market Dynamics Impact Analysis
4.1 Market Driving Factors Analysis
4.1.1 Drivers
4.1.2 Restraints
4.1.3 Opportunities
4.1.4 Challenges
4.2 PESTLE Analysis
4.3 Porter’s Five Forces Model
5. Statistical Insights and Trends Reporting
5.1 Sterilization Compatibility Rate
5.2 Remote Software Update Compliance Rate
5.3 Sensor Fusion Utilization Rate
6. Competitive Landscape
6.1 List of Major Companies By Region
6.2 Market Share Analysis By Region
6.3 Product Benchmarking
6.3.1 Product specifications and features
6.3.2 Pricing
6.4 Strategic Initiatives
6.4.1 Marketing and promotional activities
6.4.2 Distribution and Supply Chain Strategies
6.4.3 Expansion plans and new product launches
6.4.4 Strategic partnerships and collaborations
6.5 Technological Advancements
6.6 Market Positioning and Branding
7. Smart AR Safety Glasses Market Segmentation By Type
7.1 Chapter Overview
7.2 Monocular
7.2.1 Monocular Market Trends Analysis (2021-2032)
7.2.2 Monocular Market Size Estimates and Forecasts to 2032 (USD Billion)
7.3 Binocular
7.3.1 Binocular Market Trends Analysis (2021-2032)
7.3.2 Binocular Market Size Estimates and Forecasts to 2032 (USD Billion)
7.4 Hybrid
7.4.1 Hybrid Market Trends Analysis (2021-2032)
7.4.2 Hybrid Market Size Estimates and Forecasts to 2032 (USD Billion)
8. Smart AR Safety Glasses Market Segmentation By End-User
8.1 Chapter Overview
8.2 Enterprises
8.2.1 Enterprises Market Trends Analysis (2021-2032)
8.2.2 Enterprises Market Size Estimates and Forecasts to 2032 (USD Billion)
8.3 Consumers
8.3.1 Consumers Market Trends Analysis (2021-2032)
8.3.2 Consumers Market Size Estimates and Forecasts to 2032 (USD Billion)
9. Smart AR Safety Glasses Market Segmentation By Application
9.1 Chapter Overview
9.2 Industrial
9.2.1 Industrial Market Trends Analysis (2021-2032)
9.2.2 Industrial Market Size Estimates and Forecasts to 2032 (USD Billion)
9.3 Healthcare
9.3.1 Healthcare Market Trends Analysis (2021-2032)
9.3.2 Healthcare Market Size Estimates and Forecasts to 2032 (USD Billion)
9.4 Automotive
9.4.1 Automotive Market Trends Analysis (2021-2032)
9.4.2 Automotive Market Size Estimates and Forecasts to 2032 (USD Billion)
9.5 Aerospace & Defense
9.5.1 Aerospace & Defense Market Trends Analysis (2021-2032)
9.5.2 Aerospace & Defense Market Size Estimates and Forecasts to 2032 (USD Billion)
9.6 Construction
9.6.1 Construction Market Trends Analysis (2021-2032)
9.6.2 Construction Market Size Estimates and Forecasts to 2032 (USD Billion)
9.7 Others
9.7.1 Others Market Trends Analysis (2021-2032)
9.7.2 Others Market Size Estimates and Forecasts to 2032 (USD Billion)
10. Smart AR Safety Glasses Market Segmentation By Connectivity
10.1 Chapter Overview
10.2 WI-FI
10.2.1 WI-FI Market Trends Analysis (2021-2032)
10.2.2 WI-FI Market Size Estimates and Forecasts to 2032 (USD Billion)
10.3 Bluetooth
10.3.1 Bluetooth Market Trend Analysis (2021-2032)
10.3.2 Bluetooth Market Size Estimates and Forecasts to 2032 (USD Billion)
10.4 Cellular
10.4.1 Cellular Market Trends Analysis (2021-2032)
10.4.2 Cellular Market Size Estimates and Forecasts to 2032 (USD Billion)
10.5 Others
10.5.1 Others Market Trends Analysis (2021-2032)
10.5.2 Others Market Size Estimates and Forecasts to 2032 (USD Billion)
11. Regional Analysis
11.1 Chapter Overview
11.2 North America
11.2.1 Trend Analysis
11.2.2 North America Smart AR Safety Glasses Market Estimates and Forecasts by Country (2021-2032) (USD Billion)
11.2.3 North America Smart AR Safety Glasses Market Estimates and Forecasts By Type (2021-2032) (USD Billion)
11.2.4 North America Smart AR Safety Glasses Market Estimates and Forecasts By End-User (2021-2032) (USD Billion)
11.2.5 North America Smart AR Safety Glasses Market Estimates and Forecasts By Application (2021-2032) (USD Billion)
11.2.6 North America Smart AR Safety Glasses Market Estimates and Forecasts By Connectivity (2021-2032) (USD Billion)
11.2.7 USA
11.2.7.1 USA Smart AR Safety Glasses Market Estimates and Forecasts By Type (2021-2032) (USD Billion)
11.2.7.2 USA Smart AR Safety Glasses Market Estimates and Forecasts By End-User (2021-2032) (USD Billion)
11.2.7.3 USA Smart AR Safety Glasses Market Estimates and Forecasts By Application (2021-2032) (USD Billion)
11.2.7.4 USA Smart AR Safety Glasses Market Estimates and Forecasts By Connectivity (2021-2032) (USD Billion)
11.2.8 Canada
11.2.8.1 Canada Smart AR Safety Glasses Market Estimates and Forecasts By Type (2021-2032) (USD Billion)
11.2.8.2 Canada Smart AR Safety Glasses Market Estimates and Forecasts By End-User (2021-2032) (USD Billion)
11.2.8.3 Canada Smart AR Safety Glasses Market Estimates and Forecasts By Application (2021-2032) (USD Billion)
11.2.8.4 Canada Smart AR Safety Glasses Market Estimates and Forecasts By Connectivity (2021-2032) (USD Billion)
11.2.9 Mexico
11.2.9.1 Mexico Smart AR Safety Glasses Market Estimates and Forecasts By Type (2021-2032) (USD Billion)
11.2.9.2 Mexico Smart AR Safety Glasses Market Estimates and Forecasts By End-User (2021-2032) (USD Billion)
11.2.9.3 Mexico Smart AR Safety Glasses Market Estimates and Forecasts By Application (2021-2032) (USD Billion)
11.2.9.4 Mexico Smart AR Safety Glasses Market Estimates and Forecasts By Connectivity (2021-2032) (USD Billion)
11.3 Europe
11.3.1 Trend Analysis
11.3.2 Europe Smart AR Safety Glasses Market Estimates and Forecasts by Country (2021-2032) (USD Billion)
11.3.3 Europe Smart AR Safety Glasses Market Estimates and Forecasts By Type (2021-2032) (USD Billion)
11.3.4 Europe Smart AR Safety Glasses Market Estimates and Forecasts By End-User (2021-2032) (USD Billion)
11.3.5 Europe Smart AR Safety Glasses Market Estimates and Forecasts By Application (2021-2032) (USD Billion)
11.3.6 Europe Smart AR Safety Glasses Market Estimates and Forecasts By Connectivity (2021-2032) (USD Billion)
11.3.7 Germany
11.3.7.1 Germany Smart AR Safety Glasses Market Estimates and Forecasts By Type (2021-2032) (USD Billion)
11.3.7.2 Germany Smart AR Safety Glasses Market Estimates and Forecasts By End-User (2021-2032) (USD Billion)
11.3.7.3 Germany Smart AR Safety Glasses Market Estimates and Forecasts By Application (2021-2032) (USD Billion)
11.3.7.4 Germany Smart AR Safety Glasses Market Estimates and Forecasts By Connectivity (2021-2032) (USD Billion)
11.3.8 France
11.3.8.1 France Smart AR Safety Glasses Market Estimates and Forecasts By Type (2021-2032) (USD Billion)
11.3.8.2 France Smart AR Safety Glasses Market Estimates and Forecasts By End-User (2021-2032) (USD Billion)
11.3.8.3 France Smart AR Safety Glasses Market Estimates and Forecasts By Application (2021-2032) (USD Billion)
11.3.8.4 France Smart AR Safety Glasses Market Estimates and Forecasts By Connectivity (2021-2032) (USD Billion)
11.3.9 UK
11.3.9.1 UK Smart AR Safety Glasses Market Estimates and Forecasts By Type (2021-2032) (USD Billion)
11.3.9.2 UK Smart AR Safety Glasses Market Estimates and Forecasts By End-User (2021-2032) (USD Billion)
11.3.9.3 UK Smart AR Safety Glasses Market Estimates and Forecasts By Application (2021-2032) (USD Billion)
11.3.9.4 UK Smart AR Safety Glasses Market Estimates and Forecasts By Connectivity (2021-2032) (USD Billion)
11.3.10 Italy
11.3.10.1 ItalySmart AR Safety Glasses Market Estimates and Forecasts By Type (2021-2032) (USD Billion)
11.3.10.2 Italy Smart AR Safety Glasses Market Estimates and Forecasts By End-User (2021-2032) (USD Billion)
11.3.10.3 Italy Smart AR Safety Glasses Market Estimates and Forecasts By Application (2021-2032) (USD Billion)
11.3.10.4 Italy Smart AR Safety Glasses Market Estimates and Forecasts By Connectivity (2021-2032) (USD Billion)
11.3.11 Spain
11.3.11.1 Spain Smart AR Safety Glasses Market Estimates and Forecasts By Type (2021-2032) (USD Billion)
11.3.11.2 Spain Smart AR Safety Glasses Market Estimates and Forecasts By End-User (2021-2032) (USD Billion)
11.3.11.3 Spain Smart AR Safety Glasses Market Estimates and Forecasts By Application (2021-2032) (USD Billion)
11.3.11.4 Spain Smart AR Safety Glasses Market Estimates and Forecasts By Connectivity (2021-2032) (USD Billion)
11.3.12 Poland
11.3.12.1 Poland Smart AR Safety Glasses Market Estimates and Forecasts By Type (2021-2032) (USD Billion)
11.3.12.2 Poland Smart AR Safety Glasses Market Estimates and Forecasts By End-User (2021-2032) (USD Billion)
11.3.12.3 Poland Smart AR Safety Glasses Market Estimates and Forecasts By Application (2021-2032) (USD Billion)
11.3.12.4 Poland Smart AR Safety Glasses Market Estimates and Forecasts By Connectivity (2021-2032) (USD Billion)
11.3.13 Turkey
11.3.13.1 Turkey Smart AR Safety Glasses Market Estimates and Forecasts By Type (2021-2032) (USD Billion)
11.3.13.2 Turkey Smart AR Safety Glasses Market Estimates and Forecasts By End-User (2021-2032) (USD Billion)
11.3.13.3 Turkey Smart AR Safety Glasses Market Estimates and Forecasts By Application (2021-2032) (USD Billion)
11.3.13.4 Turkey Smart AR Safety Glasses Market Estimates and Forecasts By Connectivity (2021-2032) (USD Billion)
11.3.14 Rest of Europe
11.3.14.1 Rest of Europe Smart AR Safety Glasses Market Estimates and Forecasts By Type (2021-2032) (USD Billion)
11.3.14.2 Rest of Europe Smart AR Safety Glasses Market Estimates and Forecasts By End-User (2021-2032) (USD Billion)
11.3.14.3 Rest of Europe Smart AR Safety Glasses Market Estimates and Forecasts By Application (2021-2032) (USD Billion)
11.3.14.4 Rest of Europe Smart AR Safety Glasses Market Estimates and Forecasts By Connectivity (2021-2032) (USD Billion)
11.4 Asia Pacific
11.4.1 Trend Analysis
11.4.2 Asia Pacific Smart AR Safety Glasses Market Estimates and Forecasts by Country (2021-2032) (USD Billion)
11.4.3 Asia Pacific Smart AR Safety Glasses Market Estimates and Forecasts By Type (2021-2032) (USD Billion)
11.4.4 Asia Pacific Smart AR Safety Glasses Market Estimates and Forecasts By End-User (2021-2032) (USD Billion)
11.4.5 Asia Pacific Smart AR Safety Glasses Market Estimates and Forecasts By Application (2021-2032) (USD Billion)
11.4.6 Asia Pacific Smart AR Safety Glasses Market Estimates and Forecasts By Connectivity (2021-2032) (USD Billion)
11.4.7 China
11.4.7.1 China Smart AR Safety Glasses Market Estimates and Forecasts By Type (2021-2032) (USD Billion)
11.4.7.2 China Smart AR Safety Glasses Market Estimates and Forecasts By End-User (2021-2032) (USD Billion)
11.4.7.3 China Smart AR Safety Glasses Market Estimates and Forecasts By Application (2021-2032) (USD Billion)
11.4.7.4 China Smart AR Safety Glasses Market Estimates and Forecasts By Connectivity (2021-2032) (USD Billion)
11.4.8 India
11.4.8.1 India Smart AR Safety Glasses Market Estimates and Forecasts By Type (2021-2032) (USD Billion)
11.4.8.2 India Smart AR Safety Glasses Market Estimates and Forecasts By End-User (2021-2032) (USD Billion)
11.4.8.3 India Smart AR Safety Glasses Market Estimates and Forecasts By Application (2021-2032) (USD Billion)
11.4.8.4 India Smart AR Safety Glasses Market Estimates and Forecasts By Connectivity (2021-2032) (USD Billion)
11.4.9 Japan
11.4.9.1 Japan Smart AR Safety Glasses Market Estimates and Forecasts By Type (2021-2032) (USD Billion)
11.4.9.2 Japan Smart AR Safety Glasses Market Estimates and Forecasts By End-User (2021-2032) (USD Billion)
11.4.9.3 Japan Smart AR Safety Glasses Market Estimates and Forecasts By Application (2021-2032) (USD Billion)
11.4.9.4 Japan Smart AR Safety Glasses Market Estimates and Forecasts By Connectivity (2021-2032) (USD Billion)
11.4.10 South Korea
11.4.10.1 South Korea Smart AR Safety Glasses Market Estimates and Forecasts By Type (2021-2032) (USD Billion)
11.4.10.2 South Korea Smart AR Safety Glasses Market Estimates and Forecasts By End-User (2021-2032) (USD Billion)
11.4.10.3 South Korea Smart AR Safety Glasses Market Estimates and Forecasts By Application (2021-2032) (USD Billion)
11.4.10.4 South Korea Smart AR Safety Glasses Market Estimates and Forecasts By Connectivity (2021-2032) (USD Billion)
11.4.11 Singapore
11.4.11.1 Singapore Smart AR Safety Glasses Market Estimates and Forecasts By Type (2021-2032) (USD Billion)
11.4.11.2 Singapore Smart AR Safety Glasses Market Estimates and Forecasts By End-User (2021-2032) (USD Billion)
11.4.11.3 Singapore Smart AR Safety Glasses Market Estimates and Forecasts By Application (2021-2032) (USD Billion)
11.4.11.4 Singapore Smart AR Safety Glasses Market Estimates and Forecasts By Connectivity (2021-2032) (USD Billion)
11.4.12 Australia
11.4.12.1 Australia Smart AR Safety Glasses Market Estimates and Forecasts By Type (2021-2032) (USD Billion)
11.4.12.2 Australia Smart AR Safety Glasses Market Estimates and Forecasts By End-User (2021-2032) (USD Billion)
11.4.12.3 Australia Smart AR Safety Glasses Market Estimates and Forecasts By Application (2021-2032) (USD Billion)
11.4.12.4 Australia Smart AR Safety Glasses Market Estimates and Forecasts By Connectivity (2021-2032) (USD Billion)
11.4.13 Taiwan
11.4.13.1 Taiwan Smart AR Safety Glasses Market Estimates and Forecasts By Type (2021-2032) (USD Billion)
11.4.13.2 Taiwan Smart AR Safety Glasses Market Estimates and Forecasts By End-User (2021-2032) (USD Billion)
11.4.13.3 Taiwan Smart AR Safety Glasses Market Estimates and Forecasts By Application (2021-2032) (USD Billion)
11.4.13.4 Taiwan Smart AR Safety Glasses Market Estimates and Forecasts By Connectivity (2021-2032) (USD Billion)
11.4.14 Rest of Asia Pacific
11.4.14.1 Rest of Asia Pacific Smart AR Safety Glasses Market Estimates and Forecasts By Type (2021-2032) (USD Billion)
11.4.14.2 Rest of Asia Pacific Smart AR Safety Glasses Market Estimates and Forecasts By End-User (2021-2032) (USD Billion)
11.4.14.3 Rest of Asia Pacific Smart AR Safety Glasses Market Estimates and Forecasts By Application (2021-2032) (USD Billion)
11.4.14.4 Rest of Asia Pacific Smart AR Safety Glasses Market Estimates and Forecasts By Connectivity (2021-2032) (USD Billion)
11.5 Middle East and Africa
11.5.1 Trend Analysis
11.5.2 Middle East and Africa Smart AR Safety Glasses Market Estimates and Forecasts by Country (2021-2032) (USD Billion)
11.5.3 Middle East and Africa Smart AR Safety Glasses Market Estimates and Forecasts By Type (2021-2032) (USD Billion)
11.5.4 Middle East and Africa Smart AR Safety Glasses Market Estimates and Forecasts By End-User (2021-2032) (USD Billion)
11.5.5 Middle East and Africa Smart AR Safety Glasses Market Estimates and Forecasts By Application (2021-2032) (USD Billion)
11.5.6 Middle East and Africa Smart AR Safety Glasses Market Estimates and Forecasts By Connectivity (2021-2032) (USD Billion)
11.5.7 UAE
11.5.7.1 UAE Smart AR Safety Glasses Market Estimates and Forecasts By Type (2021-2032) (USD Billion)
11.5.7.2 UAE Smart AR Safety Glasses Market Estimates and Forecasts By End-User (2021-2032) (USD Billion)
11.5.7.3 UAE Smart AR Safety Glasses Market Estimates and Forecasts By Application (2021-2032) (USD Billion)
11.5.7.4 UAE Smart AR Safety Glasses Market Estimates and Forecasts By Connectivity (2021-2032) (USD Billion)
11.5.8 Saudi Arabia
11.5.8.1 Saudi Arabia Smart AR Safety Glasses Market Estimates and Forecasts By Type (2021-2032) (USD Billion)
11.5.8.2 Saudi Arabia Smart AR Safety Glasses Market Estimates and Forecasts By End-User (2021-2032) (USD Billion)
11.5.8.3 Saudi Arabia Smart AR Safety Glasses Market Estimates and Forecasts By Application (2021-2032) (USD Billion)
11.5.8.4 Saudi Arabia Smart AR Safety Glasses Market Estimates and Forecasts By Connectivity (2021-2032) (USD Billion)
11.5.9 Qatar
11.5.9.1 Qatar Smart AR Safety Glasses Market Estimates and Forecasts By Type (2021-2032) (USD Billion)
11.5.9.2 Qatar Smart AR Safety Glasses Market Estimates and Forecasts By End-User (2021-2032) (USD Billion)
11.5.9.3 Qatar Smart AR Safety Glasses Market Estimates and Forecasts By Application (2021-2032) (USD Billion)
11.5.1.9.4 Qatar Smart AR Safety Glasses Market Estimates and Forecasts By Connectivity (2021-2032) (USD Billion)
11.5.10 South Africa
11.5.10.1 South Africa Smart AR Safety Glasses Market Estimates and Forecasts By Type (2021-2032) (USD Billion)
11.5.10.2 South Africa Smart AR Safety Glasses Market Estimates and Forecasts By End-User (2021-2032) (USD Billion)
11.5.10.3 South Africa Smart AR Safety Glasses Market Estimates and Forecasts By Application (2021-2032) (USD Billion)
11.5.10.4 South Africa Smart AR Safety Glasses Market Estimates and Forecasts By Connectivity (2021-2032) (USD Billion)
11.5.11 Rest of Middle East & Africa
11.5.11.1 Rest of Middle East & Africa Smart AR Safety Glasses Market Estimates and Forecasts By Type (2021-2032) (USD Billion)
11.5.11.2 Rest of Middle East & Africa Smart AR Safety Glasses Market Estimates and Forecasts By End-User (2021-2032) (USD Billion)
11.5.11.3 Rest of Middle East & Africa Smart AR Safety Glasses Market Estimates and Forecasts By Application (2021-2032) (USD Billion)
11.5.11.4 Rest of Middle East & Africa Smart AR Safety Glasses Market Estimates and Forecasts By Connectivity (2021-2032) (USD Billion)
11.6 Latin America
11.6.1 Trend Analysis
11.6.2 Latin America Smart AR Safety Glasses Market Estimates and Forecasts by Country (2021-2032) (USD Billion)
11.6.3 Latin America Smart AR Safety Glasses Market Estimates and Forecasts By Type (2021-2032) (USD Billion)
11.6.4 Latin America Smart AR Safety Glasses Market Estimates and Forecasts By End-User (2021-2032) (USD Billion)
11.6.5 Latin America Smart AR Safety Glasses Market Estimates and Forecasts By Application (2021-2032) (USD Billion)
11.6.6 Latin America Smart AR Safety Glasses Market Estimates and Forecasts By Connectivity (2021-2032) (USD Billion)
11.6.7 Brazil
11.6.7.1 Brazil Smart AR Safety Glasses Market Estimates and Forecasts By Type (2021-2032) (USD Billion)
11.6.7.2 Brazil Smart AR Safety Glasses Market Estimates and Forecasts By End-User (2021-2032) (USD Billion)
11.6.7.3 Brazil Smart AR Safety Glasses Market Estimates and Forecasts By Application (2021-2032) (USD Billion)
11.6.7.4 Brazil Smart AR Safety Glasses Market Estimates and Forecasts By Connectivity (2021-2032) (USD Billion)
11.6.8 Argentina
11.6.8.1 Argentina Smart AR Safety Glasses Market Estimates and Forecasts By Type (2021-2032) (USD Billion)
11.6.8.2 Argentina Smart AR Safety Glasses Market Estimates and Forecasts By End-User (2021-2032) (USD Billion)
11.6.8.3 Argentina Smart AR Safety Glasses Market Estimates and Forecasts By Application (2021-2032) (USD Billion)
11.6.8.4 Argentina Smart AR Safety Glasses Market Estimates and Forecasts By Connectivity (2021-2032) (USD Billion)
11.6.9 Rest of Latin America
11.6.9.1 Rest of Latin America Smart AR Safety Glasses Market Estimates and Forecasts By Type (2021-2032) (USD Billion)
11.6.9.2 Rest of Latin America Smart AR Safety Glasses Market Estimates and Forecasts By End-User (2021-2032) (USD Billion)
11.6.9.3 Rest of Latin America Smart AR Safety Glasses Market Estimates and Forecasts By Application (2021-2032) (USD Billion)
11.6.9.4 Rest of Latin America Smart AR Safety Glasses Market Estimates and Forecasts By Connectivity (2021-2032) (USD Billion)
12. Company Profiles
12.1 Microsoft
12.1.1 Company Overview
12.1.2 Financial
12.1.3 Products/ Services Offered
12.1.4 SWOT Analysis
12.2 Google
12.2.1 Company Overview
12.2.2 Financial
12.2.3 Products/ Services Offered
12.2.4 SWOT Analysis
12.3 Meta
12.3.1 Company Overview
12.3.2 Financial
12.3.3 Products/ Services Offered
12.3.4 SWOT Analysis
12.4 Vuzix
12.4.1 Company Overview
12.4.2 Financial
12.4.3 Products/ Services Offered
12.4.4 SWOT Analysis
12.5 Epson
12.5.1 Company Overview
12.5.2 Financial
12.5.3 Products/ Services Offered
12.5.4 SWOT Analysis
12.6 RealWear
12.6.1 Company Overview
12.6.2 Financial
12.6.3 Products/ Services Offered
12.6.4 SWOT Analysis
12.7 Magic Leap
12.7.1 Company Overview
12.7.2 Financial
12.7.3 Products/ Services Offered
12.7.4 SWOT Analysis
12.8 Lenovo
12.8.1 Company Overview
12.8.2 Financial
12.8.3 Products/ Services Offered
12.8.4 SWOT Analysis
12.9 Iristick
12.9.1 Company Overview
12.9.2 Financial
12.9.3 Products/ Services Offered
12.9.4 SWOT Analysis
12.10 Snap
12.10.1 Company Overview
12.10.2 Financial
12.10.3 Products/ Services Offered
12.10.4 SWOT Analysis
13. Use Cases and Best Practices
14. Conclusion
An accurate research report requires proper strategizing as well as implementation. There are multiple factors involved in the completion of good and accurate research report and selecting the best methodology to compete the research is the toughest part. Since the research reports we provide play a crucial role in any company’s decision-making process, therefore we at SNS Insider always believe that we should choose the best method which gives us results closer to reality. This allows us to reach at a stage wherein we can provide our clients best and accurate investment to output ratio.
Each report that we prepare takes a timeframe of 350-400 business hours for production. Starting from the selection of titles through a couple of in-depth brain storming session to the final QC process before uploading our titles on our website we dedicate around 350 working hours. The titles are selected based on their current market cap and the foreseen CAGR and growth.
The 5 steps process:
Step 1: Secondary Research:
Secondary Research or Desk Research is as the name suggests is a research process wherein, we collect data through the readily available information. In this process we use various paid and unpaid databases which our team has access to and gather data through the same. This includes examining of listed companies’ annual reports, Journals, SEC filling etc. Apart from this our team has access to various associations across the globe across different industries. Lastly, we have exchange relationships with various university as well as individual libraries.
Step 2: Primary Research
When we talk about primary research, it is a type of study in which the researchers collect relevant data samples directly, rather than relying on previously collected data. This type of research is focused on gaining content specific facts that can be sued to solve specific problems. Since the collected data is fresh and first hand therefore it makes the study more accurate and genuine.
We at SNS Insider have divided Primary Research into 2 parts.
Part 1 wherein we interview the KOLs of major players as well as the upcoming ones across various geographic regions. This allows us to have their view over the market scenario and acts as an important tool to come closer to the accurate market numbers. As many as 45 paid and unpaid primary interviews are taken from both the demand and supply side of the industry to make sure we land at an accurate judgement and analysis of the market.
This step involves the triangulation of data wherein our team analyses the interview transcripts, online survey responses and observation of on filed participants. The below mentioned chart should give a better understanding of the part 1 of the primary interview.
Part 2: In this part of primary research the data collected via secondary research and the part 1 of the primary research is validated with the interviews from individual consultants and subject matter experts.
Consultants are those set of people who have at least 12 years of experience and expertise within the industry whereas Subject Matter Experts are those with at least 15 years of experience behind their back within the same space. The data with the help of two main processes i.e., FGDs (Focused Group Discussions) and IDs (Individual Discussions). This gives us a 3rd party nonbiased primary view of the market scenario making it a more dependable one while collation of the data pointers.
Step 3: Data Bank Validation
Once all the information is collected via primary and secondary sources, we run that information for data validation. At our intelligence centre our research heads track a lot of information related to the market which includes the quarterly reports, the daily stock prices, and other relevant information. Our data bank server gets updated every fortnight and that is how the information which we collected using our primary and secondary information is revalidated in real time.
Step 4: QA/QC Process
After all the data collection and validation our team does a final level of quality check and quality assurance to get rid of any unwanted or undesired mistakes. This might include but not limited to getting rid of the any typos, duplication of numbers or missing of any important information. The people involved in this process include technical content writers, research heads and graphics people. Once this process is completed the title gets uploader on our platform for our clients to read it.
Step 5: Final QC/QA Process:
This is the last process and comes when the client has ordered the study. In this process a final QA/QC is done before the study is emailed to the client. Since we believe in giving our clients a good experience of our research studies, therefore, to make sure that we do not lack at our end in any way humanly possible we do a final round of quality check and then dispatch the study to the client.
Key Segments:
By Type
Monocular
Binocular
Hybrid
By End-User
Enterprises
Consumers
By Application
Industrial
Healthcare
Automotive
Aerospace & Defense
Construction
Others
By Connectivity
Wi-Fi
Bluetooth
Cellular
Others
Request for Segment Customization as per your Business Requirement: Segment Customization Request
Regional Coverage:
North America
US
Canada
Mexico
Europe
Germany
France
UK
Italy
Spain
Poland
Turkey
Rest of Europe
Asia Pacific
China
India
Japan
South Korea
Singapore
Australia
Taiwan
Rest of Asia Pacific
Middle East & Africa
UAE
Saudi Arabia
Qatar
South Africa
Rest of Middle East & Africa
Latin America
Brazil
Argentina
Rest of Latin America
Request for Country Level Research Report: Country Level Customization Request
Available Customization
With the given market data, SNS Insider offers customization as per the company’s specific needs. The following customization options are available for the report:
Detailed Volume Analysis
Criss-Cross segment analysis (e.g. Product X Application)
Competitive Product Benchmarking
Geographic Analysis
Additional countries in any of the regions
Customized Data Representation
Detailed analysis and profiling of additional market players