Thermal Imaging Market Report Scope & Overview:
The Thermal Imaging Market Size was valued at USD 6.88 Billion in 2025 and is projected to reach USD 14.41 Billion by 2035, growing at a CAGR of 7.67% during 2026–2035.
Thermal Imaging Industry demand rises with need for advanced surveillance and security across defense, law enforcement, and border control applications the global Thermal Imaging Market Played Out Currently Read More 3D Marine & Scale Model Applications Market Report 2026-2035 Marine or physical model visualization has always been a key part of any inspection and testing. Market growth is also bolstered by rising penetration in industrial inspection, predictive maintenance, and firefighting applications. The adoption of thermal cameras as an advanced driver assistance system (ADAS) component in a near-future autonomous vehicle also significantly contributes to the growth of automotive thermal imaging systems.
Market Size and Forecast:
-
Market Size in 2025: USD 6.88 Billion
-
Market Size by 2035: USD 14.41 Billion
-
CAGR: 7.67% during 2026–2035
-
Base Year: 2025
-
Forecast Period: 2026–2035
-
Historical Data: 2022–2024

To Get more information on Thermal Imaging Market - Request Free Sample Report
Thermal Imaging Market Key Trends:
-
Increasing adoption of thermal imaging in defense, surveillance, and border security is driving market growth.
-
Growing use in industrial inspection, predictive maintenance, and condition monitoring is boosting demand.
-
Rising integration of thermal cameras in automotive safety systems and autonomous vehicles is accelerating adoption.
-
Expanding applications in healthcare, particularly for fever screening and early diagnosis, are shaping market trends.
-
Advancements in infrared sensor technology and miniaturization are improving device performance and affordability.
-
Increasing deployment in smart homes, smart cities, and building automation is supporting market expansion.
-
Collaborations between technology providers, OEMs, and government agencies are fostering innovation and global market penetration.
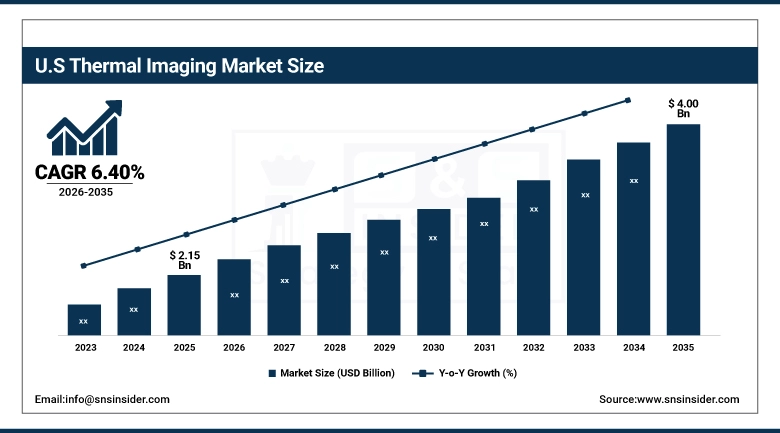
U.S. Thermal Imaging Market Size Outlook:
The U.S. Thermal Imaging Market size was valued at USD 2.15 Billion in 2025 and is projected to reach USD 4.00 Billion by 2035, growing at a CAGR of 6.40% during 2026–2035. Growth in the U.S. thermal imaging industry is driven by strong defense spending, increasing homeland security needs, and widespread adoption in industrial inspection and predictive maintenance. Rising use in automotive safety systems and healthcare applications further supports steady market expansion.
Key Drivers: Rising demand for thermal imaging in defense, surveillance, and industrial applications driving market growth due to its ability to detect heat signatures in low-visibility conditions
Thermal Imaging Technology is widely adopted within defense and homeland security for border surveillance, target acquisition, and night vision features. Increasing geopolitical tensions are driving demand for sophisticated security systems. Thermal cameras are one of the most used equipment for predictive maintenance, monitoring equipment underlying and detecting bolts in industrial sectors hence reducing downtime and operational costs. They also improve situational awareness to be used in firefighting and rescue situations. Advances in infrared sensor and decreasing costs are also driving broad adoption in many other industries.
Key Restraints: High initial costs and technical limitations of thermal imaging systems restricting widespread adoption across price-sensitive markets
Thermal imagers carrying the more refined imaging devices in terms of resolution and other functionality come at considerable initial cost, thus they are difficult to procure for small to medium enterprises. Infrared sensors and many other specialized components add to pricing difficulties too. Moreover, if the object is behind a transparent wall made of material that absorbs invisible light, thermal cameras may not be able to see the object, decreasing the effectiveness of its applications. The absence of awareness and expertise in developing regions also limits adoption. Limitations of budget in certain sectors lumped with presence of alternate technologies are also creating barriers in the market growth.
Key Opportunities: Expanding applications in automotive, healthcare, and smart infrastructure creating significant growth opportunities for the thermal imaging market
Recent technological advancements in thermal imaging coupled with its application in advanced driver assistance systems (ADAS) and autonomous vehicles are set to drive growth over the coming years. Thermal cameras have seen some gain in popularity for non-invasive diagnostics and fever screening, for healthcare reasons post pandemic. Thermal imaging demand is also rising from the increasing trend towards smart cities and smart buildings through their use in energy efficiency monitoring and security systems. Moreover, advancements like small but inexpensive handheld devices are increasing usage among both commercial and home users alike. This will be enabled by strategic collaborations between technology providers and industry players to identify new growth opportunities around the world.
Thermal Imaging Market Segments:
-
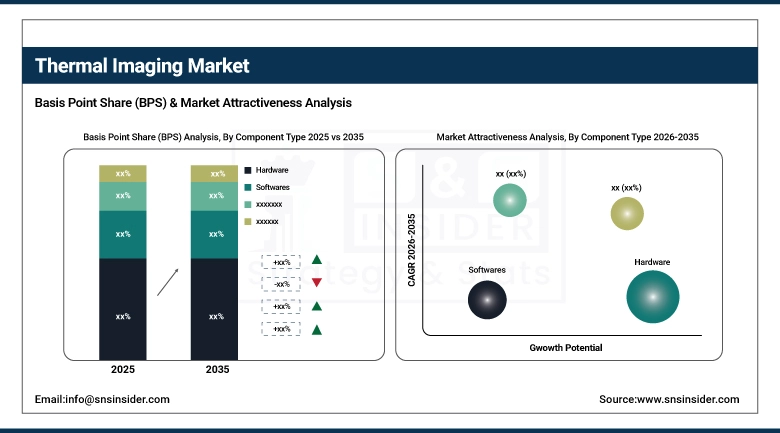
By Component: In 2025, Hardware dominated with 54% share; Software fastest growing segment during 2026–2035
-
By Technology: In 2025, Uncooled Infrared Imaging dominated with 62% share; Short-Wave Infrared (SWIR) fastest growing segment during 2026–2035
-
By Application: In 2025, Surveillance & Security dominated with 38% share; Healthcare & Medical fastest growing segment during 2026–2035
-
By End User: In 2025, Defense & Military dominated with 41% share; Commercial & Residential fastest growing segment during 2026–2035
By Component, Hardware segment dominates the Market, Software segment expected to grow fastest
The Thermal Imaging Market by Component was led by the Hardware segment in 2025. This is because of the increase of uses of thermal cameras, infrared sensors, and imaging modules in defense, industrial, and commercial applications. Since hardware is the basis of thermal Imaging systems So if there is a question about imagines finding the temperature accurately through the thermal camera is possible only, because it is due to imaging where health monitoring occurs. Coupled with mass implementation in surveillance, firefighting and maintenance, it further fortifies its reign.
Among Component types, the Thermal Imaging Industry is segmented as Hardware, Software and Services, of which Software segment is estimated to have fastest CAGR in the forecast period of 2026–2035. The growth is due to the demand of advance analytics, image processing, and AI-based thermal data interpretation. The software solutions add real-time monitoring, automation, and integration with smart systems, and they are essential for next-generation appliance thermal imaging applications.
By Technology, Uncooled Infrared Imaging segment dominates the Market, Short-Wave Infrared (SWIR) segment expected to grow fastest
Uncooled Infrared Imaging segment is dominating the Thermal Imaging Market, this is mainly due to cost-effectiveness, smaller size, and easy availability, and hence has wider application in commercial and industrial. As they are not cryogenic cooled, these systems are more robust, more suitable for portable devices. This continued increase in usage in security, building inspection, and automotive applications reinforces their leadership position.
The Short-Wave Infrared (SWIR) category predicted to show their highest CAGR during 2026–2035. That is because its imaging capabilities are a lot greater and can be particularly excellent for low-light or other difficult environmental conditions. SWIR technology specific for advanced applications like semiconductor inspection, surveillance, and scientific research continues to propel rapid adoption.
By Application, Surveillance & Security segment dominates the Market, Healthcare & Medical segment expected to grow fastest
In 2025, the largest market share was held by Surveillance & Security segment, as a result of rising adoption for border vigilance, public safety & critical infrastructure protection. In darkness and bad weather, one can see a clear image, and this is the reason why it is in full demand in defense and law enforcement agencies.
During the forecast period of 2026–2035, the growth of the Healthcare & Medical segment are projected to rise with the fastest CAGR. Growth in thermal imaging for non-invasive fever detection, inflammation monitoring, and other diagnostics is contributing to such growth. Increased awareness regarding early disease detection and developing automated medical imaging technologies are additional factors likely to facilitate growth of this segment.
By End User, Defense & Military segment dominates the Market, Commercial & Residential segment expected to grow fastest
In 2025, Defense & Military held the largest share of the Thermal Imaging Industry, driven by high investments in advanced surveillance systems, night vision devices and target acquisition systems. Thermal imaging is a critical component of modern warfare and border security, and in practice it helps the military to operate optimally and safely.
In Commercial & Residential Segment this growth is attributed to rising adoption in smart homes, building automation, and energy efficient monitoring. This segment is estimated to grow further due to the increasing demand for economic & compact thermal devices for households and businesses.
Regional Insights:
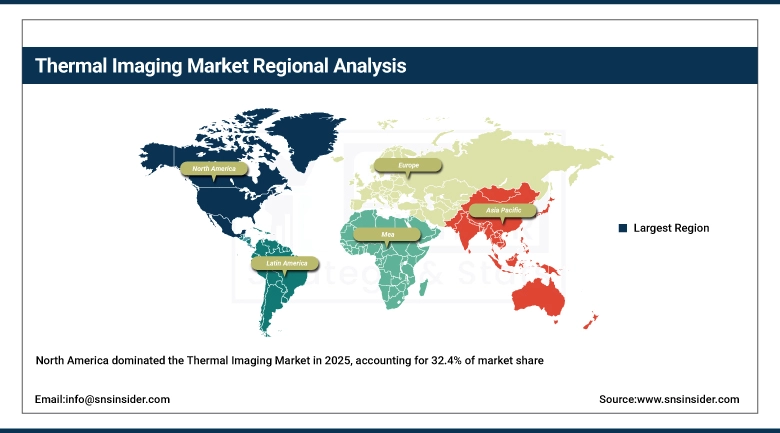
North America Thermal Imaging Market Insights:
North America thermal imaging market, which is projected to share 32.4% of the market in 2025 due to huge defense investment, presence of major players and high adoption across industrial and commercial sectors. Rising proliferation of advanced infrastructure and surveillance systems along with the absorbing use of thermal imaging in predictive maintenance and security applications within the region are boosting this segment of the overall market. Moreover, the rising government expenditures towards military advancement and smart infrastructure projects are progressively contributing to the market growth within the region of United States and Canada.
Get Customized Report as per Your Business Requirement - Enquiry Now
Asia-Pacific Thermal Imaging Market Insights:
During the forecast period 2026–2035, the Asia-Pacific thermal imaging industry is estimated to possess a CAGR of 8.5%. Demand for growth has been supplemented by an increase in defense spending along with rapid industrialization and ever-increasing adoption of thermal imaging in countries like China, India, Japan and South Korea. Increasing infrastructure development and smart city projects, along with the rising adoption of predictive maintenance and security solutions, are driving demand in the region.
Europe Thermal Imaging Market Insights:
The Europe thermal imaging market is driven by well-developed industrial ecosystem, an increasing focus on workplace safety, and high adoption of energy-efficient building inspection technologies. Tight safety regulations and high utilization of thermal imaging in automotive and aerospace sector, have created significant demand in countries including Germany, UK, and France. The other key contribution towards the market expansion is smart technologies, aided by an increase in research and development.
Latin America Thermal Imaging Market Insights:
The thermal imaging industry in Latin America is in a growth stage because of the significant investments in the security and surveillance infrastructure and increasing industrial activities. Thermal imaging being used for a number of applications which includes border security, oil & gas monitoring and infrastructure inspection among others is also emerging with major players setting foot at Brazil and Mexico all the more enhancing the scope of growth. Economic recovery and growth, along with awareness of advanced technologies through various means, are factors driving market growth.
Middle East & Africa (MEA) Thermal Imaging Market Insights:
The driving factors for the growth of thermal imaging industry in Middle East & Africa include rising security and surveillance demand, especially in critical infrastructure and oil & gas sectors. A surge of defense expenditures is expected to fuel growth, coupled with on-field adoption driven by the necessity for advance monitoring solutions in extreme environmental conditions. Further fuelling demand with investments on smart city projects and infrastructure development Saudi Arabia, the UAE, and South Africa.
Thermal Imaging Market Competitive Landscape:
FLIR Systems Inc. is the world leading provider of thermal imaging technologies and solutions with a diverse portfolio of infrared, or "IR", camera, sensor and imaging technology and software products in defense, industrial and commercial applications. Strong Emerging Market: Its leading market position is backed up by ongoing innovations, excellent reliability of the product, and a very high rate of use in surveillance, firefighting, and predictive maintenance. Deployment along with augmented analytics and intelligent technology amplifies its advantages over competitors. There is continuing demand for them because of a broad global distribution network and a strong government and enterprise presence.
-
In March 2025, FLIR Systems expanded its thermal camera portfolio with enhanced AI-enabled imaging solutions, focusing on improved real-time analytics and industrial automation capabilities, strengthening its position in next-generation thermal imaging applications.
Teledyne Technologies is a key player in the thermal imaging market, offering advanced infrared sensors and imaging systems through its subsidiary Teledyne FLIR. The company’s strength lies in its high-performance imaging technologies, strong R&D capabilities, and diversified applications across aerospace, defense, and industrial sectors. Its strategic acquisitions and technological advancements have enhanced its product offerings and global reach.
-
In February 2025, Teledyne Technologies introduced next-generation infrared imaging sensors with improved sensitivity and resolution, targeting defense and industrial inspection applications, thereby strengthening its competitive positioning in the global thermal imaging industry.
Thermal Imaging Companies are:
-
Teledyne Technologies
-
Raytheon Technologies
-
Leonardo DRS
-
L3 Technologies
-
Opgal
-
Hikvision
-
Axis Communications
-
FLIR OEM Solutions
-
Bosch Security Systems
-
Northrop Grumman
-
Dahua Technology
-
Cisco Systems
-
Honeywell
-
Thales Group
-
PerkinElmer
-
Siemens
-
GE Measurement & Control
-
Advances Thermal Imaging Co.
| Report Attributes | Details |
|---|---|
| Market Size in 2025 | USD 6.88 Billion |
| Market Size by 2035 | USD 14.41 Billion |
| CAGR | CAGR of 7.67% From 2026 to 2035 |
| Base Year | 2025 |
| Forecast Period | 2026-2035 |
| Historical Data | 2022-2024 |
| Report Scope & Coverage | Market Size, Segments Analysis, Competitive Landscape, Regional Analysis, DROC & SWOT Analysis, Forecast Outlook |
| Key Segments | • By Component Type: (Hardware, Software, Services) • By Technology: (Cooled Infrared Imaging, Uncooled Infrared Imaging, Short-Wave Infrared (SWIR)) • By Application: (Surveillance & Security, Industrial Inspection & Maintenance, Healthcare & Medical) • By End User: (Defense & Military, Industrial, Commercial & Residential) |
| Regional Analysis/Coverage | North America (US, Canada), Europe (Germany, UK, France, Italy, Spain, Russia, Poland, Rest of Europe), Asia Pacific (China, India, Japan, South Korea, Australia, ASEAN Countries, Rest of Asia Pacific), Middle East & Africa (UAE, Saudi Arabia, Qatar, South Africa, Rest of Middle East & Africa), Latin America (Brazil, Argentina, Mexico, Colombia, Rest of Latin America). |
| Company Profiles | FLIR Systems, Teledyne Technologies, Raytheon Technologies, Leonardo DRS, L3 Technologies, Seek Thermal, Opgal, HIKVISION, Axis Communications, FLIR OEM Solutions, Bosch Security Systems, Northrop Grumman, Dahua Technology, CISCO Systems, Honeywell, Thales Group, PerkinElmer, Siemens, GE Measurement & Control, Advances Thermal Imaging Co. |
Get in Touch
