Smart Enterprise Market Report Scope & Overview:
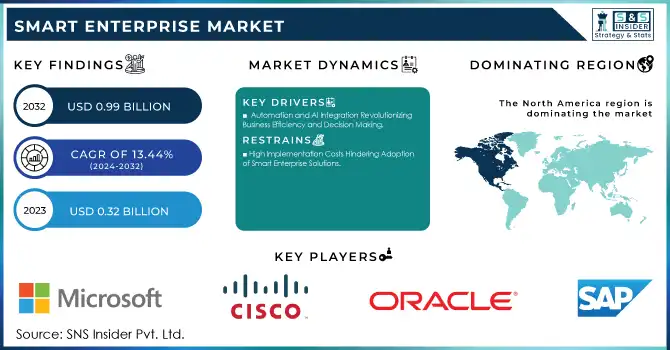
The Smart Enterprise Market was valued at USD 0.32 billion in 2023 and is expected to reach USD 0.99 billion by 2032, growing at a CAGR of 13.44% from 2024-2032.
To Get More Information on Smart Enterprise Market - Request Sample Report
The Smart Enterprise Market is witnessing significant growth as companies worldwide embark on swift digital transformation, aiming to implement advanced technologies to improve their operations. This change is propelled by the combination of the Internet of Things, Artificial Intelligence, machine learning, and cloud computing, allowing businesses to develop more efficient, interconnected, and smart environments. Research indicates that 94% of companies host a considerable share of their workloads in the cloud, highlighting the extensive adoption of cloud services by businesses. 42% of IT professionals in large companies have implemented AI, while another 40% are currently investigating the use of the technology, reflecting a significant interest in AI adoption. In December 2024, Lantronix finalized its purchase of DZS's NetComm Enterprise IoT collection for USD 6.5 million, bolstering its industrial and enterprise IoT offerings. With the convergence of these technologies, the need for intelligent enterprise solutions increases, as businesses seek to optimize processes, enhance productivity, and make better-informed choices.
The rising demand for intelligent enterprise technologies is further fueled by companies’ increasing necessity to stay competitive within intricate global market conditions. As customer demands change, businesses are adopting intelligent solutions to customize experiences, streamline supply chains, and enhance overall service provision. In May 2024, ABB purchased Siemens' Wiring Accessories division in China, enhancing its electrification range with intelligent home systems, smart locks, and associated products, indicating a rising trend of acquisitions focused on strengthening smart technology capabilities. This increased emphasis on providing exceptional customer value is resulting in a broader implementation of advanced enterprise resource planning systems and other intelligent tools, particularly in sectors such as manufacturing, healthcare, retail, and finance, where operational efficiency and real-time data are essential.
Looking ahead, the Smart Enterprise Market is filled with opportunities, especially in fields such as AI-based automation, predictive analytics, and edge computing, which will keep influencing the market's development. In June 2024, Rockwell Automation revealed its partnership with NVIDIA to enhance intelligent automation and mobile robotics for manufacturing and logistics, strengthening the push for innovative, AI-based solutions. These technologies offer organizations methods to enhance operations and facilitate the creation of new business models that promote increased collaboration and innovation. Moreover, as sustainability rises in importance, innovative approaches that enhance energy efficiency and minimize waste are gaining popularity. As new technologies like 5G and blockchain approach, businesses have numerous chances to leverage fresh innovations, paving the way for expansion, savings, and lasting achievement.
Smart Enterprise Market Dynamics
Drivers
-
Automation and AI Integration Revolutionizing Business Efficiency and Decision Making
The integration of automation and AI is changing the Smart Enterprise Market as it introduces efficiency and cuts costs. The application of AI and machine learning technologies allows businesses to automate repetitive tasks, reduce human error, and enhance decision-making processes. Since automation streamlines the workflow, the companies can shift human resources towards more valuable activities and maximize productivity. AI facilitates real-time analysis of vast data and delivers actionable insights that increase accuracy and strategic planning. This enhances operational efficiency while also increasing business agility, allowing companies to swiftly respond to market fluctuations and customer needs. As organizations progressively adopt these technologies, they are altering their operations, attaining improved cost-efficiency, and promoting innovation. The increasing dependence on AI and automation is paving the way for the future of intelligent companies, where organizations are not just more efficient but also more adaptable, competitive, and data-informed in their processes.
-
Rise of Remote Work and Collaboration Tools Transforming Smart Enterprise Solutions
The emergence of hybrid and remote work models is boosting the need for intelligent enterprise solutions, such as collaboration tools, cloud technologies, and digital workflows. With companies adopting decentralized teams, the demand for smooth communication and cooperation has grown crucial. Intelligent collaboration tools allow teams to operate effectively no matter where they are, whereas cloud solutions offer secure, adaptable access to data and applications. Digital workflows optimize operations, guaranteeing efficiency and uniformity among remote teams. These technologies not only facilitate remote work but also improve organizational flexibility, enabling companies to swiftly adjust to evolving conditions. With the workforce becoming more widely dispersed, it is crucial to adopt these intelligent tools to sustain efficient operations, promote collaboration, and guarantee business continuity in an ever-changing digital environment. This transition is driving expansion in the smart enterprise sector, as companies allocate funds for resources to aid their remote employees.
Restraints
-
High Implementation Costs Hindering Adoption of Smart Enterprise Solutions
The substantial expenses involved in adopting smart technologies like AI, automation solutions, and cloud services pose major financial obstacles for numerous companies, particularly small and medium-sized businesses. These firms frequently encounter tight budgets, which makes it difficult to cover the significant initial costs needed for these advanced solutions. For critical applications, one hour of downtime can result in costs of USD 67,651, whereas for standard applications, it amounts to USD 61,642, underscoring the financial consequences of service interruptions. Besides the initial costs, companies need to factor in recurring expenses for maintenance, software updates, and training staff to adjust to new technologies. The overall cost of ownership can serve as a significant hindrance, particularly when the return on investment is not readily apparent. Even sizable organizations might be reluctant to heavily invest in smart enterprise systems without the guarantee of swift financial returns. This economic pressure hinders the adoption of intelligent enterprise solutions and restricts companies from fully tapping into the capabilities of these technologies, thereby limiting the market's growth and expansion.
-
Challenges in Integrating New Smart Technologies with Legacy Systems Impeding Market Growth
Incorporating new intelligent systems with current legacy infrastructure can be a complicated, lengthy, and expensive endeavor that obstructs the implementation of smart enterprise solutions. Companies that depend on obsolete systems frequently encounter compatibility problems when attempting to integrate modern technologies like AI, automation, or cloud-based solutions. The integration procedure might necessitate considerable system renovations, modifications, or possibly total substitutions of outdated infrastructure, which can prove costly and disruptive. Moreover, the duration needed for effective integration may result in business interruptions and postponements in obtaining the advantages of innovative technologies. The specialized knowledge required to facilitate a seamless transition further complicates matters, since numerous organizations might lack the internal capabilities to handle such a complex procedure. Consequently, the difficulty of merging new systems with current infrastructure continues to be a significant barrier, hindering the broad acceptance of smart enterprise solutions.
Smart Enterprise Market Segment Analysis
By Component
In 2023, the Hardware segment led the Smart Enterprise Market, securing the highest revenue share of roughly 49%. This superiority is fueled by the crucial function hardware serves in facilitating smart systems, including IoT devices, sensors, and servers, which constitute the foundation of business operations. As companies persist in investing in strong, scalable infrastructure to facilitate advanced technologies such as AI and automation, the need for high-performance hardware has escalated, solidifying its status as the market leader.
The Services segment is expected to experience the fastest growth, with a CAGR of 15.02% from 2024 to 2032. This rapid expansion is attributed to the increasing need for specialized services such as system integration, data analytics, and cloud-based solutions, which help enterprises optimize their smart technologies. As organizations seek to maximize the value of their hardware investments, the demand for consulting, maintenance, and management services will accelerate, driving growth in the services sector.
By Technology
In 2023, the ERP segment led the Smart Enterprise Market, accounting for the highest revenue share of about 30%. This dominance is largely due to the critical role ERP systems play in streamlining business processes, enhancing data management, and improving overall operational efficiency. As organizations increasingly seek integrated solutions to manage various functions such as finance, HR, and supply chain ERP systems have become a central tool for enabling smarter, more cohesive enterprise management.
The MES segment is expected to grow at the fastest CAGR of approximately 15.60% from 2024 to 2032. This rapid expansion is driven by the growing need for real-time production monitoring and optimization in industries like manufacturing. As companies prioritize operational efficiency and digital transformation, MES systems are becoming essential for managing complex production processes, enhancing quality control, and enabling seamless integration with other smart technologies. This demand is fueling significant growth in the MES segment.
By Application
In 2023, the Industrial Equipment segment dominated the Smart Enterprise Market, capturing the highest revenue share of about 24%. This leadership can be attributed to the growing reliance on advanced machinery and equipment to drive automation, enhance efficiency, and reduce operational costs in industries such as manufacturing and logistics. As companies increasingly adopt IoT-enabled devices and smart systems, industrial equipment plays a crucial role in enabling seamless operations and improved productivity, solidifying its dominant position in the market.
The Healthcare segment is poised to experience the fastest growth, with a CAGR of 16.53% from 2024 to 2032. This surge is driven by the increasing demand for digital health solutions, including telemedicine, wearable devices, and AI-powered diagnostics, as healthcare systems seek to improve patient care and operational efficiency. The healthcare industry’s emphasis on data-driven decision-making, remote patient monitoring, and personalized treatments is driving rapid adoption of smart technologies, positioning the sector for significant expansion in the coming years.
By Organization Size
In 2023, the Large Enterprise segment dominated the Smart Enterprise Market, securing the highest revenue share of about 66%. This dominance is driven by the substantial resources and advanced infrastructure that large organizations can invest in smart technologies. With their extensive operational needs, large enterprises can implement and scale integrated solutions such as AI, cloud computing, and automation across multiple departments, leading to improved efficiency and competitive advantage.
The Small and Medium-Sized Enterprise segment is expected to grow at the fastest CAGR of approximately 15.22% from 2024 to 2032. This growth is fueled by the increasing affordability and accessibility of smart technologies, which allow SMEs to adopt advanced solutions without significant upfront costs. As digital transformation becomes more critical for maintaining competitiveness, SMEs are leveraging scalable, cost-effective smart systems to enhance their operations, streamline processes, and boost productivity, accelerating their adoption of these technologies in the coming years.
Regional Analysis
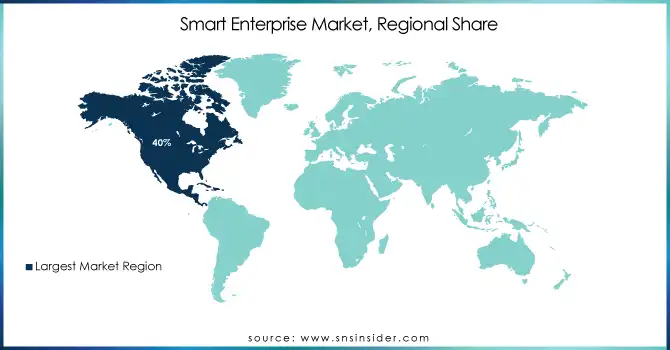
In 2023, North America dominated the Smart Enterprise Market, holding the highest revenue share of about 40%. This leadership is attributed to the region's early adoption of advanced technologies, strong IT infrastructure, and substantial investments in digital transformation across various industries. The presence of major technology companies and a well-established ecosystem for innovation has positioned North America as a hub for smart enterprise solutions, driving the market's growth and leading to its dominant share.
The Asia Pacific region is expected to grow at the fastest CAGR of approximately 15.46% from 2024 to 2032. This rapid growth is driven by the region's accelerating industrialization, expanding digital infrastructure, and increasing government initiatives aimed at fostering technological innovation. As businesses in emerging economies prioritize modernization and digital transformation, the demand for smart enterprise solutions is surging, positioning Asia Pacific as the fastest-growing market in the coming years.
Do You Need any Customization Research on Smart Enterprise Market - Enquire Now
Key Players
-
Microsoft (Azure IoT, Power BI)
-
Cisco Systems (Cisco IoT, Industrial Network Switches)
-
Oracle (Oracle IoT Cloud, Oracle Autonomous Database)
-
SAP (SAP Leonardo, SAP S/4HANA)
-
Honeywell Process Solutions (Experion, Honeywell UOP)
-
Hitachi Vantara (Lumada, Hitachi Visualization Suite)
-
Mitsubishi Electric (MELSEC iQ-R, EcoMonitor)
-
Dell Technologies (IoT Solutions, VxRail)
-
Toshiba (Toshiba Smart City Solutions, Toshiba IoT Solutions)
-
Intel (Intel IoT Platform, Intel Xeon Scalable Processors)
-
ABB Ltd. (ABB Ability, Smart Grids)
-
Siemens (MindSphere, Industrial Automation)
-
General Electric (Predix, Digital Wind Farm)
-
Rockwell Automation Inc. (FactoryTalk, Allen-Bradley)
-
Schneider Electric (EcoStruxure, APC by Schneider Electric)
-
Honeywell International Inc. (Honeywell Forge, Building Management Systems)
-
Emerson Electric Co. (Plantweb, Ovation)
-
Fanuc UK Limited (Robodrill, Robocut)
-
Fujitsu Global (Fujitsu Digital Annealer, SPARC Servers)
-
IBM (IBM Watson IoT, IBM Maximo)
Recent Developments:
-
In 2024, Microsoft enhances Business Chat within Microsoft 365 Copilot by integrating smarter enterprise content management, enabling users to easily retrieve relevant and high-quality content via Microsoft Graph.
-
In October 2024, IBM and Microsoft announced an expanded partnership to accelerate enterprise-wide transformation through hybrid cloud, AI, and consulting services. By combining their technologies and expertise, they aim to improve costs, productivity, and resilience for clients, enhancing application modernization and driving business transformation across industries.
-
In July 2024, Fujitsu and Cohere launched a strategic partnership to develop a Japanese language-focused generative AI model, Takane, aimed at improving enterprise productivity. The AI model will be available through private cloud environments for secure applications in industries like finance and government.
| Report Attributes | Details |
|---|---|
| Market Size in 2023 | USD 0.32 Billion |
| Market Size by 2032 | USD 0.99 Billion |
| CAGR | CAGR of 13.44% From 2024 to 2032 |
| Base Year | 2023 |
| Forecast Period | 2024-2032 |
| Historical Data | 2020-2022 |
| Report Scope & Coverage | Market Size, Segments Analysis, Competitive Landscape, Regional Analysis, DROC & SWOT Analysis, Forecast Outlook |
| Key Segments | • By Component (Hardware, Software, Services) • By Technology (MES, PLC, ERP, SCADA, HMI, Others) • By Organization Size (Small and Medium Size Enterprise, Large Enterprise) • By Application (Automotive, Chemicals & Materials, Healthcare, Food & Beverage, Consumer Goods, Aerospace & Defense, Industrial Equipment) • By Deployment (On-premise, Cloud) |
| Regional Analysis/Coverage | North America (US, Canada, Mexico), Europe (Eastern Europe [Poland, Romania, Hungary, Turkey, Rest of Eastern Europe] Western Europe] Germany, France, UK, Italy, Spain, Netherlands, Switzerland, Austria, Rest of Western Europe]), Asia Pacific (China, India, Japan, South Korea, Vietnam, Singapore, Australia, Rest of Asia Pacific), Middle East & Africa (Middle East [UAE, Egypt, Saudi Arabia, Qatar, Rest of Middle East], Africa [Nigeria, South Africa, Rest of Africa], Latin America (Brazil, Argentina, Colombia, Rest of Latin America) |
| Company Profiles | Microsoft, Cisco Systems, Oracle, SAP, Honeywell Process Solutions, Hitachi Vantara, Mitsubishi Electric, Dell Technologies, Toshiba, Intel, ABB Ltd., Siemens, General Electric, Rockwell Automation Inc., Schneider Electric, Honeywell International Inc., Emerson Electric Co., Fanuc UK Limited, Fujitsu Global, IBM. |
| Key Drivers | • Automation and AI Integration Revolutionizing Business Efficiency and Decision Making • Rise of Remote Work and Collaboration Tools Transforming Smart Enterprise Solutions |
| RESTRAINTS | • High Implementation Costs Hindering Adoption of Smart Enterprise Solutions • Challenges in Integrating New Smart Technologies with Legacy Systems Impeding Market Growth |
Get in Touch
