Interactive Kiosk Market Report Scope & Overview:
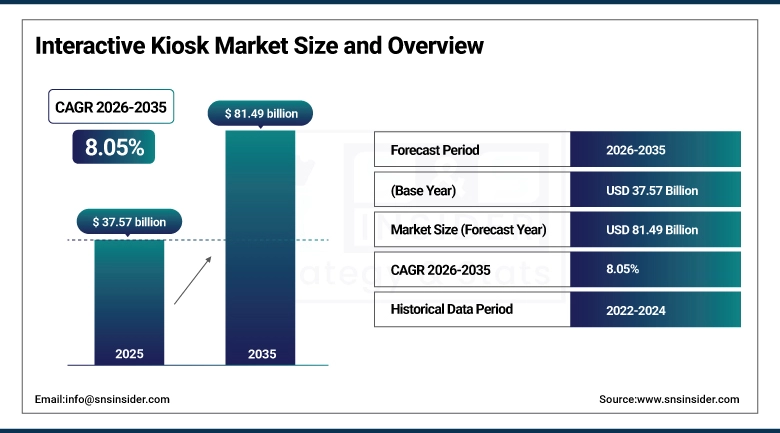
The Interactive Kiosk Market size was valued at USD 37.57 Billion in 2025 and is projected to reach USD 81.49 Billion by 2035, growing at a CAGR of 8.05% during 2026–2035.
The Interactive Kiosk Industry is growing at a fast pace, especially because of the growing need for automated and contactless experiences. More businesses are using interactive kiosks to enhance the efficiency of their operations. Technological advances in touch screens, AI, IoT, and cloud technology are helping businesses deliver smart experiences. The growing emphasis on digital transformation across industries such as retail, healthcare, transportation, and government is also contributing to the growth of the market. Moreover, software and hardware-related changes are opening new market growth opportunities.
Market Size and Growth Forecast:
-
Market Size in 2025: USD 37.57 Billion
-
Market Size by 2035: USD 81.49 Billion
-
CAGR: 8.05% during 2026–2035
-
Base Year: 2025
-
Forecast Period: 2026–2035
-
Historical Data: 2022–2024
To Get more information on Interactive Kiosk Market - Request Free Sample Report
Interactive Kiosk Market Key Trends:
-
Increasing adoption of contactless self-service solutions across industries.
-
AI and IoT integration enable personalized interactions and real-time analytics.
-
Cloud-based kiosk management allows remote monitoring and centralized control.
-
Rapid deployment in healthcare and government improves efficiency and citizen services.
-
Retail kiosks enhance automated checkout, product info, and loyalty programs.
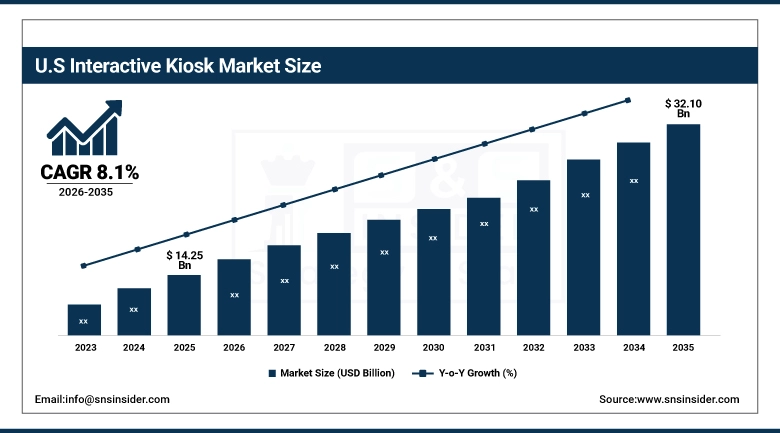
U.S. Interactive Kiosk Market Size Outlook:
The U.S. Interactive Kiosk Market size was valued at USD 14.25 Billion in 2025 and is projected to reach USD 32.10 Billion by 2035, growing at a CAGR of 8.1% during 2026–2035. Growth is driven by increasing demand for self-service and contactless solutions, advanced retail and BFSI infrastructure, rapid digital transformation, AI and IoT-enabled kiosks, and rising consumer preference for efficient, personalized, and automated experiences.
Market Drivers: Rising Demand for Self-Service and Contactless Solutions
The growing demand for self-service and touchless experiences is a major factor in the interactive kiosks market. Organizations in the retail, healthcare, and transportation sectors are increasingly using interactive kiosks to improve business productivity, reduce waiting times, and offer a better customer experience.
In 2025, 50% of retail and BFSI organizations used self-service kiosks, which indicates a strong shift towards self-service experiences.
Market Restraints: High Initial Investment and Maintenance Costs
High upfront costs for hardware, software, and integration present a major restraint for the interactive kiosk market. Small and medium-sized businesses may face challenges in adopting advanced kiosks due to limited budgets. Additionally, maintenance, software updates, and technical support increase operational expenses.
In 2025, nearly 35% of potential kiosk adopters cited cost constraints as a barrier to wider deployment, slowing market penetration in certain regions.
Market Opportunities: Advancements in AI, IoT, and Cloud-Enabled Kiosks
The availability of technologies like AI, IoT, and cloud-based kiosk management is a growth opportunity for the market. Smart kiosks allow for personalized experiences and the ability to analyze information in real-time. The technologies available allow organizations to reach their customers in various places. The focus on digital transformation and smart cities is a growth opportunity for the market.
Interactive Kiosk Market Segments:
-
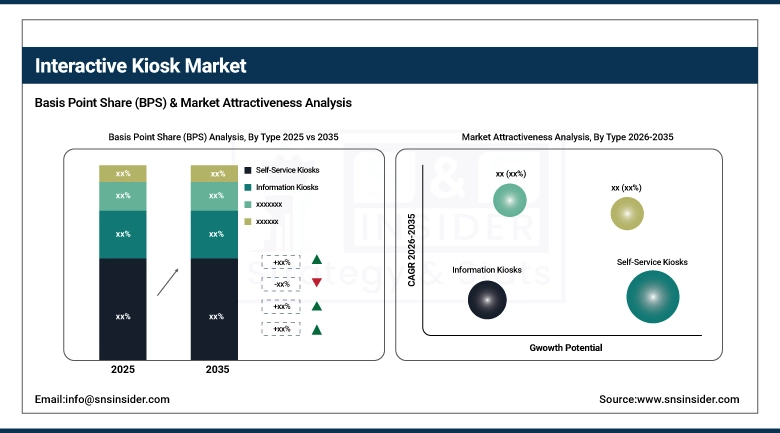
By Type: In 2025, Self-Service Kiosks dominated with 55% share; Ticketing Kiosks fastest growing segment during 2026–2035
-
By Component: In 2025, Hardware dominated with 60% share; Software fastest growing segment during 2026–2035
-
By Application: In 2025, Retail dominated with 50% share; Healthcare fastest growing segment during 2026–2035
-
By End-User: In 2025, BFSI dominated with 45% share; Government & Public Sector fastest growing segment during 2026–2035
By Type: Self-Service Kiosks Dominates, Ticketing Kiosks Fastest-Growing
Self-Service Kiosks segment leads in terms of type due to their adoption in retail, QSRs, and banking. This type of self-service kiosk helps in boosting operational efficiency, thereby reducing waiting times and providing a better experience. This type of self-service kiosk can be used by businesses looking to implement a self-service solution.
Ticketing Kiosks are the fastest-growing type segment, driven by increasing demand in transportation, events, and entertainment industries. These kiosks allow automated ticket issuance, reduce human errors, and support contactless payments. Growth is further boosted by rising public transportation usage, smart city initiatives, and the need for digital transformation in travel and event management.
By Component: Hardware Dominates, Software Fastest-Growing
Hardware dominates the component segment because touchscreen displays, printers, scanners, and kiosks’ robust physical infrastructure form the backbone of all interactive kiosks. Businesses continue to invest in durable and high-performance hardware to ensure seamless customer experiences.
Software is the fastest-growing component segment, fueled by demand for kiosk management platforms, analytics, user-friendly interfaces, and integration with cloud and AI technologies. Advanced software enables personalized interactions, remote monitoring, and data-driven insights, making kiosks smarter and more adaptable across industries.
By Application: Retail Dominates, Healthcare Fastest-Growing
Retail dominates the application segment due to the high deployment of self-service kiosks in supermarkets, malls, and convenience stores. Kiosks help reduce checkout times, provide product information, and enable loyalty program integrations, improving overall customer satisfaction.
Healthcare is the fastest-growing application segment, which includes hospitals, clinics, and pharmacies using kiosks for check-in, scheduling, billing, and information dissemination. The need for touchless experiences and operational efficiency in healthcare transformation post-pandemic will drive adoption.
By End-User: BFSI Dominates, Government & Public Sector Fastest-Growing
BFSI (Banking, Financial Services, and Insurance) is a leading sector because of the high usage of self-service kiosks in banks and financial organizations for cash deposit, withdrawal, account management, and customer services. High adoption is because of efficiency, security, and cost savings.
Government & Public Sector is the fastest-growing segment, supported by deployment in smart city initiatives, transportation hubs, public information centers, and citizen service points. Kiosks enhance citizen engagement, enable contactless service delivery, and help governments reduce manpower dependency while improving service accessibility.
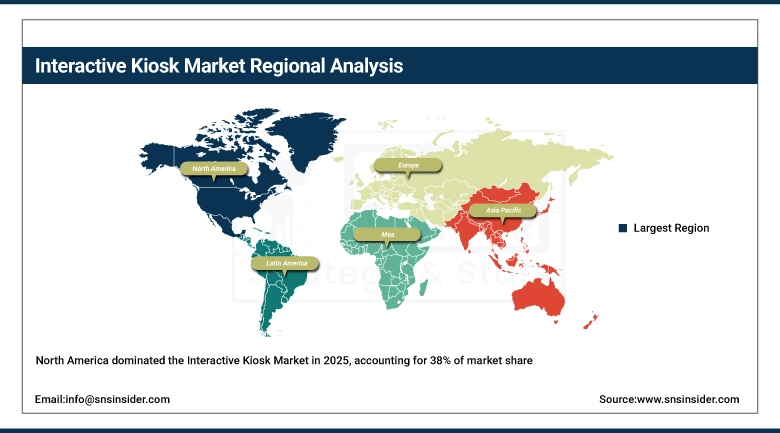
Interactive Kiosk Market Regional Analysis:
North America Interactive Kiosk Market Insights:
North America holds the largest share in the global interactive kiosk industry at 38% in 2025. The major factors for the dominance of the North American market are its early adoption of technology, robust retail and BFSI ecosystem, and high preference for self-service technology among consumers. Robust digital transformation strategies, widespread adoption of AI and IoT technology-enabled kiosks, and strong presence of market leaders such as NCR Corporation and Diebold Nixdorf make North America the market leader in the global interactive kiosk market.
Get Customized Report as per Your Business Requirement - Enquiry Now
Europe Interactive Kiosk Market Insights:
Europe is an important market for the global interactive kiosk market, with strong presence in the transportation, banking, and public sector segments. The market in Europe is growing with the increase in smart city projects, self-service needs, and the growth of retail and hospitality kiosks in countries such as Germany, the UK, and France. The presence of established technology vendors, focus on digitalization, and changing consumer behaviors also continue to strengthen the European market’s presence in the global market.
Asia-Pacific Interactive Kiosk Market Insights:
Asia-Pacific is observed to be the fastest-growing segment in the interactive kiosk industry during 2026-2035. The growth is driven by rapid urbanization, increasing discretionary income, and growth in the retail, healthcare, and service industries in countries such as China, India, and Japan. In addition, digital transformation initiatives, smart kiosks in transportation hubs, and the entry of global technology providers are driving interactive kiosk growth in the Asia-Pacific market.
Latin America Interactive Kiosk Market Insights:
Latin America is an emerging market in the global interactive kiosk sector, supported by growing retail and government adoption of automated solutions. Increasing urbanization, expanding public service kiosks, and rising interest in self-service technologies encourage market growth. Local and international technology providers are gradually introducing innovative kiosk solutions, strengthening the region’s presence in the global interactive kiosk market.
Middle East & Africa (MEA) Interactive Kiosk Market Insights:
The Middle East & Africa interactive kiosk market is gradually gaining traction with the rise of urbanization, smart city initiatives, and the need for contactless solutions. The growth of retail, transportation, and government sector applications, along with the entry of global tech companies, is adding to the growth of the Middle East & Africa interactive kiosk industry. Consumers and businesses alike are increasingly using interactive kiosks for efficiency, convenience, and better service delivery, thus adding to the growth of the Middle East & Africa interactive kiosk market.
Interactive Kiosk Market Competitive Landscape:
NCR Corporation, headquartered in Atlanta, Georgia, USA, is a global leader in interactive kiosk solutions, offering hardware, software, and services for retail, banking, hospitality, and healthcare sectors. The company focuses on self-service technologies, cash management systems, and digital automation solutions, emphasizing operational efficiency, customer experience, and innovative digital platforms.
-
In 2025: NCR expanded its kiosk portfolio with AI-powered self-service and contactless solutions, targeting enhanced customer engagement and streamlined operations across multiple industries.
Diebold Nixdorf, headquartered in North Canton, Ohio, USA, is a leading provider of interactive kiosks and financial self-service solutions for banking, retail, and payment sectors. The company specializes in automated teller machines, self-service kiosks, software platforms, and cash management solutions, focusing on secure, efficient, and user-friendly services.
-
In 2025: Diebold Nixdorf launched next-generation intelligent kiosks integrating IoT and cloud-based management, aimed at improving operational efficiency and personalized customer experiences in retail and BFSI environments.
Interactive Kiosk Companies are:
-
NCR Corporation
-
Diebold Nixdorf
-
Glory Ltd.
-
Fujitsu Limited
-
Zebra Technologies Corporation
-
Pyramid Computer GmbH
-
HexaCorp Solutions
-
Advanced Kiosks Solutions
-
HP Inc. (Kiosk Solutions Division)
-
Omron Corporation
-
Toshiba TEC Corporation
-
Wincor Nixdorf (part of Diebold Nixdorf)
-
Elo Touch Solutions, Inc.
-
Frank Mayer and Associates, Inc.
-
Zivelo, Inc.
-
Posiflex Technology, Inc.
-
IER Interactive
-
Olea Kiosks, Inc.
| Report Attributes | Details |
|---|---|
| Market Size in 2025 | USD 37.57 Billion |
| Market Size by 2035 | USD 81.49 Billion |
| CAGR | CAGR of 8.05% From 2026 to 2035 |
| Base Year | 2025 |
| Forecast Period | 2026-2035 |
| Historical Data | 2022-2024 |
| Report Scope & Coverage | Market Size, Segments Analysis, Competitive Landscape, Regional Analysis, DROC & SWOT Analysis, Forecast Outlook |
| Key Segments | • By Type (Self-Service Kiosks, Information Kiosks, Ticketing Kiosks) • By Component (Hardware, Software, Services) • By Application (Retail, Healthcare, Transportation & Logistics) • By End-User (BFSI, Hospitality, Government & Public Sector) |
| Regional Analysis/Coverage | North America (US, Canada), Europe (Germany, UK, France, Italy, Spain, Russia, Poland, Rest of Europe), Asia Pacific (China, India, Japan, South Korea, Australia, ASEAN Countries, Rest of Asia Pacific), Middle East & Africa (UAE, Saudi Arabia, Qatar, South Africa, Rest of Middle East & Africa), Latin America (Brazil, Argentina, Mexico, Colombia, Rest of Latin America). |
| Company Profiles | NCR Corporation, Diebold Nixdorf, Glory Ltd., Fujitsu Limited, KIOSK Information Systems, Zebra Technologies Corporation, Pyramid Computer GmbH, HexaCorp Solutions, Advanced Kiosks Solutions, Epson America, Inc., HP Inc. (Kiosk Solutions Division), Omron Corporation, Toshiba TEC Corporation, Wincor Nixdorf, Elo Touch Solutions, Inc., Frank Mayer and Associates, Inc., Zivelo, Inc., Posiflex Technology, Inc., IER Interactive, Olea Kiosks, Inc. |
Frequently Asked Questions
Ans: The Interactive Kiosk Market is expected to grow at a CAGR of 8.05% during 2026–2035.
Ans: The market was valued at USD 37.57 Billion in 2025 and is projected to reach USD 81.49 Billion by 2035.
Ans: The key drivers of the Interactive Kiosk Market include rising demand for self-service, contactless solutions, AI and IoT integration, digital transformation, efficiency improvement, and enhanced customer experience across industries.
Ans: The Self-Service Kiosks segment dominated during the projected period.
Ans: North America dominated the Interactive Kiosk Market in 2025.
Get in Touch
