Smart Learning Market Report Scope & Overview
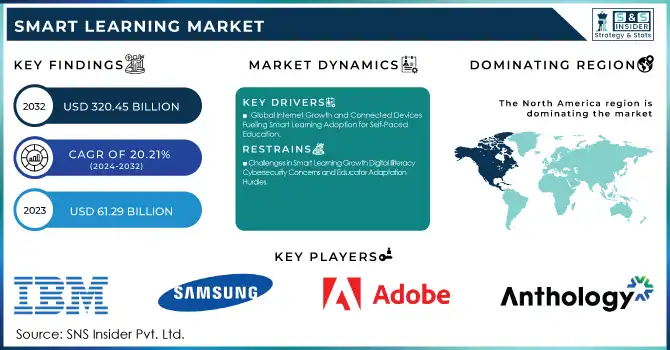
The Smart Learning Market was valued at USD 61.29 billion in 2023 and is expected to reach USD 320.45 billion by 2032, growing at a CAGR of 20.21% over the forecast period 2024-2032.
The smart learning market is witnessing growth despite adopting digital learning technologies and the increasing need for personalized and versatile education options. The increased availability of the latest technologies such as AI, machine learning, and IoT has changed the face of learning, allowing for personalized content delivery, instant feedback, and increased learner engagement. Moreover, the growth of mobile learning and cloud-based platforms has enabled easy access to educational resources thus making it a more inclusive and accessible learning experience for students and professionals both. 27% of young adults aged 18-29 are `Very Well positive' or 'Extremely Positive' about AI in education in 2024, and 82% of college students are using AI technologies (58% of high schools. Mobile learning engagement is at 72%, and by the end of 2022, cloud applications will be responsible for 92% of global mobile data traffic. Elsewhere, 42% of educators say that AI minimizes administrative work, giving room for more personalized learning, while 25% consider it indispensable for personalized student experiences.
Smart Learning Market Size and Forecast
-
Market Size in 2023: USD 61.29 Billion
-
Market Size by 2032: USD 320.45 Billion
-
CAGR: 20.21% from 2024 to 2032
-
Base Year: 2023
-
Forecast Period: 2024–2032
-
Historical Data: 2020–2022
To Know More Information about Smart Learning Market - Request Sample Report
AI-Generated Classroom Worksheet Market Trends:
-
Rapid adoption of AI tools in K–12 education is accelerating worksheet automation, with over 55% of teachers using AI-assisted content creation weekly.
-
Growth of personalized learning is driving demand for adaptive worksheets, improving student performance by 20–25% through level-based content generation.
-
Expansion of edtech platforms is enabling AI worksheet integration, with more than 60% of LMS platforms supporting AI content features.
-
Time-saving benefits are boosting adoption, as AI-generated worksheets reduce teacher preparation time by 40–50%.
-
Increasing digitization of classrooms is supporting demand, with over 70% of schools adopting digital or hybrid learning resources globally.
The growing focus on the need for workforce upskilling/reskilling, driven by rapid technology evolution and changing job market requirements, is another important aspect contributing to market growth. To address this issue, enterprises are making significant investments in smart learning tools so that they can provide learning opportunities to employees while managing to stay ahead of the competition. The market is further propelled by the digital education initiatives led by the government and the growing penetration of smart classrooms in academic institutions. Secondly, the world that was already on its way to embracing e-learning had been catalyzed by the COVID-19 pandemic and the need for scalable, remote learning opportunities. Hence, factors such as not only technological innovation but also changing educational needs and a global decentralized emphasis on lifelong learning are leading the smart learning market to grow. A survey conducted in 2024 revealed that 71% of workers wanted regular skill upgrades, while 80% requested more aggressive investments for upskilling efforts. 68% of hiring managers plan for employee reskilling with 44% skill disruption for workers by 2027. Another sign of scalable e-learning adoption, is the proportion of online course enrollments that were in courses with over 10 students grew by 60% during the pandemic.
MARKET DYNAMICS
KEY DRIVERS:
- Global Internet Growth and Connected Devices Fueling Smart Learning Adoption for Self-Paced Education
The increase in the penetration of high-speed internet and the adoption of connected devices globally further drives the market for Smart Learning. With enhanced broadband connectivity in developing rural areas, access to online education platforms and smart learning tools has increased exponentially. An increase in the use of gadgets such as smartphones, tablets, and laptops enables learners to access educational content anywhere and at any time, thereby fostering self-directed learning. The expansion of high-speed 5G also fuels this increase through its capacity to deliver quality, interactive, real-time learning experiences. The deployment of these tools into the existing education structure has resulted in smart learning becoming more attractive to both the academic and the corporate world. In 2024, there will be 5.5 billion people online 67.5% of the world population. Nowadays, mobile devices control 63.38% of all website traffic and the average American on a day-to-day basis spends 16 hours and 10 minutes per day on all the screened devices. The world has reached a level of global Internet traffic of 33 Exabyte per day and an average Internet user each day consumes 4.2 GB of data, which propelled the emergence of smart learning tools among digital natives who conveniently engage in self-regulated, self-paced, and self-directed learning practices.
- Revolutionizing Education with Gamification AR VR and MR Enhancing Engagement Comprehension and Learning Outcomes
Increasing emphasis on gamification and immersive learning experiences in the education sector is another key growth driver. With emerging technologies such as augmented reality (AR), virtual reality (VR), and mixed reality (MR), It is being used in more and more creative ways to prepare interactive environments. By simulating real-world scenarios in various virtual settings, these immersive solutions provide valuable hands-on experiences, ultimately improving comprehension, retention, and learner motivation. Gamification Intertwining game-like components like rewards, challenges, and leaderboards, Gamification has been noticed and accepted to enhance learner engagement and outcomes across different age groups. STEM (science, technology, engineering, and mathematics) education and professional training programs can especially benefit from such innovations, which help in visualizing complex concepts or learning concepts better through hands-on demonstrations. The increasing use of these new learning techniques shows their ability to change the future of education and work. In 2024, gamified training increases employees motivation to learn by 83% and game-based learning increases engagement by 88%, as compared to traditional forms of learning. Even more so, 60% of teachers say virtual reality improves comprehension of complex STEM topics and 41% of U.S. schools are using AR/MR in their curricula. In addition, 51% of students report higher engagement and retention rates using AR/MR.
RESTRAIN:
- Challenges in Smart Learning Growth Digital Illiteracy Cybersecurity Concerns and Educator Adaptation Hurdles
The digital illiteracy among the users, especially from developing regions, is one of the major restraints for the growth of the Smart Learning Market. Although smart learning tools are becoming cheaper, a large segment of the population does not have the technical know-how to utilize these technologies to their full potential. In particular, perhaps, the shift to digital pedagogies has proved harder than expected for many educators to adapt to, even when smart learning solutions are available in a more 'traditional' education environment. Data privacy and cybersecurity issues are another major challenge. As the use of digital platforms for learning has become more prevalent, there is now a greater amount of personal information being stored about users, including personal data and learning behaviors. This creates fear of data leakage and exploitation, making institutions and individuals reluctant to operate smart learning tools efficiently, the need to ensure strong data protection measures and compliance with regulatory standards continues to be a challenge for market players.
KEY MARKET SEGMENTS
BY COMPONENT
Hardware accounted for the largest share of the Smart Learning Market in 2023, at 58.6%. Interactive whiteboards, tablets, VR headsets, etc. are all integral to providing immersive and engaging learning experiences. These tools have seen heavy investments by educational institutions and enterprises to augment traditional pedagogy and enable remote and hybrid education settings. In addition, hardware adoption has received a strong push from government-led smart classroom projects and subsidized hardware programs aimed at smartening education. The initial focus on providing classrooms and training centers with advanced infrastructure has made hardware a central element of smart learning solutions.
Software is anticipated to have the highest CAGR from 2024 to 2032 due to a market trend towards digital and custom learning solutions. The hardware, from computers to servers, needs software solutions ranging from good LMS or educational apps to innovative adaptive learning systems driven by AI to harness this functionality. They offer personalized learning experiences, and analytics in real-time, and enable collaboration, which increases student engagement and effectiveness in learning. Cloud-based platforms and subscription models are gaining traction, providing software with the opportunity to flourish on a scalable and accessible cost-reduced playground. With the growing prominence of software powering and delivering transformative experiences in education due to rising demand plans by academics and enterprises alike for extensibility, configurability, and agility, we will witness rapid growth in the role of software in transforming education, closely aligning with and augmenting existing hardware infrastructures.
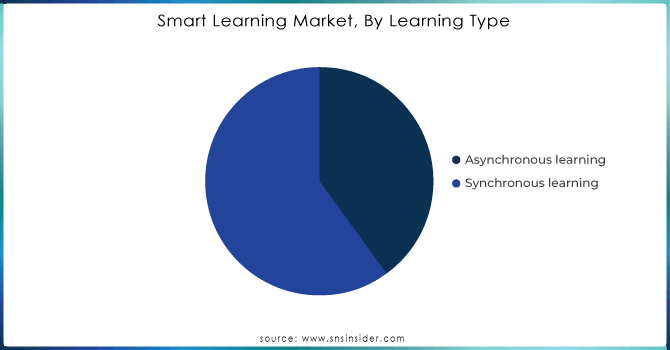
BY LEARNING TYPE
In 2023, synchronous learning took 55.9% of the Smart Learning Market because it digitally helps replicate the traditional classroom dynamics. Synchronous learning enables instant engagement between instructors and learners through live video, virtual classrooms, and discussions. It is a format that has been particularly prevalent in universities, corporate training programs, and state-run educational programs as it facilitates in-person communication, instant feedback, and interactive group exercises. Its adoption was further boosted by the COVID-19 pandemic as educational institutions and organizations transitioned to live virtual platforms to keep education on track during the pandemic-induced lockdowns. If high levels of instructor involvement and real-time collaboration are required, the synchronous approach continues to be a popular option.
The asynchronous segment is expected to witness the fastest growth of the CAGR from 2024 to 2032, which represents a move towards more flexible and self-directed learning. Asynchronous learning, on the other hand, allows learners to access digital course materials, pre-recorded lectures, and interactive content according to their preferences, unlike synchronous methods. This makes it especially helpful for adult learners, working professionals, and people who reside in remote areas with limited internet accessibility, as it also means that time zones or scheduling issues are not as problematic. Asynchronous learning is also being transformed as AI and machine learning improve, allowing content to be delivered by platforms based on the learning style and progress of an individual. Gamification, discussion forums, and interactive assessments not only make asynchronous learning more fun but also more impactful. With bigger focus areas around lifelong learning, upskilling, and reskilling across the world, asynchronous approaches are steadily gaining popularity given their flexibility, scalability, and learner-centricity, which is leading to rapid growth in terms of market expansion.
BY SERVICE
The Smart Learning Market was led by implementation services, acquiring a 41.4% market share in 2023, as they are an integral part of deploying smart learning solutions. Implementation services include setup, integration, and customization of hardware and software solutions in educational institutes, enterprises, and government programs. With more organizations investing in digital education technologies, the necessity to integrate into pre-existing infrastructures has demanded implementation services. These services help ensure that smart learning platforms are customized to the needs of their users, facilitating a seamless transition to digital learning environments. The increasingly beefy thrust on massive digitization initiatives like smart study rooms and company schooling systems additionally cemented implementation as the pinnacle provider category.
Consulting services will continue to grow at the highest CAGR during the forecast period (2024-2032), due to the increasing need for expert advice in implementing and optimizing smart learning systems. In this tumultuous digital transformation landscape, institutions and enterprises now rely on advisory from experts on the best-fit technologies, custom learning programs, and pain points such as scalability, learner engagement, and data security. Smart learning consulting services also have immense significance when it comes to assessing ROI and ensuring alignment of smart learning initiatives with business objectives. The growth is driven by the widespread adoption of new technologies such as AI, VR, and gamification that need subject-matter experts for successful implementation. This will result in a boom in consulting practice as market maturity will lead to requested advice for leveraging Smart Learning investments to achieve maximum impact and capability on the ground in designing and delivering programs that will be truly transformational.
BY END USE
In 2023, academic institutions captured the largest Smart Learning Market share of 51.3% as most of the Schools, Colleges & Universities implement digital learning technology. Educational institutions have always been on the go with smart learning solutions integrated into the system like interactive whiteboards, e-learning, and smart classrooms to transform the teaching methodology and student outcomes. Driven by government support for education digital transformation and demand for remote learning, Academic institutions make them the largest segment in the market. Academic institutions, which accounted for a heavyweight share of the market, were backed by the integration of Learning Management Systems (LMS), virtual classrooms, and personal learning tools.
Enterprises are estimated to grow at the fastest CAGR between 2024 to 2032 as employees in enterprises need constant upskilling and employee development. Businesses are looking for smart learning solutions to have a skilled workforce that is future-ready and can embrace changing industry trends and technologies. AI-powered learning, gamification, and virtual learning environments are catering to the need of the hour where employees can learn at their pace when needed with the help of corporate training programs. It's especially significant for sectors like tech, health, and finance that innovate at a stratospheric pace and necessitate lifelong learning. The enterprise segment is projected to create the fastest-growing sector in the smart learning market in the upcoming decade due to the rapid onset of the demand for scalable, flexible, and cost-effective corporate learning solutions.
REGIONAL ANALYSIS
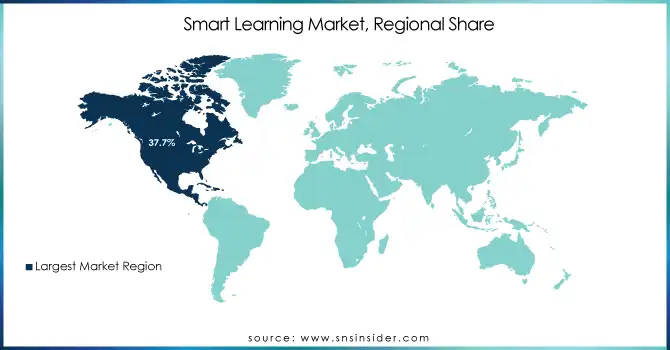
North America accounted for 37.7% market share in the Smart Learning Market in 2023, attributed to developed technological infrastructure, high acceptance of digital literacy tools, and huge investments from public and private sectors. From AI-driven LMS (learning management system) dollops to smart classrooms, and venues, US and Canadian educational institutions were quick to ride the wave of Smart Learning technologies. Since the pandemic millions of education companies from giant solutions like Google and Microsoft to small edtech startups have been rolling out remote learning platforms and tools for K–12 schools, universities, and corporate training. Such as, for instance, in North American schools, Google Classroom and Microsoft Teams have gained use to encourage online learning and hybrid learning, motivating students and teachers to communicate.
Asia Pacific is projected to register the highest growth rate (CAGR) during the forecast period averaging from 2024 to 2032, owing to the rapidly expanding technological landscape, rising government investments, and growing trend of digital education platforms across China, India, Japan among others. Specifically, China has dedicated enormous resources to smart education, for instance, via the Smart Education Project, which seeks to apply AI, big data, and cloud computing to its education sector. Similarly, with BYJU’s bringing in a revolution in the learning method of students with new learnings within interactive lessons and content personalized to suit student needs, every state in the country of India is also experiencing unprecedented growth. The technologically advanced nation of Japan is initiating immersive learning experiences in classrooms via Virtual Reality (VR) and Augmented Reality (AR) experience, which would further grip this region for the rapid adoption of smart learning technologies. These will not only propel further digitization of education in the region but also place Asia Pacific as the highest-growing region within the smart learning space.
Need any customization research on Smart Learning Market - Enquiry Now
Smart Learning Market are:
-
IBM (Watson Education, IBM Cloud Pak for Education)
-
Samsung (Samsung School, Samsung Smart School)
-
Adobe (Adobe Captivate, Adobe Connect)
-
Anthology (Blackboard Learn, Blackboard Collaborate)
-
SMART Technologies (SMART Board, SMART Learning Suite)
-
Oracle (Oracle Learning Cloud, Oracle Content and Experience Cloud)
-
SAP (SAP Litmos, SAP SuccessFactors Learning)
-
Microsoft (Microsoft Teams for Education, Microsoft 365 Education)
-
Cornerstone OnDemand (Cornerstone Learning, Cornerstone Content Anytime)
-
Pearson (Pearson MyLab, Pearson eText)
-
BenQ (BenQ Interactive Flat Panel, BenQ Classroom Projector)
-
Google (Google Classroom, Google Meet)
-
McGraw Hill (McGraw Hill Connect, McGraw Hill ALEKS)
-
Cisco (Cisco Webex, Cisco Meraki)
-
Huawei (Huawei IdeaHub, Huawei Cloud Classroom)
-
D2L (Brightspace, D2L Wave)
-
Ellucian (Ellucian Learning Management System, Ellucian Cloud)
-
Alphabet Inc. (Google Classroom, Google Meet)
-
Upside LMS (UpsideLMS, UpsideLMS Mobile App)
-
Edsys (Edsys Learning Management System, Edsys School Management System)
Some of the Raw Material Suppliers for Smart Learning Companies:
-
Intel Corporation
-
Samsung Electronics
-
Texas Instruments
-
Qualcomm
-
Micron Technology
-
LG Display
-
NVIDIA Corporation
-
Broadcom
-
Acer Inc.
-
Foxconn Technology Group
RECENT TRENDS
-
In January 2024, Samsung partnered with Physics Wallah to launch the Samsung Education Hub app for its TVs and monitors, offering live classes and on-demand content for students.
-
In October 2024, Adobe launched a global initiative aimed at helping 30 million learners develop AI literacy, digital marketing, and content creation skills by 2030. The program includes certifications, partnerships, and free resources to empower next-generation professionals.
-
In July 2024, Anthology launched a new Blackboard LMS release focusing on AI literacy, instructor efficiency, and student success, featuring AI-powered tools like Conversations and Content Designer.
| Report Attributes | Details |
|---|---|
| Market Size in 2023 | USD 61.29 Billion |
| Market Size by 2032 | USD 320.45 Billion |
| CAGR | CAGR of 20.21% From 2024 to 2032 |
| Base Year | 2023 |
| Forecast Period | 2024-2032 |
| Historical Data | 2020-2022 |
| Report Scope & Coverage | Market Size, Segments Analysis, Competitive Landscape, Regional Analysis, DROC & SWOT Analysis, Forecast Outlook |
| Key Segments | • By Component (Hardware, Software) • By Learning Type (Synchronous learning, Asynchronous learning) • By Service (Consulting, Implementation, Support, Maintenance) • By End Use (Academic, Enterprises, Government) |
| Regional Analysis/Coverage | North America (US, Canada, Mexico), Europe (Eastern Europe [Poland, Romania, Hungary, Turkey, Rest of Eastern Europe] Western Europe] Germany, France, UK, Italy, Spain, Netherlands, Switzerland, Austria, Rest of Western Europe]), Asia Pacific (China, India, Japan, South Korea, Vietnam, Singapore, Australia, Rest of Asia Pacific), Middle East & Africa (Middle East [UAE, Egypt, Saudi Arabia, Qatar, Rest of Middle East], Africa [Nigeria, South Africa, Rest of Africa], Latin America (Brazil, Argentina, Colombia, Rest of Latin America) |
| Company Profiles | IBM, Samsung, Adobe, Anthology, SMART Technologies, Oracle, SAP, Microsoft, Cornerstone OnDemand, Pearson, BenQ, Google, McGraw Hill, Cisco, Huawei, D2L, Ellucian, Alphabet Inc., Upside LMS, Edsys |
| Key Drivers | • Global Internet Growth and Connected Devices Fueling Smart Learning Adoption for Self-Paced Education • Revolutionizing Education with Gamification AR VR and MR Enhancing Engagement Comprehension and Learning Outcomes |
| RESTRAINTS | • Challenges in Smart Learning Growth Digital Illiteracy Cybersecurity Concerns and Educator Adaptation Hurdles |
Frequently Asked Questions
The Smart Learning Market is expected to grow at a CAGR of 20.21% during 2024-2032.
Smart Learning Market size was USD 61.29 billion in 2023 and is expected to Reach USD 320.45 billion by 2032.
The major growth factor of the Smart Learning Market is the increasing adoption of digital technologies and AI-driven solutions to enhance personalized and interactive learning experiences.
The Synchronous learning segment dominated the Smart Learning Market in 2023.
North America dominated the Smart Learning Market in 2023.
Get in Touch
