Glass Interposers Market Size Analysis:
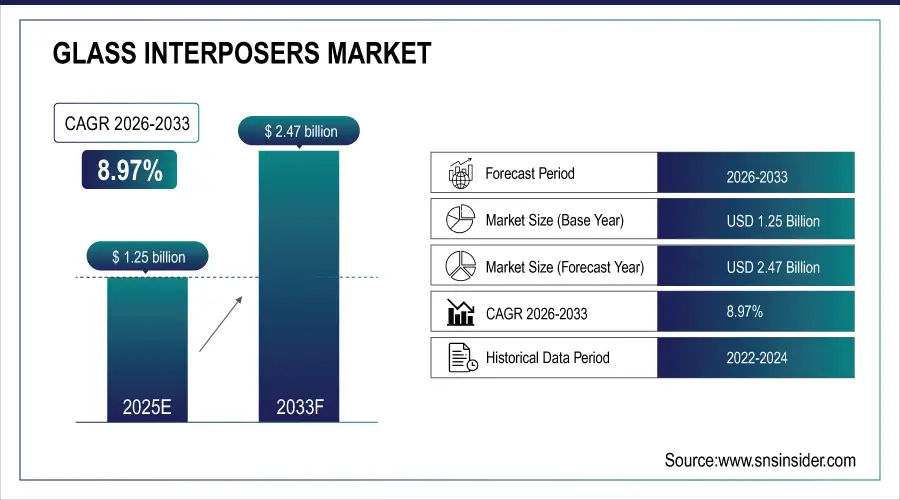
The Glass Interposers Market size was valued at USD 1.36 Billion in 2025 and is projected to reach USD 2.70 Billion by 2033, growing at a CAGR of 8.97% during 2026-2033.
The glass interposers market is gaining momentum driven by increasing demand for high-performance, high-density semiconductor packaging solutions in AI, data centers, and advanced computing. Glass interposers offer significant advantages over traditional organic and silicon substrates, including superior thermal stability, smoother surfaces for finer circuit patterns, and reduced warpage under heat. These characteristics make them ideal for next-generation chip architectures requiring enhanced power delivery, signal integrity, and compact form factors. As the semiconductor industry shifts toward heterogeneous integration and chiplet-based designs, glass interposers are becoming essential to meet the performance and miniaturization needs of future devices. This trend is accelerating their adoption across leading chipmakers and cloud infrastructure providers, positioning the market for robust growth over the coming years.
AMD and AWS Fast-Track Glass Substrate Integration AMD and AWS are expediting next-gen glass substrate adoption to challenge NVIDIA, as SKC plans a 10x production ramp-up for high-performance chip demand.
To Get more information on Glass Interposers Market - Request Free Sample Report
Market Size and Forecast: 2025E
-
Market Size in 2025 USD 1.36 Billion
-
Market Size by 2033 USD 2.70 Billion
-
CAGR of 8.97% From 2026 to 2033
-
Base Year 2025
-
Forecast Period 2026-2033
-
Historical Data 2021-2024
Glass Interposers Market Trends:
-
Increasing adoption of glass interposers over silicon for AI and high-performance computing chip packaging due to superior electrical insulation and signal integrity.
-
Rising demand for higher I/O density, tighter component spacing, and larger form factors in next-generation semiconductor architectures.
-
Glass interposers enabling enhanced thermal stability, power efficiency, and faster data transfer in advanced computing systems.
-
Growing interest in glass substrates as alternatives to traditional organic materials to support denser, energy-efficient, and high-performance chips.
-
Semiconductor companies like Samsung and Corning investing in glass interposer development, sample distribution, and preparation for mass production to meet AI and HPC demands.
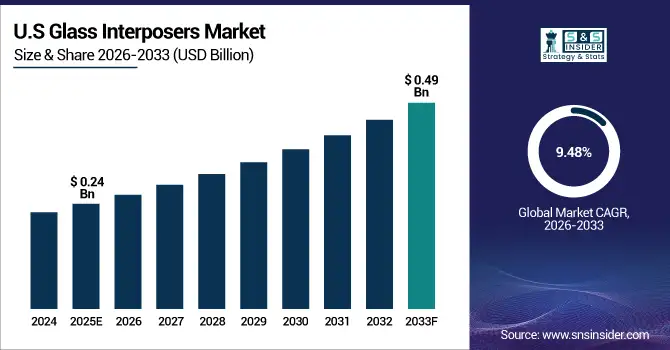
The U.S Glass Interposers Market size was valued at USD 0.24 Billion in 2025 and is projected to reach USD 0.49 Billion by 2033, growing at a CAGR of 9.48% during 2026-2033. this glass interposers market growth is fueled by rising demand for advanced semiconductor packaging, chiplet integration, and AI computing applications. Increased R&D investments and strategic collaborations among tech leaders are further accelerating market momentum. The glass interposers market trends include rising demand for high-density packaging in AI, 5G, and HPC applications, as well as a shift toward chiplet-based architectures requiring ultra-thin, high-precision interposers. Glass interposers offer superior thermal stability, low signal loss, and high dimensional accuracy compared to silicon, making them ideal for next-gen semiconductors.
Glass Interposers Market Growth Drivers:
-
Rising AI and HPC Demands Propel Shift from Silicon to Glass Interposers
The increasing complexity of AI models and high-performance computing (HPC) workloads is driving the demand for more efficient, scalable, and high-speed chip packaging solutions. Glass interposers are emerging as a promising alternative to silicon, offering superior electrical insulation, higher I/O density, better thermal stability, and enhanced signal integrity. These advantages enable more powerful chiplet integration and faster data transfer between components, critical for advanced computing systems. Additionally, glass interposers support larger form factors and tighter component spacing, which are essential for next-generation semiconductor architectures. As industry requirements evolve, glass interposers are becoming a key enabler for meeting performance, power, and packaging challenges in the rapidly advancing AI and data center infrastructure landscape.
Samsung plans to adopt glass interposers for advanced chips by 2028 to enhance performance and power efficiency by over 40%, joining rivals like Intel and AMD in next-gen packaging innovation. Despite benefits, challenges like glass brittleness and precision manufacturing continue to delay full-scale commercialization.
Glass Interposers Market Restraints:
-
Fragility and Production Limitations Restrain Glass Interposers Market Expansion
The glass interposers market include the intrinsic fragility of glass, which makes it prone to cracking during fabrication and handling. This brittleness poses significant risks in high-volume manufacturing environments. Additionally, the lack of standardized, cost-effective mass production techniques limits scalability and raises overall production costs. Compatibility issues with existing semiconductor packaging lines further hinder seamless integration, requiring extensive redesign and capital investment. The thermal mismatch between glass and semiconductor materials can also compromise long-term reliability under fluctuating operating conditions. These material and manufacturing-related constraints, combined with the need for high-precision processing, delay adoption and commercialization, despite the performance benefits glass interposers potentially offer over traditional silicon-based solutions.
Glass Interposers Market Opportunities:
-
Rising Chip Complexity Spurs Market Opportunity for Glass Substrates
As semiconductor packaging becomes increasingly advanced to meet AI and high-performance computing demands, traditional organic substrates face limitations in thermal stability and dimensional precision. This creates a strong market opportunity for glass substrates, which offer superior mechanical properties, form factor flexibility, and energy efficiency. Corning’s focus on developing glass cores for chipsets designed to remain embedded within packaged chips marks a pivotal shift. By supplying samples and preparing for mass production, Corning aims to tap into growing industry demand for substrates that support denser, faster, and more power-efficient chips. As chipmakers seek new materials to optimize performance, glass substrates emerge as a promising solution, opening up new revenue streams in semiconductor packaging innovation.
Corning is strengthening its position in the semiconductor glass substrate market with new glass cores and carrier products aimed at chip packaging.The company is providing samples to potential customers and preparing for mass production as demand grows for high-performance, energy-efficient packaging solutions.
Glass Interposers Market Segment Analysis:
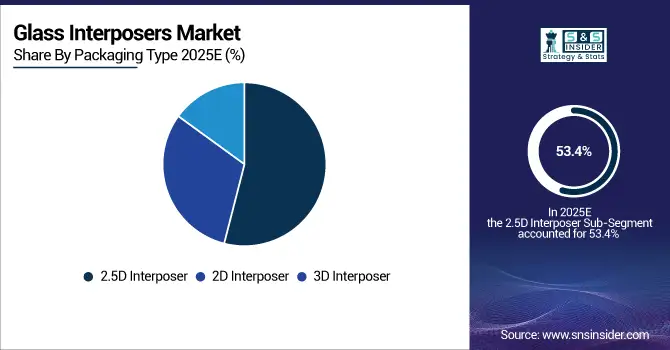
By Packaging Type
Glass Interposers Market maintained a 53.4% share in 2025 in 2.5D interposers, due to perfect blend of cost vs performance associated with it and the growing adoption of 2.5D interposers in high-performance computing, networking and data center applications. This kind of packaging provides a cost-effective option in place of 3D integration, enabling side-by-side placement of multiple dies on a single interposer which results in lower design complexities and improved system performance and bandwidth. Due to rising demand for compact and high-density packaging at AI, AR/VR and advanced mobile devices, the segment of 3D interposer is projected to grow with the highest CAGR between 2026 and 2033. With its vertically layered design, it provides optimal signal fidelity, lower latency, and good heat dissipation, perfect for next generation chips.
By Application
Logic Devices held the largest Glass Interposers Market Share of 29.7% in 2025 due to the key applications of glass interposers in high-performance computing, AI processors, and data center technologies. Evolving requirements for high signaling throughput, higher I/O per mm2, and chip scale architecture miniaturization have made glass interposers an attractive device for logic integration in the front end of silicon in advanced semiconductor packaging and heterogeneous integration. The Optoelectronics segment is anticipated to grow at the fastest CAGR during the forecast period (2026–2033) owing to increasing use of optoelectronic devices in optical communication systems, image sensors, and AR/VR technologies. Glass interposers have gained recognition due to their strong thermal stability, transparency, and low electrical loss, all of which makes them a natural choice for integrating photonic components and fast, high-bandwidth data transmission in novel optoelectronic devices.
By Substrate Material
Quartz Glass led the Glass Interposers Market with a 49.1% share in 2025 due to its superior electrical insulation and thermal stability and commercial availability. Due to its good dimensional accuracy and high compatibility with semiconductor processes, it is the optimal substrate for the high precision electronic packaging, particularly in logic and RF device applications. Its affordability and durability are the largest contributors to quartz glass's ever-present hold on the market. The fastest growing segment (CAGR from 2026 to 2033) is Fused Silica due to surging demand in optoelectronics and high-frequency applications. Due to its ultra-low thermal expansion, high purity and exceptional optical transparency, it can be used as an ideal solution for advanced interposers for use in photonic devices, AR/VR systems and high-speed data communication modules.
By End-Use Industry
Consumer Electronics accounted for 36.6% of the Glass Interposers Market in 2025, on account of increasing demand for miniaturized, high-performance electronics devices such as smartphones, tablets and wearables. Due to their excellent electrical characteristics, high interconnect density and high miniaturization capability, glass interposers are good candidates for advanced packaging of novel electronic devices. The extensive adoption of these industries is also supported by their ability to facilitate efficient heat dissipation and signal integrity. Between 2026 and 2033, the Automotive segment is forecast to achieve the highest CAGR, owing to the increasing adoption of electrical and electronic components in electric vehicles (EVs), advanced driver-assistance systems (ADAS), and entertainment systems. Enabling further reliability, thermal performance, and signal transmission that meet the exacting requirements demanding harsh automotive environments, glass interposers provide ultrahigh density interconnect critically needed for next-generation vehicle electronics.
Glass Interposers Market Regional Analysis:
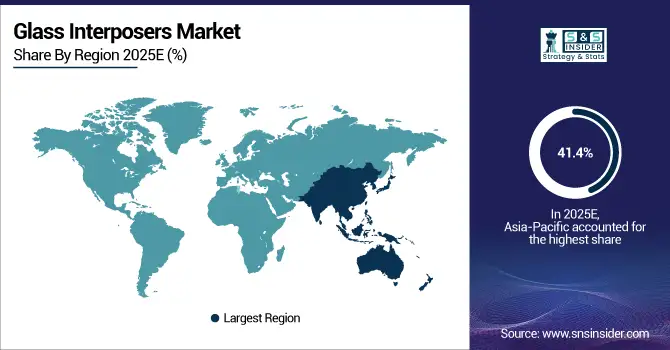
Asia Pacific Glass Interposers Market Insights
Asia Pacific led the Glass Interposers Market in 2025, as it accounted for 41.4% of the market share due to the presence of some leading semiconductor manufacturing ecosystems, increasing consumer electronics demand, the increasing adoption of 5G and AI Technologies, and growing semiconductor output and sales Some countries in this region invest heavily in R&D, government support to development the economy through semiconductor infrastructure and finally big TMP players such as China, Japan, South Korea, Taiwan, etc are present & pushing this region a bit more over other regions. High-performance computing and mobile devices with glass interposers have been largely adopted in these leading nations due to their advanced packaging technology.
Taiwan has supremacy in the Asia Pacific marketplace, ignorant of the fact that it has a mysteriously powerful world of semiconductors, with advanced foundries, packaging manufacture, and unprecedented chip innovation and integration.
Get Customized Report as per Your Business Requirement - Enquiry Now
North America Glass Interposers Market Insights
North America is anticipated to show the relatively high growth rate of 26.8% for the Glass Interposers Market from 2026 to 2033, due to the fast-growing demand for high-performance computing, artificial intelligence, and advanced data center infrastructure in various industries. This growth trend in the region is driven by an increasing miniaturised semiconductor packaging, promising investments in R&D and a strong presence of critical technology companies. Growing application scope with higher adoption in defense electronics, 5G, and photonics. Also, government programs promoting semiconductor manufacturing and supply chain resiliency are further speeding up the development of advanced interposer technology.
The U.S. leads the North American market share owing to its well-established semiconductor ecosystem, research firms, and tech industry leaders.
Europe Glass Interposers Market Insights
Europe also plays a vital role with the Glass Interposers Market, which is expected to grow immensely in 2025 due to the electronics boom in automotive, and industrial automation and telecommunication sectors. Robust R&D environment, government push for semiconductor innovation and presence of major players in Germany, France, and the Netherlands are other advantages for the region. Increasing adoption of ADAS, EV components and 5G infrastructure is propelling the demand for high-performance interposer solutions. Also, European efforts on sustainability, along with localized semiconductor production, are further buoying the market for a variety of high-tech use cases.
Latin America (LATAM) and Middle East & Africa (MEA) Glass Interposers Market Insights
Latin America and Middle East & Africa are emerging markets in Glass Interposers sector, where the growth will be gradual owing to increasing penetration of electronics into industrial, automotive, and telecom applications. Though market penetration is still low when compared to developed regions, there are emerging opportunities due to increasing investments in digital infrastructure, smart cities and localized manufacturing. Driven by government technology initiatives and global collaboration in electronics, countries like Brazil, the UAE, and Saudi Arabia are experiencing increased demand for advanced semiconductor components.
Glass Interposers Market Key Players:
The Glass Interposers Market are
- Corning
- AGC
- HOYA
- SCHOTT
- Plan Optik
- Samtec
- Taiwan Glass
- NSG
- Shinkong Materials
- Toray
- AGI
- 3D Glass Solutions
- TechnoQuartz
- LGS
- HOPE Microelectronics
- Mitsubishi Electric
- Showa Denko Materials
- NEG
- Okamoto Glass
- AVIC Sanxin
Competitive Landscape for Glass Interposers Market:
Corning Incorporated is a U.S. materials science leader with over 170 years of expertise in specialty glass and ceramics, providing precision semiconductor glass substrates and carriers such as through‑glass via and interposer materials that enhance electrical performance, thermal stability, and packaging efficiency for next‑generation AI and high‑performance computing chips
-
In September 2024, Corning unveiled its EXTREME ULE® Glass, a next-generation ultra‑low expansion material designed to support advanced microchip production, including EUV lithography and high-performance semiconductor manufacturing.
Mitsubishi Electric Corporation is a Japanese multinational electronics and electrical equipment manufacturer with a semiconductor and device division that develops core components including high‑frequency and optical devices that support advanced computing and packaging technologies, contributing to innovations in high‑speed data and next‑generation semiconductor solutions.
-
In September 2024, POET Technologies and Mitsubishi Electric announced a collaboration to jointly develop 1.6T and 3.2T optical engine chipsets using POET’s optical interposer platform, integrating Mitsubishi’s 400 G electro‑absorption modulator lasers (EMLs) to advance AI and hyperscale data‑center networking.
| Report Attributes | Details |
|---|---|
| Market Size in 2025 | USD 1.36 Billion |
| Market Size by 2033 | USD 2.70 Billion |
| CAGR | CAGR of 8.97% From 2026 to 2033 |
| Base Year | 2025 |
| Forecast Period | 2026-2033 |
| Historical Data | 2021-2024 |
| Report Scope & Coverage | Market Size, Segments Analysis, Competitive Landscape, Regional Analysis, DROC & SWOT Analysis, Forecast Outlook |
| Key Segments | • By Component Type (Conductive Inks, Displays, Sensors, and Others (capacitors, resistors)) • By Material Type (Polycarbonate Films, Polyester Films, and Others (thermoplastics)) • By Application (Lighting, Wearable Devices, Automotive Control Panels, and Home Appliances) • By End-Use Industry (Automotive, Consumer Electronics, Healthcare, and Industrial) |
| Regional Analysis/Coverage | North America (US, Canada), Europe (Germany, UK, France, Italy, Spain, Russia, Poland, Rest of Europe), Asia Pacific (China, India, Japan, South Korea, Australia, ASEAN Countries, Rest of Asia Pacific), Middle East & Africa (UAE, Saudi Arabia, Qatar, South Africa, Rest of Middle East & Africa), Latin America (Brazil, Argentina, Mexico, Colombia, Rest of Latin America). |
| Company Profiles | Corning, AGC, HOYA, SCHOTT, Plan Optik, Samtec, Taiwan Glass, NSG, Shinkong Materials, Toray, AGI, 3D Glass Solutions, TechnoQuartz, LGS, HOPE Microelectronics, Mitsubishi Electric, Showa Denko Materials, NEG, Okamoto Glass, and AVIC Sanxin. |
Frequently Asked Questions
Asia Pacific dominated the Glass Interposers Market in 2025.
Quartz Glass segment dominated the Glass Interposers Market.
The major growth factor driving the Glass Interposers Market is the rising demand for high-density, high-speed semiconductor packaging in advanced electronics and 5G applications.
The Glass Interposers Market size was USD 1.36 Billion in 2025 and is expected to reach USD 2.70 Billion by 2033.
The Glass Interposers Market is expected to grow at a CAGR of 8.97% from 2026-2033.
Get in Touch
