Smart Trash Bin Market Size & Growth:
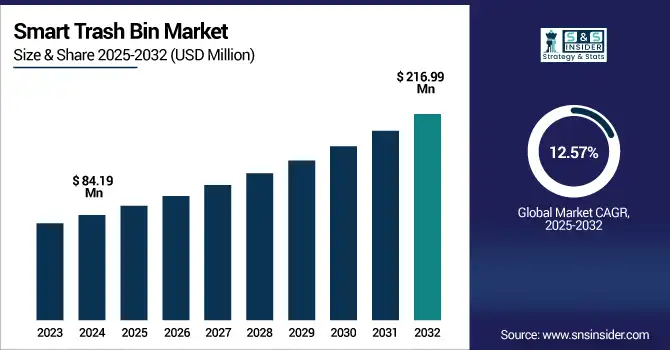
The Smart Trash Bin Market size was valued at USD 84.19 Million in 2024 and is projected to reach USD 216.99 Million by 2032, growing at a CAGR of 12.57% during 2025-2032. The Market is experiencing a continuous growth owing to the increasing trend of rapid urbanization, demand for cleaner public place and a smart city initiative. These technologically advanced bins have advanced features, such as motion sensors, real-time monitoring touchless operation, and even AI integration that helps make waste disposal more hygienic, optimize the process of waste collection, and minimization of human interface. The increasing awareness of sustainability and the need to segregate waste accurately for residential and commercial purposes is also propelling the smart trash bin market growth.
To Get more information Smart Trash Bin Market - Request Free Sample Report
Smart bins are being adopted swiftly by municipalities, airports, shopping complexes, offices, and residential societies to simplify the waste disposal processes and employ data-driven urban planning. Growing IoT and cloud-based platforms, which facilitate external tracking and maintenance, are also benefitting the market. With the rise of stringent environmental regulations and the expansion of digital infrastructure, smart trash bins, an integral part of smart waste management systems, are facilitating operational efficiency and the sustainable development of modern urban communities.
Dec 11, 2024: A smart, AI-powered trashcan at Hong Kong Disneyland has gone viral for its child-like voice and playful garbage-hunting behavior. Roaming the park saying, “I want to eat garbage,” it highlights the engaging potential of smart waste technology.
The U.S. Smart Trash Bin Market size was valued at USD 25.27 Million in 2024 and is projected to reach USD 53.62 Million by 2032, growing at a CAGR of 9.85% during 2025-2032. Increased number of automated waste management usage, smart city expansion, and hygiene focus technologies all are the main growth drivers of smart trash bin market. Some of the Smart Trash Bin market trends are integration of AI with trash bin, and IoT enabled waste tracking, touchless operation, increase in demand for sustainable, tech-driven public infrastructure solutions.
Smart Trash Bin Market Dynamics:
Drivers:
-
Integration of IoT and Solar Technology Drives Efficiency in Smart Waste Management
The integration of IoT sensors and solar-powered compaction technology is emerging as a major driver for the smart trash bin market. They are fundamentally smart bins that monitor fill levels and alerts when a pickup is due, optimizing the waste control, saving time & labor and reducing operational costs drastically. The solar-powered functionality allows for energy-efficient operation without the need for external power sources, which makes them useful for outdoor and high traffic areas. The combination of both promotes sustainability and caters to the demand for an automated, data-driven smart city waste management solution. With the ever-growing need to provide better trash management amid urban surroundings, as consumers seek more connected, low-maintenance, and intelligent types of bin system.
Dec 25, 2024: Japan's Narita Airport has equipped SmaGO bins, which use solar-powered, IoT-enabled compaction of trash and letting staff know when the bin is full. Equipped with online technology for monitoring waste level, these smart bins are expected to mitigate the manual workload as well as enhance efficiency while collecting waste.
Restraints:
-
High Costs and Infrastructure Limitations Restrain Smart Trash Bin Adoption
Healthy adoption of smart trash bins in some markets is witnessed but various restraints are restraining the demand for smart trash bins. High implementation costs, which includes advanced sensors, IoT devices, and solar systems to be setup are major hurdles and hence, implementation is very challenging for smaller municipalities or establishments with little budget. Requirement of aiding digital infrastructure, such as stable connectivity and inclusion with the waste management platforms, restricts the implementation in rural or third world countries.
The long-term sustainability and continuity of operations are also problematic due to maintenance issues, software updates and possible tech breakdowns. Issues related to data privacy regarding user tracking and system security also complicate the implementation. The combination of these issues mean that, at times, certain sectors find that they are unable to make the case for investment, preventing the widespread deployment of smart waste solutions when there is actually a long-term benefit not just to the waste system, but also to the environment.
Opportunities:
-
Demand for Data-Driven Smart Bin Solutions Due to Increasing Urban Waste Complexity
With the increasing urbanization and changing trends of waste disposal globally, the market for smart trash bin with better sensors and analytics sets an excellent opportunity. These solutions are able to monitor waste types and volumes and user behavior and disposal frequency, supplying actionable data to municipalities and service providers. Localized data allows more tailored waste collection strategies, including route planning, resource allocation, and recycling. The coupling of smart bin technology with interactive digital platforms and the identification of individual users can even facilitate targeted environmental interventions and public awareness campaigns. As the demand for data driven, adaptive waste management tools continues to rise, new associated revenue streams are opening for tech providers, while the underlying ambitions of sustainable city planning and emissions reduction are being achieved.
July 18, 2024: Abu Dhabi's Tadweer Group is trialing smart bins equipped with sensors to detect waste type, volume, and user identity for optimized collection.
The system tracks disposal patterns across communities, aiming to enhance waste management efficiency and reduce environmental impact.
Challenges:
-
Technical and Behavioral Barriers Challenge Smart Trash Bin Market Expansion
The Smart Trash Bin Market faces several key challenges that hinder widespread adoption. The combination of high initial costs for complex hardware, installation, and integration, with high maintenance costs, limits accessibility for smaller municipalities and developing regions. Operational reliability can be impacted by the complexity of maintenance, and relevant sensor calibration, battery replacements, and software updates might be needed. Limited and inconsistent Internet connectivity, coupled with inconsistent digital Congress, constrain deployment and reach in remote or resource-light communities. They also say that the effectiveness of smart bins is being diminished by user reluctance to new systems, lack of awareness in the public about the new systems and minimal uptake in waste sorting. Regulatory challenges due to data privacy concerns on tracking users and digital identification the technical, infrastructural, and behavioral hurdles lead to a reality in which portions of the market underperform relative to its long-run benefits.
Smart Trash Bin Market Segmentation Outlook:
By Capacity
The 14 to 23 gallon segment held a dominant Smart Trash Bin Market share of around 57% in 2024, due to the well-balanced combination of size and a high storage capacity. As such, it is ideal for residential, office, and public space settings where users demand efficient waste handling without allocating too much space or sacrificing operational practicality.
The 8 to 13 gallon segment is expected to experience the fastest growth in the Smart Trash Bin Market over 2025-2032 with a CAGR of 17.70%. Driven by increased demand for compact and space-efficient solutions among urban households, small workspaces, and mobile environments (such as RVs), this growth reflects a transition to smart and efficient waste management in space-constraint areas.
By Sales Channel
The Offline segment held a dominant Smart Trash Bin Market share of around 70% in 2024, owing to ability of customer to check the product physically, buy in bulk, and avail customized services personnel aspects. Unlike residential and startup purchases, commercial buyers, municipalities and institutions need offline channels for volume procurement and installations help, so retail and distributor networks are important to provide proven, high quality smart bin solutions.
The Online segment is expected to experience the fastest growth in the Smart Trash Bin Market over 2025-2032 with a CAGR of 14.19%. This growth is driven by the expanding penetration of e-commerce, convenience associated with doorstep delivery, wider range of products from multiple brands, and growing consumer inclination for the digital sale of smart, tech-enabled home, and office waste solutions.
By End-User
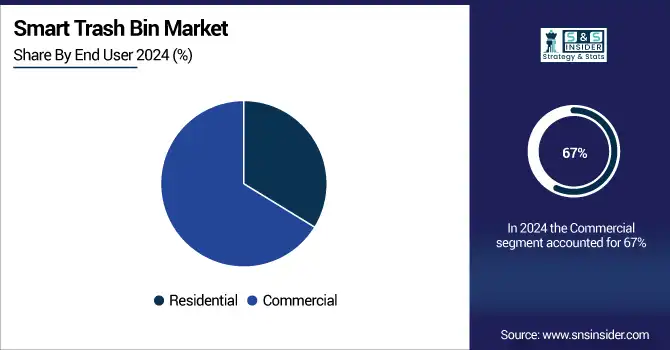
The Commercial segment held a dominant Smart Trash Bin Market share of around 67% in 2024, owing to extensive usage by offices, airports, hospitals, shopping malls and public infrastructure. These spaces need high capacity, automated bins to handle large quantities of waste more uniformly. Continued focus on hygiene with ongoing sustainability and smart facility management benefits which support commercial environment adoption
The Residential segment is expected to experience the fastest growth in the Smart Trash Bin Market over 2025-2032 with a CAGR of 16.37%. This growth is driven by rising smart home adoption, growing urban populations, increased consumer focus on hygiene, convenience, and automated waste solutions for modern living spaces.
By Operation
The Automatic segment held a dominant Smart Trash Bin Market share of around 74% in 2024, in response to the growing need for touch-free hygienic disposal of waste. In addition, automatic bins with motion sensors and additional smart sensor features are becoming more popular in high-traffic areas including offices, hospitals, and other public spaces where hands-free operation helps to maintain sanitation and convenience to the users.
The Semi-Automatic segment is expected to experience the fastest growth in the Smart Trash Bin Market over 2025-2032 with a CAGR of 16.95%. The growing demand for affordable and practical waste solutions in rural and semi-urban areas is contributing to this increase. These bins represent a compromise between smart feature sets and cost, making them more suited to broad market adoption.
By Compartment
The Multi-compartment segment held a dominant Smart Trash Bin Market share of around 65% in 2024, due to increasing focus towards segregating waste and recycling programs. Ideal for not just commercial buildings, but also smart cities & green homes looking to comply with environmental rules, these bins facilitate cost-effective separation of recyclables, organic waste & general garbage.
The Single Compartment segment is expected to experience the fastest growth in the Smart Trash Bin Market over 2025-2032 with a CAGR of 15.51%. This growth is fueled by the rising demand for compact, affordable, and easy-to-use bins in residential settings, especially in urban apartments and small offices where space efficiency and simplicity are key priorities.
Smart Trash Bin Market Regional Analysis:
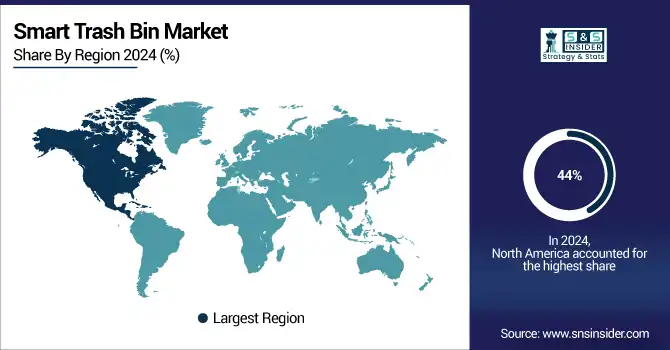
In 2024, North America dominated the Smart Trash Bin market and accounted for 44% of revenue share, owing to high investment in smart city infrastructure, high consumer awareness rate, and early adoption of IoT- based waste management solutions. Deployment within the commercial, residential, and public sectors has been stimulated due to the region's approach toward sustainability, hygiene, and tech-enabled municipal services which is rapidly forerunning the growth of the market.
Asia-Pacific is expected to witness the fastest growth in the Smart Trash Bin Market over 2025-2032, with a projected CAGR of 14.32%. These include extensive urbanization driven by confused large urban center initiatives of government, rising environmental awareness, and increasing proliferation of technology-supported public infrastructure. Growth in the number of middle-class consumers, along with the high demand for hygienic and automated waste disposal options is also boosting the regional market expansion.
In 2024, Europe emerged as a promising region in the Smart Trash Bin Market, driven by the regulations for eco-friendliness, focus on the circular economy, and smart urban infrastructure amid the regional emergence. The expansion of smart garbage solutions market across both commercial and residential sector is due to rising government driven waste segregation initiatives, increasing sustainability targets in residential sector and implementation of IoT based public services.
LATAM and MEA is experiencing steady growth in the Smart Trash Bin market, owing to growing urban development along with rising awareness towards sanitation coupled with steady adoption of smart city framework. With rapid urbanization across the globe leading to a marked increase in population, the need for effective waste management systems is unprecedented, which in turn is supporting the growth of automated, smart garbage collection systems, as governments and municipalities globally invest in relatively new-age waste management solutions for enhanced public hygiene and lesser environmental effects.
Get Customized Report as per Your Business Requirement - Enquiry Now
Key Players:
The Smart Trash Bin Companies are Ausko Pte Ltd., iTouchless, EcubeLabs, Simplehuman, EKO USA, Home Depot Inc., CleanRobotics, Nine Stars Group Inc., Binology LLC, BIG BELLY LLC., and Others.
Recent Developments:
-
In Jan 2025: Eureka launched the J15 Max Ultra robot vacuum at CES 2025, equipped with infrared tech to detect and clean wet spills safely.It lifts its roller brush to avoid liquid damage and uses mopping pads for efficient, mess-free cleaning
-
In Mar 2025: EcoSmart's new Universal Select Light Bulb, launching via Home Depot, offers adjustable brightness and six white light shades from 2700K to 6500K. Its flexible wattage compatibility and wide color range make it a versatile choice for smart home lighting needs.
| Report Attributes | Details |
|---|---|
| Market Size in 2024 | USD 84.19 Million |
| Market Size by 2032 | USD 216.99 Million |
| CAGR | CAGR of 12.57% From 2024 to 2032 |
| Base Year | 2024 |
| Forecast Period | 2025-2032 |
| Historical Data | 2021-2023 |
| Report Scope & Coverage | Market Size, Segments Analysis, Competitive Landscape, Regional Analysis, DROC & SWOT Analysis, Forecast Outlook |
| Key Segments | • By Capacity (8 to 13 gallon, 14 to 23 gallon, Above 23 gallon) • By Sales Channel (Online, Offline) • By End User (Residential, Commercial) • By Operation (Automatic, Semi-Automatic) • By Compartment (Single Compartment, Multi-compartment) |
| Regional Analysis/Coverage | North America (US, Canada, Mexico), Europe (Germany, France, UK, Italy, Spain, Poland, Turkey, Rest of Europe), Asia Pacific (China, India, Japan, South Korea, Singapore, Australia, Taiwan, Rest of Asia Pacific), Middle East & Africa (UAE, Saudi Arabia, Qatar, South Africa, Rest of Middle East & Africa), Latin America (Brazil, Argentina, Rest of Latin America) |
| Company Profiles | The Smart Trash Bins Companies are Ausko Pte Ltd., iTouchless, EcubeLabs, Simplehuman, EKO USA, Home Depot Inc., CleanRobotics, Nine Stars Group Inc., Binology LLC, BIG BELLY LLC.and Others. |
Frequently Asked Questions
North America dominated the Smart Trash Bin Market in 2024.
The “14 to 23 gallon” segment dominated the Smart Trash Bin Market.
Rising demand for automated waste management, smart city initiatives, and increasing focus on hygiene and sustainability.
The Smart Trash Bin Market size was valued at USD 84.19 Million in 2024 and is projected to reach USD 216.99 Million by 2032
The Smart Trash Bin Market is expected to grow at a CAGR of 12.57% during 2025-2032.
Get in Touch
