AMOLED Display Market Size & Trends:
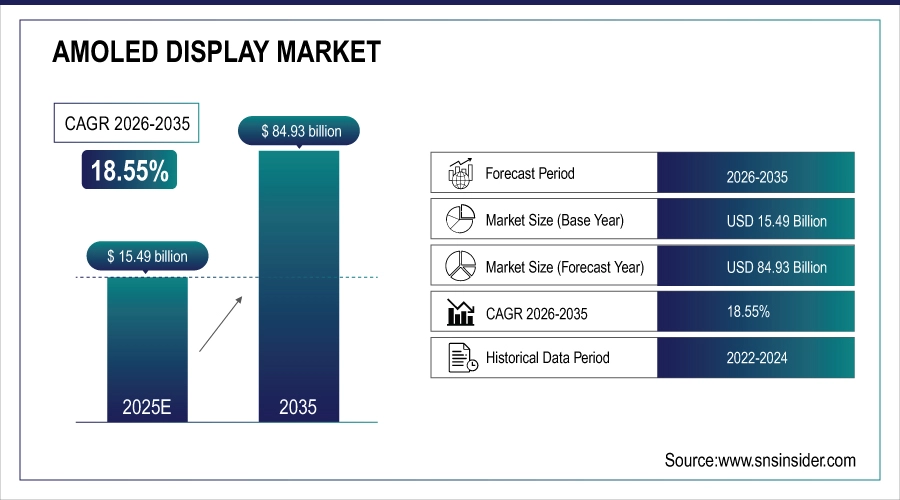
The AMOLED Display Market size was valued at USD 15.49 billion in 2025 and is expected to reach USD 84.93 billion by 2035, growing at a CAGR of 18.55% over the forecast period of 2026-2035.
AMOLED display market trends include increasing adoption in foldable smartphones, automotive displays, and wearable devices. Advancements in flexible and transparent panel technologies are also driving innovation and premium device integration. Growing usage of high-resolution, energy-efficient, and lightweight display solution among consumer electronics including smartphones, smartwatches, laptops, and TVs is expected to drive demand for AMOLED display market. Growing demand for foldable and flexible devices, and utilization of the AMOLED panels in automotive digital dashboards and infotainment systems, is propelling the expansion further.
AMOLED Display Market Size and Growth Forecast:
-
Market Size in 2025: USD 15.49 Billion
-
Market Size by 2035: USD 84.93 Billion
-
CAGR: 18.55% from 2026 to 2035
-
Base Year: 2025
-
Forecast Period: 2026–2035
-
Historical Data: 2022–2024
To Get more information on AMOLED Display Market - Request Free Sample Report
Key Trends in the AMOLED Display Market:
-
Rising demand for high-resolution, flexible, and foldable displays in smartphones, tablets, and wearable devices.
-
Increasing adoption of AMOLED technology in automotive displays, smart TVs, and AR/VR devices.
-
Growing emphasis on energy-efficient and low-power display solutions for mobile and IoT applications.
-
Expansion of large-size AMOLED panels for premium TVs and monitors.
-
Advancements in high-brightness and high-contrast display technologies to enhance user experience.
-
Rising investment in AMOLED manufacturing capacity, including OLED deposition and encapsulation processes.
-
Strategic partnerships between display panel manufacturers, smartphone OEMs, and consumer electronics brands to accelerate adoption.
U.S. AMOLED display market Size Outlook
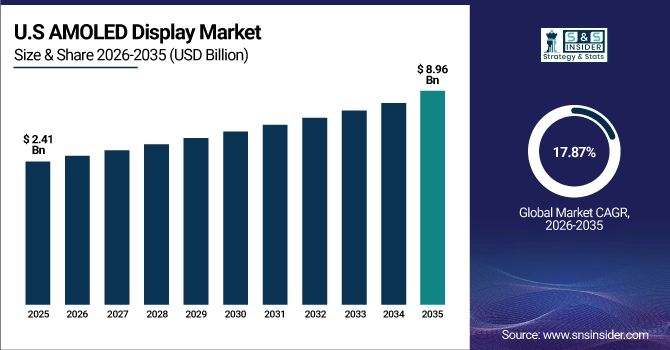
The U.S. AMOLED display market size was valued at USD 2.41 billion in 2025 and is expected to reach USD 8.96 billion by 2035, growing at a CAGR of 17.87% over the forecast period of 2026-2035. Driven by the increase in demand for premium smartphones, smartwatches, automotive displays, and the efficient speed of quick adoption of flexible screens and a domestically cultivated ecosystem of technical innovation, The U.S. AMOLED display market is able to witness significant growth.
AMOLED Display Market Drivers:
-
Flexible AMOLED Adoption Accelerates with Rising Demand for High Performance Displays Across Consumer and Automotive Markets
Growing demand for high-performance display technologies in smartphones, wearables, televisions, and automotive applications is poised to drive the global AMOLED display market growth. AMOLED panels have long been the preferred choice for consumers due to superior image quality, energy efficiency, deep contrast ratios, and faster response times compared to LCDs. They are also driving demand, well the major shift to foldables and flexible electronics will undoubtedly lead to this demand, these panels have the flexibility needed for new types of products. At the same time, lowering production costs and improving manufacturing capabilities particularly in Asia are speeding widespread adoption.
Samsung Display shipped 1.64 million automotive OLED displays in 2024, up from 600,000 units in 2023 (+273%), confirming expansion into automotive digital dashboards
AMOLED Display Market Restraints:
-
Durability Challenges Limit Growth Potential of Flexible Foldable AMOLED Panels in Consumer and Automotive Sectors
Flexible and foldable AMOLED panels are the most desirable category these days, however, lack of durability acts as one of the essential restraints in the AMOLED display market. These displays are more vulnerable to damage in the form of creasing, delamination, or burn-in over time and would impact user experience and reliability of consumer electronics and automotive applications. Apart from these issues, panel fragility during manufacturing and end-use, elevates rejection rates and maintenance issues.
AMOLED Display Market Opportunities:
-
Transparent and Rollable AMOLED Unlock New Growth Avenues Across EV Healthcare Smart Homes and Aerospace
The growing adoption of AMOLED displays in the electric vehicle and augmented reality device markets, and growing opportunities in healthcare data monitoring, also play a critical role in this market growth. Transparent and rollable AMOLED technologies open up new use-cases in commercial signage, smart homes, and aerospace as research and commercialize futuristic design aesthetics while utilizing space-saving advantages.
AR/VR headset display shipments are projected to climb, with 124 million displays forecast by 2028, driven by premium hardware launches such as Apple Vision Pro and Meta Quest 3
AMOLED Display Market Challenges:
-
Design Complexity and Material Dependency Pose Challenges to AMOLED Expansion in Emerging Technology Applications
Ongoing risks to production timelines are dependent on supply chain disruptions experienced to date and availability of some critical material dependencies (e.g., organic compounds, encapsulation, etc.) Additionally, the high onus of precision in design to fit AMOLED panels inside small devices such as smartwatches or medical wearables creates trouble for OEMs who need to meet certain quality to fill in the components in the overall design which slows down wide adoption of AMOLED panels in emerging applications such as in AR/VR and industrial monitoring.
AMOLED Display Market Segmentation Analysis:
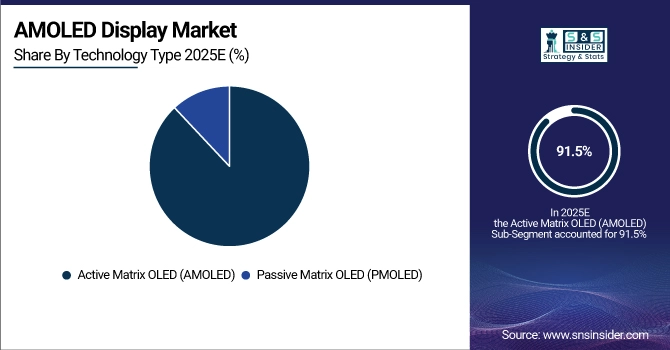
By Technology Type, AMOLED Segment Commands 91.5% of Mobile Phone Display Area in 2025, PMOLED Segment to Record Fastest Growth during 2026–2035
Active Matrix OLED (AMOLED) technology held a dominant 91.5% share of total mobile phone display area in 2025. Its high display quality, fast refresh rates, low power consumption, and suitability for flexible and foldable displays have made it the preferred technology for smartphones, TVs, automotive displays, and high-end wearables.
The Passive Matrix OLED (PMOLED) segment is expected to witness the fastest growth during 2026–2035. Its cost-effectiveness and suitability for small, simple displays in devices such as fitness bands, industrial equipment, and basic consumer electronics where full-motion video is not required are driving adoption.
By Product Type, Smartphones Segment Dominates AMOLED Display Market with 60.3% Share in 2025, Smartwatches and Wearables Segment to Record Fastest Growth during 2026–2035
Smartphones accounted for a prominent share of around 60.3% in the AMOLED display market in 2025. The increasing requirement for high-resolution, power-efficient, and bezel-less displays in high-end and mid-range smartphones is fueling the market. AMOLED displays are in high demand among prominent smartphone brands like Samsung, Apple, and Xiaomi due to their high contrast ratio, rich color gamut, and slimmer design, which improves the overall design of the smartphone. The trend of bezel-less and foldable smartphones is also contributing to this market.
Smartwatches and wearables is expected to see the fastest growth between 2026 and 2035. This is due to the increasing demand for health tracking capabilities, always-on displays, and smaller form factors. The adoption of AMOLED displays in fitness trackers and smartwatches improves outdoor visibility, beauty, and customized biometric analysis, thereby fueling the demand in this segment.
By Panel Type, Rigid AMOLED Segment Holds 40.5% Share in 2025, Foldable AMOLED Segment to Record Fastest Growth during 2026–2035
Rigid AMOLED displays held the largest share of 40.5% in 2025 and are widely used in mid-range smartphones, tablets, and automotive infotainment systems. This is because the technology has a mature manufacturing ecosystem and is relatively more affordable, which makes it suitable for applications that do not require flexible displays.
Foldable AMOLED displays are expected to record the fastest CAGR during 2026–2035. Rising demand for innovative, space-efficient, and premium devices in consumer electronics, including foldable smartphones, tablets, and laptops, is driving growth. Improved panel materials and longer life expectancy are supporting global commercialization.
By End-Use Industry, Consumer Electronics Segment Dominates with 80.2% Share in 2025
The consumer electronics industry represented 80.2% of the AMOLED display market in 2025. The extensive adoption of AMOLED displays in smartphones, smartwatches, tablets, laptops, and TVs contributes to the market's dominance. The increasing adoption of AMOLED displays in high-end and mid-range consumer electronics is driven by their enhanced resolution, power-saving capabilities, and flexible designs. Major players like Samsung, Apple, and Huawei are also incorporating AMOLED displays into their products to offer a distinct viewing experience.
AMOLED Display Market Regional Insights:
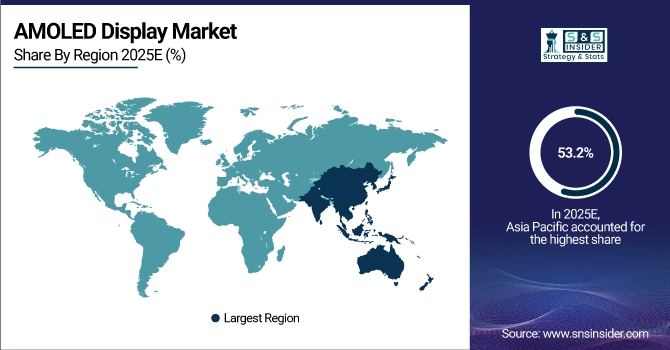
Asia-Pacific Dominates AMOLED Display Market in 2025
In 2025, the Asia-Pacific region contributed 53.2% of the overall market share of AMOLED displays, thanks to strong production capacity, a growing demand for consumer electronics, and technological developments in display technology by local companies. South Korea, China, and Japan have invested heavily in production facilities and research and development in OLED technology, making it possible to mass-produce high-quality panels. The region is also fueled by the increasing adoption of smartphones and smart devices in India and Southeast Asia.
South Korea currently has a leading position in the Asia-Pacific market for AMOLED displays, with the two biggest players in the industry being Samsung Display and LG Display. This is due to their technological know-how and supply chain dominance.
Get Customized Report as per Your Business Requirement - Enquiry Now
North America is a Key Growth Region for AMOLED Displays
North America is a major market for high-end consumer electronics, smart wearables, and automotive displays. The region has high purchasing power, adoption of technology, and growing investments in electric vehicles and healthcare devices featuring AMOLED displays. US-based technology companies apply AMOLED technology in their energy-efficient and high-quality UI solutions, and joint ventures with Asian manufacturers ensure a constant supply of high-end displays for smartphones, tablets, and infotainment systems.
Europe AMOLED Display Market Insights
Europe represented a substantial part of the overall AMOLED display market in 2025, driven by the adoption of AMOLED displays in the automotive, medical, and industrial sectors. European automakers are increasingly adopting AMOLED displays in digital instrument clusters and infotainment systems to improve the driving experience. The region is also driven by the growing adoption of smartwatches, AR/VR devices, and medical monitoring systems. Germany and France are at the forefront of innovation and adoption, with collaborations with Asian companies and a focus on sustainable high-performance electronic components.
Latin America and Middle East & Africa Represent Emerging Markets
In 2025, Latin America and the Middle East & Africa showed gradual growth in AMOLED adoption, supported by rising smartphone penetration, expanding middle-class populations, and increasing demand for modern consumer electronics. Brazil, UAE, and South Africa are key contributors, with growth driven by foldable devices, smart TVs, and AMOLED-equipped wearables. Regional investments in digital infrastructure, smart city projects, and automotive modernization are creating new opportunities for market expansion.
AMOLED Display Companies are:
-
Samsung Display
-
BOE Technology Group
-
Tianma Microelectronics
-
Visionox Information Technology
-
AU Optronics (AUO)
-
Japan Display Inc. (JDI)
-
Sharp Corporation
-
EverDisplay Optronics (EDO)
-
China Star Optoelectronics Technology (CSOT)
-
Royole Corporation
-
Truly International Holdings
-
Universal Display Corporation (UDC)
-
Innolux Corporation
-
HannStar Display Corporation
-
JOLED Inc.
-
Kyocera Corporation
-
Panasonic Corporation
-
RITEK Corporation
-
Planar Systems
Competitive Landscape of AMOLED Display Market:
Samsung Display
Samsung Display is a South Korea-based global leader in AMOLED display technology, providing panels for smartphones, wearables, televisions, and automotive applications. The company specializes in high-resolution, flexible, and foldable AMOLED panels with superior color accuracy, contrast ratio, and energy efficiency. Its role in the AMOLED Display Market is pivotal, driving innovation in mobile and consumer electronics, and enabling advanced designs such as bezel-less and curved displays.
-
In 2025, Samsung Display launched a next-generation foldable AMOLED panel with improved durability, ultra-high brightness, and enhanced energy efficiency for premium smartphones and tablets.
LG Display
LG Display is a South Korea-based multinational display manufacturer, offering large-format and flexible AMOLED panels for TVs, monitors, and automotive displays. The company focuses on high-quality, energy-efficient displays with wide color gamut, deep blacks, and high refresh rates. Its role in the AMOLED Display Market is significant, supplying innovative panels that enhance viewing experiences across premium consumer electronics and smart devices.
-
In 2025, LG Display introduced a new OLED TV panel with 8K resolution, foldable design capability, and advanced HDR performance, targeting high-end entertainment and smart home applications.
BOE Technology Group
BOE Technology Group is a China-based leader in display solutions, producing flexible and rigid AMOLED panels for smartphones, wearables, tablets, and automotive applications. The company is recognized for its rapid expansion in AMOLED production capacity and investment in research and development. Its role in the AMOLED Display Market is crucial, driving large-scale adoption of flexible and foldable displays in both domestic and international markets.
-
In 2025, BOE Technology Group unveiled a high-brightness, low-power AMOLED panel for next-generation smartphones and foldable devices, supporting ultra-thin form factors and advanced touch responsiveness.
Tianma Microelectronics
Tianma Microelectronics is a China-based display manufacturer providing AMOLED panels for mobile devices, wearables, and industrial applications. The company specializes in compact, high-resolution displays with excellent color accuracy and power efficiency, catering to mid-range and premium device segments. Its role in the AMOLED Display Market is growing, enabling wider adoption of AMOLED technology in emerging markets and innovative consumer electronics.
-
In 2025, Tianma Microelectronics introduced an AMOLED display lineup optimized for smartwatches and wearable devices, featuring enhanced outdoor visibility, reduced power consumption, and durable panel design.
| Report Attributes | Details |
|---|---|
| Market Size in 2025 | USD 15.49 Billion |
| Market Size by 2035 | USD 84.93 Billion |
| CAGR | CAGR of 18.55% From 2026 to 2035 |
| Base Year | 2025 |
| Forecast Period | 2026-2035 |
| Historical Data | 2022-2024 |
| Report Scope & Coverage | Market Size, Segments Analysis, Competitive Landscape, Regional Analysis, DROC & SWOT Analysis, Forecast Outlook |
| Key Segments | • By Product Type (Smartphones, Smartwatches & Wearables, Televisions, Laptops & Tablets, and Automotive Displays, Others (digital signage, industrial devices)) • By Technology Type (Passive Matrix OLED (PMOLED), and Active Matrix OLED (AMOLED)) • By Panel Type (Rigid AMOLED, Flexible AMOLED, Foldable AMOLED, and Transparent AMOLED) • By End-Use Industry (Consumer Electronics, Automotive, Healthcare, Industrial & Commercial, and Others (defense, aerospace)) |
| Regional Analysis/Coverage | North America (US, Canada, Mexico), Europe (Germany, France, UK, Italy, Spain, Poland, Turkey, Rest of Europe), Asia Pacific (China, India, Japan, South Korea, Singapore, Australia, Taiwan, Rest of Asia Pacific), Middle East & Africa (UAE, Saudi Arabia, Qatar, South Africa, Rest of Middle East & Africa), Latin America (Brazil, Argentina, Rest of Latin America) |
| Company Profiles | Samsung Display, LG Display, BOE, TCL CSOT, Visionox, E3 Display, AUO, Royole, JDI, Sharp, Tianma, Truly, EverDisplay, Govisionox, HKC, Innolux, Kyocera, FlexEnable, Universal Display Corp., and BOET. |
Frequently Asked Questions
Ans: Asia Pacific dominated the AMOLED Display Market in 2025.
Ans: Rigid AMOLED segment dominated the AMOLED Display Market.
Ans: The major growth factor driving the AMOLED Display Market is the rising demand for high-resolution, energy-efficient, and flexible displays in consumer electronics.
Ans:The AMOLED Display Market size was valued at USD 15.49 billion in 2025 and is expected to reach USD 84.93 billion by 2035, growing at a CAGR of 18.55% over the forecast period of 2026-2035.
Ans: The AMOLED Display Market is expected to grow at a CAGR of 18.55% from 2026-2035.
Get in Touch
