Solar Energy Market Report Scope & Overview:
To Get More Information on Solar Energy Market - Request Sample Report
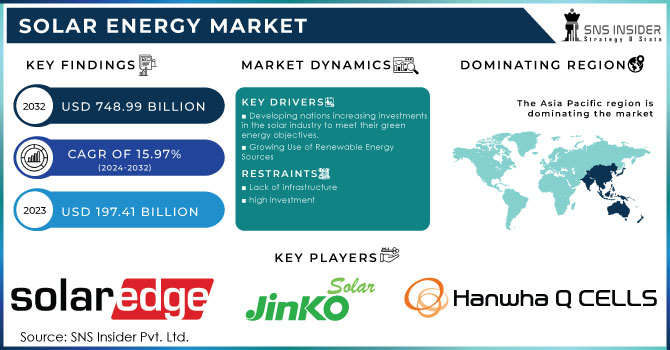
The Solar Energy Market size was valued at USD 197.41 billion in 2023 and is expected to grow to USD 748.99 billion by 2032 and grow at a CAGR of 15.97 % over the forecast period of 2024-2032.
The sun is a fantastic renewable resource that has the ability to maintain life on earth and give all of its people access to clean, sustainable energy. In fact, the sun sends more energy to our planet in a single hour than the entire world's population uses in a whole year. Electricity may be created from solar energy by use of solar energy is captured by PV modules, which then transform it into an electrical current that may be used. The fact that the sun shines everywhere makes solar energy practical. Solar electric systems may be independent of grid power since solar can be combined with batteries for energy storage.
MARKET DYNAMICS
KEY DRIVERS:
-
Developing nations increasing investments in the solar industry to meet their green energy objectives.
-
Growing Use of Renewable Energy Sources
Considered to be the best feasible substitute for traditional power sources like coal and oil, renewable energy sources assist minimise carbon emissions and serve as an affordable supply of daily electricity. Presently, over 29% of the power produced worldwide comes from renewable sources. In the approaching years, it is anticipated to increase significantly and expand the market. Solar PV will have an installed capacity of 842.14 GW by the end of 2021, making it the second-largest renewable energy source after wind.
RESTRAIN:
-
Lack of infrastructure
-
high investment
Solar PV installation is more expensive overall than setting up conventional solar panels, which may limit its use in homes with relatively moderate energy consumption. 15 ground-mounted solar panels with a rating of It would cost $14,625 for 300 watts. Since the solar structure would raise the cost of each solar panel by USD 500, the solar power generating system would be used less frequently. Another thing preventing investments in this market is a lack of infrastructure. The growing preference for solar PV over traditional grid electricity due to public understanding of its advantages might impede industry expansion.
OPPORTUNITY:
-
Increasing public knowledge of solar energy's environmental advantages
-
Integration of New Technologies Will Offer Significant Growth Potential
Artificial intelligence's enhanced prediction skills are enabling improved forecasting and asset management, and its automation capacity is driving operational excellence, giving stakeholders a competitive edge and cost savings.
CHALLENGES:
-
Lack of technological expertise
IMPACT OF RUSSIA-UKRAINE WAR
The world solar business has been significantly impacted by the Russia-Ukraine conflict. Both nations are significant players in the solar sector, with Russia and Ukraine each contributing around 3% and 8%, respectively, of worldwide output. Prices for both raw materials and finished goods have increased, disrupting many firms' supply chains. Since both nations are key players in the wind and solar sectors, the war has also had a significant negative impact on the renewable energy industry. Prices for both raw materials and completed goods have increased significantly as a result of the fighting, which has also affected the supply chain for many firms. This has impacted the remainder of the renewable energy industry.
IMPACT OF ONGOING RECESSION
Solar Energy producers had various challenges during the recession that limited their capacity to expand and become profitable. Investing in renewable energy sources lost importance as people's finances shrank. As a result, manufacturers saw a decline in sales and income. The availability of finance alternatives for solar energy installations was also impacted by the recession. Consumer behaviour was also impacted by the recession, notably in the solar energy business. Consumers grew increasingly price-sensitive as a result of the impending financial uncertainties and shifted their attention from long-term investments to short-term savings. As a result, the demand for premium, high-performance batteries decreased while the demand for less expensive, lower-quality batteries soared.
KEY MARKET SEGMENTATION
By Product
-
Solar Panels
-
Charge Controllers
-
Batteries
-
Inverter
-
Others
By Source
-
New Installation
-
MRO
By End-use
-
Residential
-
Commercial
-
Industrial
-
Utility
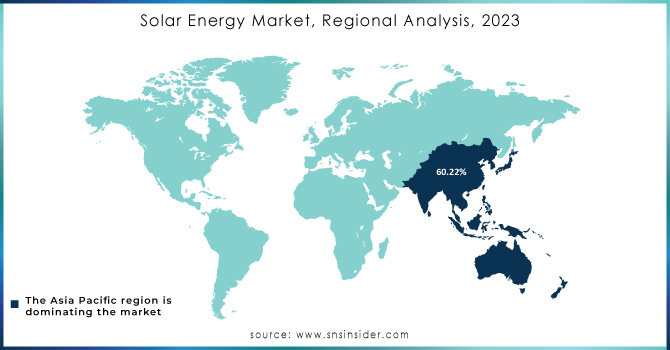
REGIONAL ANALYSIS
In 2022, Asia Pacific had the biggest revenue share (almost 60.22%) and dominated the world market. In terms of income, East Asia dominated the Asia Pacific area in 2022. The region has experienced significant product demand as a consequence of the desire to lessen dependency on traditional power sources and the existence of established competitors who are consistently improving their offers. Due to rising investments in renewable energy from the nations in the region, the Middle East & Africa region is predicted to develop at a substantial CAGR from 2022 to 2030. Due to the high installation costs, solar energy adoption in the region is rather limited.
Do You Need any Customization Research on Solar Energy Market - Enquire Now
REGIONAL COVERAGE:
North America
-
US
-
Canada
-
Mexico
Europe
-
Eastern Europe
-
Poland
-
Romania
-
Hungary
-
Turkey
-
Rest of Eastern Europe
-
-
Western Europe
-
Germany
-
France
-
UK
-
Italy
-
Spain
-
Netherlands
-
Switzerland
-
Austria
-
Rest of Western Europe
-
Asia Pacific
-
China
-
India
-
Japan
-
South Korea
-
Vietnam
-
Singapore
-
Australia
-
Rest of Asia Pacific
Middle East & Africa
-
Middle East
-
UAE
-
Egypt
-
Saudi Arabia
-
Qatar
-
Rest of Middle East
-
-
Africa
-
Nigeria
-
South Africa
-
Rest of Africa
-
Latin America
-
Brazil
-
Argentina
-
Colombia
-
Rest of Latin America
RECENT DEVELOPMENTS
-
According to IRENA, India's installed solar PV capacity increased from 49.3 GW in 2021 to around 62.8 GW in 2022. This represented an increase of almost 31% year over year. India installed several solar PV systems, particularly for utility projects, which caused the growth: The Indian government has additional plans to boost the installed solar PV capacity.
-
In August 2022, the National Thermal Power Corporation Limited (NTPC) began operating a solar PV facility close to Hazira in Surat. With the addition of the 56 MW Kawas solar PV plant, NTPC's solar footprint will reach 68,454 MW of collectively installed and commercial capacity. When these projects are finished, the market share for solar PV will increase.
-
Reliance Industries (RIL) and the Gujarat government entered into an agreement in January 2022 to spend USD 60,960 million in Gujarat over a period of 10–15 years to build 100 GW of renewable energy power plants and a green hydrogen ecosystem. Solar power plants are among the renewable energy power plants at the utility scale. RIL anticipates investing USD 7,315.2 million in establishing factories producing fuel cells, batteries, electrolyzes, and solar PV modules for planned renewable energy projects.
KEY PLAYERS
The Major Players are Hanwha Q Cells Co., Ltd., jinkoSolar Holding Co., Lta., SolarEdge Technologies, Enphase Energy, Inc., Canadian Solar, Trina solar, First Solar, Inc., SunPower Corporation, Vingli Green Energy Holding Company Limited, JA Solar Holdings Co. Ltd. And other players are listed in a final report.
| Report Attributes | Details |
| Market Size in 2023 | US$ 197.41 Bn |
| Market Size by 2032 | US$ 748.99 Bn |
| CAGR | CAGR of 15.97 % From 2024 to 2032 |
| Base Year | 2023 |
| Forecast Period | 2024-2032 |
| Historical Data | 2020-2022 |
| Report Scope & Coverage | Market Size, Segments Analysis, Competitive Landscape, Regional Analysis, DROC & SWOT Analysis, Forecast Outlook |
| Key Segments | • By Product (Solar Panels, Charge Controllers, Batteries, Inverter, Others) • By Source (New Installation, MRO) • By End-use (Residential, Commercial, Industrial, Utility) |
| Regional Analysis/Coverage | North America (US, Canada, Mexico), Europe (Eastern Europe [Poland, Romania, Hungary, Turkey, Rest of Eastern Europe] Western Europe] Germany, France, UK, Italy, Spain, Netherlands, Switzerland, Austria, Rest of Western Europe]). Asia Pacific (China, India, Japan, South Korea, Vietnam, Singapore, Australia, Rest of Asia Pacific), Middle East & Africa (Middle East [UAE, Egypt, Saudi Arabia, Qatar, Rest of Middle East], Africa [Nigeria, South Africa, Rest of Africa], Latin America (Brazil, Argentina, Colombia Rest of Latin America) |
| Company Profiles | Hanwha Q Cells Co., Ltd., jinkoSolar Holding Co., Lta., SolarEdge Technologies, Enphase Energy, Inc., Canadian Solar, Trina solar, First Solar, Inc., SunPower Corporation, Vingli Green Energy Holding Company Limited, JA Solar Holdings Co. Ltd. |
| Key Drivers | • Developing nations increasing investments in the solar industry to meet their green energy objectives • Growing Use of Renewable Energy Sources |
| Market Restraints | • Lack of infrastructure • high investment |
Get in Touch
