Military Power Solutions Market Report Scope & Overview:
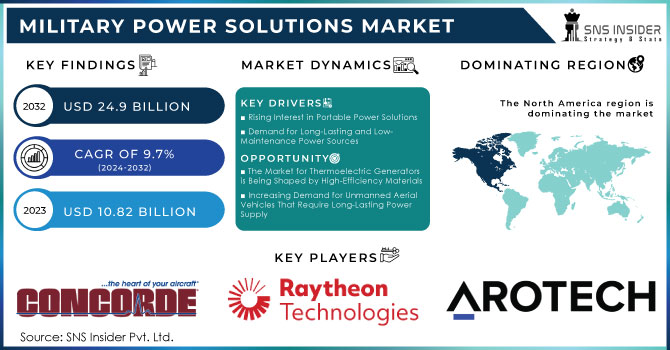
The Military Power Solutions Market size was USD 10.82 billion in 2023 and is projected to reach USD 24.9 billion by 2032, growing at a CAGR of 9.7% over the forecast period of 2024-2032.
Military power solutions are used to power remote outposts, electrical gadgets, machinery, and military drones, also known as unmanned aerial vehicles. The most popular military power technologies used around the world are batteries, generators, and solar power cells. Military power solution producers are always concentrating on the development of power solutions while keeping in mind the norms and regulations set by the defence authorities. The military power solutions market is positioned to benefit from factors such as rising demand for long-lasting and maintenance-free power solutions, increased demand for portable power solutions, and rising defence electronic budgets. Furthermore, the increased defence budget is raising interest among defence sectors in adopting power solutions to help military troops and equipment.
To get more information on Military Power Solutions Market - Request Free Sample Report
MARKET DYNAMICS:
KEY DRIVERS:
-
Rising Interest in Portable Power Solutions
-
Demand for Long-Lasting and Low-Maintenance Power Sources
RESTRAINTS:
-
Inability to Produce High Output Power
-
Developed countries' defence budgets are shrinking.
OPPORTUNITIES:
-
The Market for Thermoelectric Generators is Being Shaped by High-Efficiency Materials
-
Increasing Demand for Unmanned Aerial Vehicles That Require Long-Lasting Power Supply
CHALLENGES:
-
Nuclear Power Technologies in Development
-
Renewable Energy Sources to Replace Batteries and Generators
IMPACT OF COVID-19
COVID-19 is a historic global public health catastrophe that has damaged virtually every industry, with long-term implications that are predicted to limit industrial expansion during the forecast period. Our ongoing research is improving our research methodology to ensure that underlying COVID-19 problems and potential future paths are addressed. COVID-19 insights are provided while taking into consideration changes in consumer behaviour and demand, purchasing patterns, supply chain re-routing, the dynamics of current market forces, and significant government activities. In light of the market impact of COVID-19, this research provides insights, analyses, predictions, and forecasts.
The portable segment dominated the market and is expected to grow at a higher CAGR during the study period due to rising demand and use of various portable military power systems because they are compact and lightweight and can be easily carried during operations, which will drive the segment's growth.
Non-Portable- The growing demand for heavy-duty or high-power supply solutions for military equipment and military camps is expected to fuel market expansion in this sector. Battery Engine Part is expected to testify to the significant growth rate in the market during the study due to the growing demand for rechargeable batteries due to increased use of UAVs, which require long-lasting and stable power supply. Generators -The segment is expected to grow with a stable CAGR in the market during the review period, 2023 to 2030, due to the growing need for improved status awareness and the need for generators in emergencies such as power failures. Fuel Cells- The segment dominated the market and is expected to grow at a very high CAGR at the time of forecasting, due to growing acquisitions or the need for secure, long-lasting and reliable energy solutions.
Solar Energy -The unit is expected to record significant growth in the market during the period due to the benefits offered by solar energy solutions such as low cost of ownership, renewable, sustainable, and environmentally friendly.
Power Harvesters- This segment is expected to grow with a positive CAGR at the time of forecasting, due to the growing demand for small amounts of low-energy military power. Air The segment is predicted to expand as demand for military aircraft, military helicopters, and military transport aircraft rises. Furthermore, increased UAV use is likely to fuel sector growth in the worldwide military power solutions market during the study period. Marine- The industry is likely to develop as military power solutions become more prevalent on shipboard for the seamless operation of power supply-based systems. land The sector dominated the market and is predicted to grow at the fastest CAGR during the forecast period, owing to the increased use of armoured vehicles in combat operations, which will fuel the segment's growth.
Low Power -The category is predicted to develop at a substantial CAGR from 2023 to 2030, owing to factors such as troops' increased use of diverse power solutions with less than 200 watts of power and compact military gadgets.
Medium Power -Due to its cost-effective systems and efficient performance, which is largely utilised in ground vehicles such as tanks and trucks with roughly 255 watts of power, the category is predicted to expand at the greatest CAGR during the forecast period, 2023 to 2030. High Power -The segment is predicted to increase at a significant CAGR from 2023 to 2030, owing to factors such as rising demand for high-grade power supply systems with more than 255 watts of heavy-duty consumption applications.
KEY MARKET SEGMENTATION
By Application
-
Air
-
Land
-
Naval
By Source
-
Batteries
-
Generators
-
Fuel Cells
-
Energy Harvesters
By Wattage
-
Low
-
Medium
-
High Power
By Type
-
Portable
-
Non-Portable
REGIONAL ANALYSIS
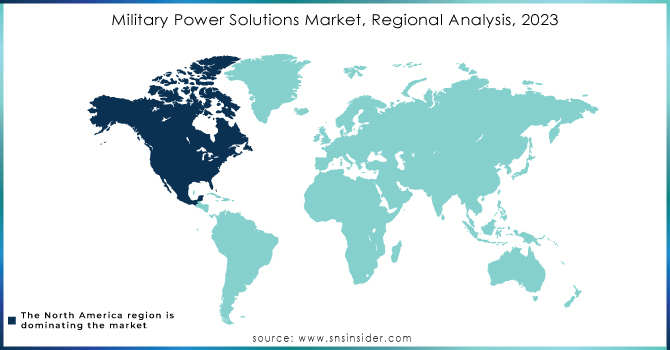
Due to the presence of important players such as Schaefer, Inc. and Advanced Conversion Technology, Inc., North America led the military power solutions market.
Europe The Military Power Solutions Market in this area is expected to grow at a stable CAGR throughout the study period as countries such as the United Kingdom, Germany, Russia, and others create advanced military ships and vessels that require advanced power solutions. As a result, the regional market is expanding.
Asia-Pacific This region's market is expected to grow at the fastest rate during the forecast period. The rising defence spending of countries such as China, Japan, and India is likely to boost demand for military power solutions in the Asia-Pacific region.
World at Large Domestic conflicts, drug smuggling, and trafficking are projected to raise demand for military power solutions throughout the rest of the world.
Need any customization research on Military Power Solutions Market - Enquiry Now
REGIONAL COVERAGE:
- North America
-
USA
-
Canada
-
Mexico
-
- Europe
-
Germany
-
UK
-
France
-
Italy
-
Spain
-
The Netherlands
-
Rest of Europe
-
- Asia-Pacific
-
Japan
-
south Korea
-
China
-
India
-
Australia
-
Rest of Asia-Pacific
-
- The Middle East & Africa
-
Israel
-
UAE
-
South Africa
-
Rest of Middle East & Africa
-
- Latin America
-
Brazil
-
Argentina
-
Rest of Latin America
-
KEY PLAYERS
The Key Players are Denchi Power Ltd., Concorde Battery Corporation, Raytheon Company, Advanced Conversion Technology, Inc., Arotech Corporation, Energy Technologies Inc., SFC Energy AG, Saft Group S.A., Enersys Inc., Eaglepicher Technologies, LLC & Other Players.
| Report Attributes | Details |
|---|---|
| Market Size in 2023 | US$ 10.82 Billion |
| Market Size by 2032 | US$ 24.9 Billion |
| CAGR | CAGR of 9.7% From 2024 to 2032 |
| Base Year | 2023 |
| Forecast Period | 2024-2032 |
| Historical Data | 2020-2022 |
| Report Scope & Coverage | Market Size, Segments Analysis, Competitive Landscape, Regional Analysis, DROC & SWOT Analysis, Forecast Outlook |
| Key Segments | • By Application (Air, Land, Naval) • By Source (Batteries, Generators, Fuel Cells, Solar Power, Energy Harvesters) • By Wattage (Low, Medium, and High Power) • By Type (Portable, Non-Portable) |
| Regional Analysis/Coverage | North America (USA, Canada, Mexico), Europe (Germany, UK, France, Italy, Spain, Netherlands, Rest of Europe), Asia-Pacific (Japan, South Korea, China, India, Australia, Rest of Asia-Pacific), The Middle East & Africa (Israel, UAE, South Africa, Rest of Middle East & Africa), Latin America (Brazil, Argentina, Rest of Latin America) |
| Company Profiles | Denchi Power Ltd., Concorde Battery Corporation, Raytheon Company, Advanced Conversion Technology, Inc., Arotech Corporation, Energy Technologies Inc., SFC Energy AG, Saft Group S.A., Enersys Inc., Eaglepicher Technologies, LLC |
| DRIVERS | • Rising Interest in Portable Power Solutions • Demand for Long-Lasting and Low-Maintenance Power Sources |
| RESTRAINTS | • Inability to Produce High Output Power • Developed countries' defence budgets are shrinking. |
Frequently Asked Questions
Yes, this report cover top down , bottom up Quantitative Research. Qualitative Research, Fundamental Research, data triangulation, ID’s & FGD’s Analytical research, And other as per report requirement.
COVID-19 is a historic global public health catastrophe that has damaged virtually every industry, with long-term implications that are predicted to limit industrial expansion during the forecast period.
Denchi Power Ltd., Concorde Battery Corporation, Raytheon Company, Advanced Conversion Technology, Inc., Arotech Corporation, Energy Technologies Inc.,SFC Energy AG, Saft Group S.A., Enersys Inc., Eaglepicher Technologies, LLC.
The sample for the Military Power Solutions Market report is available on the website upon request. To obtain the sample report, you can also use the 24*7 chat support and direct call services.
Military Power Solutions Market Size was valued at USD 9.87 billion in 2022, expected to reach USD 20.70 billion by 2030, and grow at a CAGR of 9.7% over the forecast period 2023-2030.
Get in Touch
