Get E-PDF Sample Report on Specialty Gas Market - Request Sample Report
The Specialty Gas Market has been growing considerably, with increased requirements of specialty gases across the healthcare industry. It contains these gases which are important to anesthesia, respiratory therapy, and many types of surgery. They lend themselves as well to the calibration of equipment used in medical settings absolutely necessary for precise and compliant measurements essential to patient care. This is stimulating the focus of key players in the market to expand their product offerings and invest in innovation to capitalize on this market demand.
For example, in 2022, Air Products intensified its special gas production capacity to cater to the burgeoning demands of the pure-play healthcare industry. These trends underline the increasing focus on improving the accessibility and quality of special gases, especially for medical usage, which is likely to further boost market expansion.
Furthermore, the manufacturing sector benefits greatly from specialty gases, as they are utilized in various industrial processes. For example, they are crucial for welding, heat treatment, and metal fabrication, ensuring superior product quality and operational efficiency. In the case of scientific research, specialty gases are indispensable tools for conducting experiments and analysis. They are used in laboratories worldwide for applications such as chromatography, spectroscopy, and environmental testing. The exceptional purity and accuracy of these gases enable researchers to obtain precise and reliable results.
The consumption of specialty gases is also growing significantly in manufacturing & industrial and auto/transport, chemical & electronics as well as food & beverages. Utilization of specialty gases like argon, nitrogen, and carbon dioxide is imperative to carry out the welding cuttings and insulation in the automotive sector. Moreover, the food and drink industries also utilize gases like nitrogen, and carbon dioxide for packaging and preservation by means of distribution systems for longer shelf life to ensure consumer safety which drive the market growth. The chemicals industry also requires specialty gases for chemical synthesis and refining processes with the U.S. chemicals manufacturing sector accounting for over USD 550 billion to the economy in 2023, according to The U.S. Bureau of Economic Analysis. The demand for specialty gases continues to rise in major end-use applications, underpinned by robust economic contributions and initiatives of governing bodies as highlighted by the study.
Drivers
Rising demand for specialty gases in various industries
The growing need for high-purity gases in research and development activities
The advancements in scientific research and technological innovations have led to a greater emphasis on precision and accuracy. As a result, researchers and developers require gases with extremely high levels of purity to ensure reliable and consistent results. These high-purity gases are essential in various industries such as pharmaceuticals, electronics, and aerospace, where even the slightest impurities can have detrimental effects on the final product or experiment. Moreover, the rising awareness regarding environmental concerns has prompted the adoption of cleaner and greener technologies. Specialty gases play a crucial role in this transition by enabling the development of eco-friendly alternatives. For example, in the automotive industry, specialty gases are used in the production of electric vehicle batteries, reducing the reliance on fossil fuels and contributing to a more sustainable future. Furthermore, the increasing focus on healthcare and medical research has further fueled the demand for specialty gases. These gases are utilized in medical imaging, diagnostics, and therapeutic applications, where precision and purity are of utmost importance. The continuous advancements in medical technology and the growing need for accurate diagnosis and treatment options have created a significant market for specialty gases.
Restraint
High costs associated with producing and storing specialty gases hamper the market growth.
One of the major challenges for the market is the high cost involved in specialty gases, which could have an adverse impact on their production and storage as well. The purity of these gases is often made by very elaborate and expensive processes, so to manufacture them in order they are pure enough for the final application can require very high-level production technology. The manufacturer must also invest in the necessary infrastructure to ensure safe storage, transportation, and handling, which results in additional operating costs. All of these factors combine to make specialty gases more expensive than standard industrial gases, which can dampen their use, especially in price-sensitive markets.
Opportunities
Growing demand for eco-friendly specialty gases
Expanding applications of specialty gases in emerging industries
By Product
The carbon gas segment dominated the specialty gas market with the highest market share of about 31.6% in 2023. Carbon gases are extensively utilized in various medical equipment, including nuclear magnetic resonance imaging, magnetic resonance imaging, and ophthalmology, among others. The demand for carbon gases remains consistently high across sectors such as electronics, manufacturing, healthcare, and chemicals. The expanding range of applications for carbon gases, particularly in instrument calibration, is driving the surge in demand for these gases.
By Application
In the specialty gas market, the electronics sector is currently leading in terms of demand and growth. Specialty gases such as nitrogen, argon, and fluorine are essential in semiconductor manufacturing processes, including etching, doping, and wafer cleaning. The rapid expansion of the electronics industry, driven by the growing adoption of advanced technologies like 5G, artificial intelligence (AI), and the Internet of Things (IoT), has significantly boosted the demand for ultra-high purity gases. Additionally, stringent purity standards in electronics manufacturing make specialty gases indispensable for ensuring product quality, further solidifying the sector's dominance over other applications like healthcare, manufacturing, and institutional use.
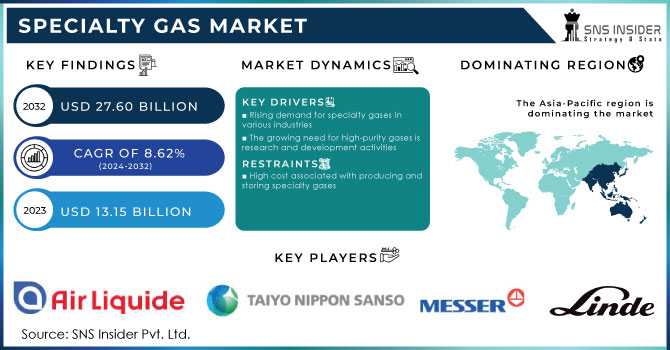
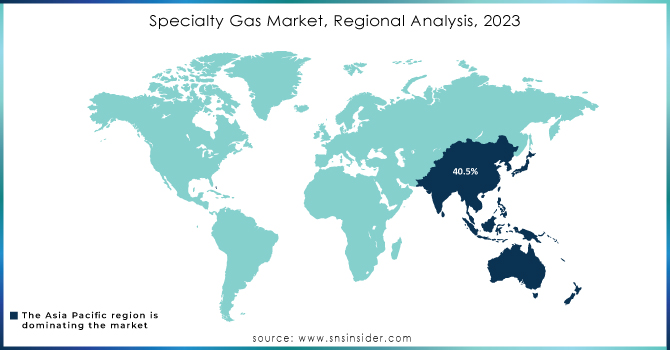
Asia Pacific dominated the Specialty Gas Market with the highest revenue share of about 40.5% in 2023. This region boasts numerous electronic manufacturing hubs located in China, Japan, and India. Moreover, local governments are actively promoting the expansion of various end-use industries, including consumer electronics, oil and gas, manufacturing, and healthcare, through initiatives such as Production-Linked Incentives (PLI), subsidies, and favorable Foreign Direct Investment (FDI) policies. These factors collectively contribute to the remarkable growth and dominance of the specialty gas industry in the Asia Pacific region.
Europe held a significant revenue share of the Specialty Gas Market and is expected to grow with a CAGR of about 8.4% during the forecast period. The region is actively focusing on expanding its production capacity to meet the increasing demand from various end-use industries. Furthermore, the healthcare and pharmaceutical sectors are witnessing substantial investments, which are expected to further drive the demand for specialty gases in the region. For example, the French government announced a public funding plan of USD 8.33 billion in June 2021, aimed at advancing the healthcare system within the country. Europe, being the second largest chemical producer globally, boasts advanced healthcare technologies and facilities. However, it lags behind in the semiconductor industry. Nevertheless, certain European countries, including the Netherlands, Germany, France, and the U.K., are witnessing a surge in demand for electronic gases. By enhancing production capacity and capitalizing on investments in the healthcare and pharmaceutical sectors, Europe is poised to maintain its strong position in the Specialty Gas Market. Additionally, the growth potential in the semiconductor industry presents an opportunity for European countries to bridge the gap and further diversify their specialty gas market.
Get Customized Report as Per Your Business Requirement - Request For Customized Report
Air Liquide (ALPHAGAZ™ Specialty Gases)
Norco Inc. (AIRZERO)
Linde plc (HiQ Specialty Gases)
Air Products and Chemicals, Inc. (Experis Specialty Gases)
Praxair, Inc. (StarFlame Cutting Gases)
Matheson Tri-Gas, Inc. (SEMICORE Semiconductor Gases)
Messer Group GmbH (Messer SpecPure Gases)
Iwatani Corporation (Specialty Helium Gas)
MESA Specialty Gases & Equipment
Taiyo Nippon Sanso Corporation (Nippon Sanso PurityPlus® Gases)
Showa Denko K.K. (Specialty Fluorinated Gases)
Advanced Specialty Gases, Inc. (Ultra-High Purity Nitrogen)
Electronic Fluorocarbons LLC (EFC’s Ultra High-Purity Gases)
Yingde Gases Group (High-Purity Oxygen)
Hyosung Corporation (Specialty Hydrogen Gas)
SICGIL India Limited (Specialty Carbon Dioxide)
Weldstar
Iceblick Ltd. (Neon and Krypton Mixtures)
Matheson Gas (Ultra-Pure Argon)
Coregas Pty Ltd (Coregas LaserGAS)
The Linde Group (RENEW Specialty Gases)
Praxair Technology, Inc. (Praxair Grab 'n Go Oxygen)
Central Welding Supply (Ultra-High Purity Acetylene)
In May 2023, Messer, a specialist in industrial gases acquired the joint venture Messer Industries, making them the sole owner. This joint venture includes Messer's companies in North and South America, as well as Western Europe.
In April 2023, Linde announced its plans to expand the capacity of its on-site facility in Tangjeong, South Korea.
In January 2023, Taiyo Nippon Sanso Corporation revealed its establishment of a business site and a logistics site for specialty gases in Kumamoto, Japan. This move is intended to enhance its logistics activities for specialty gases in the Kyushu area.
Report Attributes | Details |
Market Size in 2023 | US$ 13.15 Billion |
Market Size by 2032 | US$ 25.21 Billion |
CAGR | CAGR of 8.62% From 2024 to 2032 |
Base Year | 2023 |
Forecast Period | 2024-2032 |
Historical Data | 2020-2022 |
Report Scope & Coverage | Market Size, Segments Analysis, Competitive Landscape, Regional Analysis, DROC & SWOT Analysis, Forecast Outlook |
Key Segments | • By Product (Noble Gases, Ultra-high Purity Gases, Carbon Gases, Halogen Gases, and Others) • By Application (Manufacturing, Healthcare, Electronics, Institutions, and Others) |
Regional Analysis/Coverage | North America (US, Canada, Mexico), Europe (Eastern Europe [Poland, Romania, Hungary, Turkey, Rest of Eastern Europe] Western Europe] Germany, France, UK, Italy, Spain, Netherlands, Switzerland, Austria, Rest of Western Europe]), Asia Pacific (China, India, Japan, South Korea, Vietnam, Singapore, Australia, Rest of Asia Pacific), Middle East & Africa (Middle East [UAE, Egypt, Saudi Arabia, Qatar, Rest of Middle East], Africa [Nigeria, South Africa, Rest of Africa], Latin America (Brazil, Argentina, Colombia Rest of Latin America) |
Company Profiles | Air Liquide, Norco Inc., Messer Group GmbH, Air Products and Chemicals, Inc., Taiyo Nippon Sanso Corp., Showa Denko K. K., MESA Specialty Gases & Equipment, Linde plc., Coregas, Weldstar |
Key Drivers | • Rising demand for specialty gases in various industries • The growing need for high-purity gases in research and development activities |
Market Opportunity | • Growing demand for eco-friendly specialty gases. • Expanding applications of specialty gases in emerging industries |
Ans. The Compound Annual Growth rate for the Specialty Gas Market over the forecast period is 8.62%.
Ans. The projected market size for the Specialty Gas Market is USD 25.21 billion by 2032.
Ans: The complex manufacturing processes and the need for specialized equipment contribute to the overall expenses, making it a challenge for some businesses to afford these gases.
Ans: Air Liquide, Taiyo Nippon Sanso Corp., Messer Group GmbH, Norco Inc., Linde plc., Showa Denko K. K., Air Products and Chemicals, Inc., MESA Specialty Gases & Equipment, Coregas, and Weldstar are the key players in the Specialty Gas Market.
Ans: Yes, you can ask for the customization as per your business requirement.
Table of Content
1. Introduction
1.1 Market Definition
1.2 Scope (Inclusion and Exclusions)
1.3 Research Assumptions
2. Executive Summary
2.1 Market Overview
2.2 Regional Synopsis
2.3 Competitive Summary
3. Research Methodology
3.1 Top-Down Approach
3.2 Bottom-up Approach
3.3. Data Validation
3.4 Primary Interviews
4. Market Dynamics Impact Analysis
3.1 Market Driving Factors Analysis
3.1.2 Drivers
3.1.2 Restraints
3.1.3 Opportunities
3.1.4 Challenges
3.2 PESTLE Analysis
3.3 Porter’s Five Forces Model
5. Statistical Insights and Trends Reporting
5.1 Production Capacity and Utilization, by Country, by Type, 2023
5.2 Feedstock Prices, by Country, by Type, 2023
5.3 Regulatory Impact, by l Country, by Type, 2023.
5.4 Environmental Metrics: Emissions Data, Waste Management Practices, and Sustainability Initiatives, by Region
5.5 Innovation and R&D, by Type, 2023
6. Competitive Landscape
6.1 List of Major Companies, By Region
6.2 Market Share Analysis, By Region
6.3 Product Benchmarking
6.3.1 Product specifications and features
6.3.2 Pricing
6.4 Strategic Initiatives
6.4.1 Marketing and promotional activities
6.4.2 Distribution and supply chain strategies
6.4.3 Expansion plans and new Product launches
6.4.4 Strategic partnerships and collaborations
6.5 Technological Advancements
6.6 Market Positioning and Branding
7. Specialty Gas Market Segmentation, by Product
7.1 Chapter Overview
7.2 Noble Gases
7.2.1 Noble Gases Market Trends Analysis (2020-2032)
7.2.2 Noble Gases Market Size Estimates and Forecasts to 2032 (USD Billion)
7.3 Ultra-high Purity Gases
7.3.1 Ultra-high Purity Gases Market Trends Analysis (2020-2032)
7.3.2 Ultra-high Purity Gases Market Size Estimates and Forecasts to 2032 (USD Billion)
7.4 Carbon Gases
7.4.1 Carbon Gases Market Trends Analysis (2020-2032)
7.4.2 Carbon Gases Market Size Estimates and Forecasts to 2032 (USD Billion)
7.5 Halogen Gases
7.5.1 Halogen Gases Market Trends Analysis (2020-2032)
7.5.2 Halogen Gases Market Size Estimates and Forecasts to 2032 (USD Billion)
7.6 Others
7.6.1 Others Market Trends Analysis (2020-2032)
7.6.2 Others Market Size Estimates and Forecasts to 2032 (USD Billion)
8. Specialty Gas Market Segmentation, by Application
8.1 Chapter Overview
8.2 Manufacturing
8.2.1 Manufacturing Market Trends Analysis (2020-2032)
8.2.2 Manufacturing Market Size Estimates and Forecasts to 2032 (USD Billion)
8.3 Healthcare
8.3. Healthcare Market Trends Analysis (2020-2032)
8.3.2 Healthcare Market Size Estimates and Forecasts to 2032 (USD Billion)
8.4 Electronics
8.4.1 Electronics Market Trends Analysis (2020-2032)
8.4.2 Electronics Market Size Estimates and Forecasts to 2032 (USD Billion)
8.5 Institutions
8.5.1 Institutions Market Trends Analysis (2020-2032)
8.5.2 Institutions Market Size Estimates and Forecasts to 2032 (USD Billion)
8.6 Others
8.6.1 Others Market Trends Analysis (2020-2032)
8.6.2 Others Market Size Estimates and Forecasts to 2032 (USD Billion)
9. Regional Analysis
9.1 Chapter Overview
9.2 North America
9.2.1 Trends Analysis
9.2.2 North America Specialty Gas Market Estimates and Forecasts, by Country (2020-2032) (USD Billion)
9.2.3 North America Specialty Gas Market Estimates and Forecasts, by Product (2020-2032) (USD Billion)
9.2.4 North America Specialty Gas Market Estimates and Forecasts, by Application (2020-2032) (USD Billion)
9.2.5 USA
9.2.5.1 USA Specialty Gas Market Estimates and Forecasts, by Product (2020-2032) (USD Billion)
9.2.5.2 USA Specialty Gas Market Estimates and Forecasts, by Application (2020-2032) (USD Billion)
9.2.6 Canada
9.2.6.1 Canada Specialty Gas Market Estimates and Forecasts, by Product (2020-2032) (USD Billion)
9.2.6.2 Canada Specialty Gas Market Estimates and Forecasts, by Application (2020-2032) (USD Billion)
9.2.7 Mexico
9.2.7.1 Mexico Specialty Gas Market Estimates and Forecasts, by Product (2020-2032) (USD Billion)
9.2.7.2 Mexico Specialty Gas Market Estimates and Forecasts, by Application (2020-2032) (USD Billion)
9.3 Europe
9.3.1 Eastern Europe
9.3.1.1 Trends Analysis
9.3.1.2 Eastern Europe Specialty Gas Market Estimates and Forecasts, by Country (2020-2032) (USD Billion)
9.3.1.3 Eastern Europe Specialty Gas Market Estimates and Forecasts, by Product (2020-2032) (USD Billion)
9.3.1.4 Eastern Europe Specialty Gas Market Estimates and Forecasts, by Application (2020-2032) (USD Billion)
9.3.1.5 Poland
9.3.1.5.1 Poland Specialty Gas Market Estimates and Forecasts, by Product (2020-2032) (USD Billion)
9.3.1.5.2 Poland Specialty Gas Market Estimates and Forecasts, by Application (2020-2032) (USD Billion)
9.3.1.6 Romania
9.3.1.6.1 Romania Specialty Gas Market Estimates and Forecasts, by Product (2020-2032) (USD Billion)
9.3.1.6.2 Romania Specialty Gas Market Estimates and Forecasts, by Application (2020-2032) (USD Billion)
9.3.1.7 Hungary
9.3.1.7.1 Hungary Specialty Gas Market Estimates and Forecasts, by Product (2020-2032) (USD Billion)
9.3.1.7.2 Hungary Specialty Gas Market Estimates and Forecasts, by Application (2020-2032) (USD Billion)
9.3.1.8 Turkey
9.3.1.8.1 Turkey Specialty Gas Market Estimates and Forecasts, by Product (2020-2032) (USD Billion)
9.3.1.8.2 Turkey Specialty Gas Market Estimates and Forecasts, by Application (2020-2032) (USD Billion)
9.3.1.9 Rest of Eastern Europe
9.3.1.9.1 Rest of Eastern Europe Specialty Gas Market Estimates and Forecasts, by Product (2020-2032) (USD Billion)
9.3.1.9.2 Rest of Eastern Europe Specialty Gas Market Estimates and Forecasts, by Application (2020-2032) (USD Billion)
9.3.2 Western Europe
9.3.2.1 Trends Analysis
9.3.2.2 Western Europe Specialty Gas Market Estimates and Forecasts, by Country (2020-2032) (USD Billion)
9.3.2.3 Western Europe Specialty Gas Market Estimates and Forecasts, by Product (2020-2032) (USD Billion)
9.3.2.4 Western Europe Specialty Gas Market Estimates and Forecasts, by Application (2020-2032) (USD Billion)
9.3.2.5 Germany
9.3.2.5.1 Germany Specialty Gas Market Estimates and Forecasts, by Product (2020-2032) (USD Billion)
9.3.2.5.2 Germany Specialty Gas Market Estimates and Forecasts, by Application (2020-2032) (USD Billion)
9.3.2.6 France
9.3.2.6.1 France Specialty Gas Market Estimates and Forecasts, by Product (2020-2032) (USD Billion)
9.3.2.6.2 France Specialty Gas Market Estimates and Forecasts, by Application (2020-2032) (USD Billion)
9.3.2.7 UK
9.3.2.7.1 UK Specialty Gas Market Estimates and Forecasts, by Product (2020-2032) (USD Billion)
9.3.2.7.2 UK Specialty Gas Market Estimates and Forecasts, by Application (2020-2032) (USD Billion)
9.3.2.8 Italy
9.3.2.8.1 Italy Specialty Gas Market Estimates and Forecasts, by Product (2020-2032) (USD Billion)
9.3.2.8.2 Italy Specialty Gas Market Estimates and Forecasts, by Application (2020-2032) (USD Billion)
9.3.2.9 Spain
9.3.2.9.1 Spain Specialty Gas Market Estimates and Forecasts, by Product (2020-2032) (USD Billion)
9.3.2.9.2 Spain Specialty Gas Market Estimates and Forecasts, by Application (2020-2032) (USD Billion)
9.3.2.10 Netherlands
9.3.2.10.1 Netherlands Specialty Gas Market Estimates and Forecasts, by Product (2020-2032) (USD Billion)
9.3.2.10.2 Netherlands Specialty Gas Market Estimates and Forecasts, by Application (2020-2032) (USD Billion)
9.3.2.11 Switzerland
9.3.2.11.1 Switzerland Specialty Gas Market Estimates and Forecasts, by Product (2020-2032) (USD Billion)
9.3.2.11.2 Switzerland Specialty Gas Market Estimates and Forecasts, by Application (2020-2032) (USD Billion)
9.3.2.12 Austria
9.3.2.12.1 Austria Specialty Gas Market Estimates and Forecasts, by Product (2020-2032) (USD Billion)
9.3.2.12.2 Austria Specialty Gas Market Estimates and Forecasts, by Application (2020-2032) (USD Billion)
9.3.2.13 Rest of Western Europe
9.3.2.13.1 Rest of Western Europe Specialty Gas Market Estimates and Forecasts, by Product (2020-2032) (USD Billion)
9.3.2.13.2 Rest of Western Europe Specialty Gas Market Estimates and Forecasts, by Application (2020-2032) (USD Billion)
9.4 Asia Pacific
9.4.1 Trends Analysis
9.4.2 Asia Pacific Specialty Gas Market Estimates and Forecasts, by Country (2020-2032) (USD Billion)
9.4.3 Asia Pacific Specialty Gas Market Estimates and Forecasts, by Product (2020-2032) (USD Billion)
9.4.4 Asia Pacific Specialty Gas Market Estimates and Forecasts, by Application (2020-2032) (USD Billion)
9.4.5 China
9.4.5.1 China Specialty Gas Market Estimates and Forecasts, by Product (2020-2032) (USD Billion)
9.4.5.2 China Specialty Gas Market Estimates and Forecasts, by Application (2020-2032) (USD Billion)
9.4.6 India
9.4.5.1 India Specialty Gas Market Estimates and Forecasts, by Product (2020-2032) (USD Billion)
9.4.5.2 India Specialty Gas Market Estimates and Forecasts, by Application (2020-2032) (USD Billion)
9.4.5 Japan
9.4.5.1 Japan Specialty Gas Market Estimates and Forecasts, by Product (2020-2032) (USD Billion)
9.4.5.2 Japan Specialty Gas Market Estimates and Forecasts, by Application (2020-2032) (USD Billion)
9.4.6 South Korea
9.4.6.1 South Korea Specialty Gas Market Estimates and Forecasts, by Product (2020-2032) (USD Billion)
9.4.6.2 South Korea Specialty Gas Market Estimates and Forecasts, by Application (2020-2032) (USD Billion)
9.4.7 Vietnam
9.4.7.1 Vietnam Specialty Gas Market Estimates and Forecasts, by Product (2020-2032) (USD Billion)
9.2.7.2 Vietnam Specialty Gas Market Estimates and Forecasts, by Application (2020-2032) (USD Billion)
9.4.8 Singapore
9.4.8.1 Singapore Specialty Gas Market Estimates and Forecasts, by Product (2020-2032) (USD Billion)
9.4.8.2 Singapore Specialty Gas Market Estimates and Forecasts, by Application (2020-2032) (USD Billion)
9.4.9 Australia
9.4.9.1 Australia Specialty Gas Market Estimates and Forecasts, by Product (2020-2032) (USD Billion)
9.4.9.2 Australia Specialty Gas Market Estimates and Forecasts, by Application (2020-2032) (USD Billion)
9.4.10 Rest of Asia Pacific
9.4.10.1 Rest of Asia Pacific Specialty Gas Market Estimates and Forecasts, by Product (2020-2032) (USD Billion)
9.4.10.2 Rest of Asia Pacific Specialty Gas Market Estimates and Forecasts, by Application (2020-2032) (USD Billion)
9.5 Middle East and Africa
9.5.1 Middle East
9.5.1.1 Trends Analysis
9.5.1.2 Middle East Specialty Gas Market Estimates and Forecasts, by Country (2020-2032) (USD Billion)
9.5.1.3 Middle East Specialty Gas Market Estimates and Forecasts, by Product (2020-2032) (USD Billion)
9.5.1.4 Middle East Specialty Gas Market Estimates and Forecasts, by Application (2020-2032) (USD Billion)
9.5.1.5 UAE
9.5.1.5.1 UAE Specialty Gas Market Estimates and Forecasts, by Product (2020-2032) (USD Billion)
9.5.1.5.2 UAE Specialty Gas Market Estimates and Forecasts, by Application (2020-2032) (USD Billion)
9.5.1.6 Egypt
9.5.1.6.1 Egypt Specialty Gas Market Estimates and Forecasts, by Product (2020-2032) (USD Billion)
9.5.1.6.2 Egypt Specialty Gas Market Estimates and Forecasts, by Application (2020-2032) (USD Billion)
9.5.1.7 Saudi Arabia
9.5.1.7.1 Saudi Arabia Specialty Gas Market Estimates and Forecasts, by Product (2020-2032) (USD Billion)
9.5.1.7.2 Saudi Arabia Specialty Gas Market Estimates and Forecasts, by Application (2020-2032) (USD Billion)
9.5.1.8 Qatar
9.5.1.8.1 Qatar Specialty Gas Market Estimates and Forecasts, by Product (2020-2032) (USD Billion)
9.5.1.8.2 Qatar Specialty Gas Market Estimates and Forecasts, by Application (2020-2032) (USD Billion)
9.5.1.9 Rest of Middle East
9.5.1.9.1 Rest of Middle East Specialty Gas Market Estimates and Forecasts, by Product (2020-2032) (USD Billion)
9.5.1.9.2 Rest of Middle East Specialty Gas Market Estimates and Forecasts, by Application (2020-2032) (USD Billion)
9.5.2 Africa
9.5.2.1 Trends Analysis
9.5.2.2 Africa Specialty Gas Market Estimates and Forecasts, by Country (2020-2032) (USD Billion)
9.5.2.3 Africa Specialty Gas Market Estimates and Forecasts, by Product (2020-2032) (USD Billion)
9.5.2.4 Africa Specialty Gas Market Estimates and Forecasts, by Application (2020-2032) (USD Billion)
9.5.2.5 South Africa
9.5.2.5.1 South Africa Specialty Gas Market Estimates and Forecasts, by Product (2020-2032) (USD Billion)
9.5.2.5.2 South Africa Specialty Gas Market Estimates and Forecasts, by Application (2020-2032) (USD Billion)
9.5.2.6 Nigeria
9.5.2.6.1 Nigeria Specialty Gas Market Estimates and Forecasts, by Product (2020-2032) (USD Billion)
9.5.2.6.2 Nigeria Specialty Gas Market Estimates and Forecasts, by Application (2020-2032) (USD Billion)
9.6 Latin America
9.6.1 Trends Analysis
9.6.2 Latin America Specialty Gas Market Estimates and Forecasts, by Country (2020-2032) (USD Billion)
9.6.3 Latin America Specialty Gas Market Estimates and Forecasts, by Product (2020-2032) (USD Billion)
9.6.4 Latin America Specialty Gas Market Estimates and Forecasts, by Application (2020-2032) (USD Billion)
9.6.5 Brazil
9.6.5.1 Brazil Specialty Gas Market Estimates and Forecasts, by Product (2020-2032) (USD Billion)
9.6.5.2 Brazil Specialty Gas Market Estimates and Forecasts, by Application (2020-2032) (USD Billion)
9.6.6 Argentina
9.6.6.1 Argentina Specialty Gas Market Estimates and Forecasts, by Product (2020-2032) (USD Billion)
9.6.6.2 Argentina Specialty Gas Market Estimates and Forecasts, by Application (2020-2032) (USD Billion)
9.6.7 Colombia
9.6.7.1 Colombia Specialty Gas Market Estimates and Forecasts, by Product (2020-2032) (USD Billion)
9.6.7.2 Colombia Specialty Gas Market Estimates and Forecasts, by Application (2020-2032) (USD Billion)
9.6.8 Rest of Latin America
9.6.8.1 Rest of Latin America Specialty Gas Market Estimates and Forecasts, by Product (2020-2032) (USD Billion)
9.6.8.2 Rest of Latin America Specialty Gas Market Estimates and Forecasts, by Application (2020-2032) (USD Billion)
10. Company Profiles
10.1 Air Liquide
10.1.1 Company Overview
10.1.2 Financial
10.1.3 Products/ Services Offered
10.1.4 SWOT Analysis
10.2 Norco Inc.
10.2.1 Company Overview
10.2.2 Financial
10.2.3 Products/ Services Offered
10.2.4 SWOT Analysis
10.3 Messer Group GmbH
10.3.1 Company Overview
10.3.2 Financial
10.3.3 Products/ Services Offered
10.3.4 SWOT Analysis
10.4 Air Products and Chemicals, Inc.
10.4.1 Company Overview
10.4.2 Financial
10.4.3 Products/ Services Offered
10.4.4 SWOT Analysis
10.5 Taiyo Nippon Sanso Corp.
10.5.1 Company Overview
10.5.2 Financial
10.5.3 Products/ Services Offered
10.5.4 SWOT Analysis
10.6 Showa Denko K. K.
10.6.1 Company Overview
10.6.2 Financial
10.6.3 Products/ Services Offered
10.6.4 SWOT Analysis
10.7 MESA Specialty Gases & Equipment
10.7.1 Company Overview
10.7.2 Financial
10.7.3 Products/ Services Offered
10.7.4 SWOT Analysis
10.8 Linde plc.
10.8.1 Company Overview
10.8.2 Financial
10.8.3 Products/ Services Offered
10.8.4 SWOT Analysis
10.9 Coregas
10.9.1 Company Overview
10.9.2 Financial
10.9.3 Products/ Services Offered
10.9.4 SWOT Analysis
10.10 Weldstar
10.10.1 Company Overview
10.10.2 Financial
10.10.3 Products/ Services Offered
10.10.4 SWOT Analysis
11. Use Cases and Best Practices
12. Conclusion
An accurate research report requires proper strategizing as well as implementation. There are multiple factors involved in the completion of good and accurate research report and selecting the best methodology to compete the research is the toughest part. Since the research reports we provide play a crucial role in any company’s decision-making process, therefore we at SNS Insider always believe that we should choose the best method which gives us results closer to reality. This allows us to reach at a stage wherein we can provide our clients best and accurate investment to output ratio.
Each report that we prepare takes a timeframe of 350-400 business hours for production. Starting from the selection of titles through a couple of in-depth brain storming session to the final QC process before uploading our titles on our website we dedicate around 350 working hours. The titles are selected based on their current market cap and the foreseen CAGR and growth.
The 5 steps process:
Step 1: Secondary Research:
Secondary Research or Desk Research is as the name suggests is a research process wherein, we collect data through the readily available information. In this process we use various paid and unpaid databases which our team has access to and gather data through the same. This includes examining of listed companies’ annual reports, Journals, SEC filling etc. Apart from this our team has access to various associations across the globe across different industries. Lastly, we have exchange relationships with various university as well as individual libraries.
Step 2: Primary Research
When we talk about primary research, it is a type of study in which the researchers collect relevant data samples directly, rather than relying on previously collected data. This type of research is focused on gaining content specific facts that can be sued to solve specific problems. Since the collected data is fresh and first hand therefore it makes the study more accurate and genuine.
We at SNS Insider have divided Primary Research into 2 parts.
Part 1 wherein we interview the KOLs of major players as well as the upcoming ones across various geographic regions. This allows us to have their view over the market scenario and acts as an important tool to come closer to the accurate market numbers. As many as 45 paid and unpaid primary interviews are taken from both the demand and supply side of the industry to make sure we land at an accurate judgement and analysis of the market.
This step involves the triangulation of data wherein our team analyses the interview transcripts, online survey responses and observation of on filed participants. The below mentioned chart should give a better understanding of the part 1 of the primary interview.
Part 2: In this part of primary research the data collected via secondary research and the part 1 of the primary research is validated with the interviews from individual consultants and subject matter experts.
Consultants are those set of people who have at least 12 years of experience and expertise within the industry whereas Subject Matter Experts are those with at least 15 years of experience behind their back within the same space. The data with the help of two main processes i.e., FGDs (Focused Group Discussions) and IDs (Individual Discussions). This gives us a 3rd party nonbiased primary view of the market scenario making it a more dependable one while collation of the data pointers.
Step 3: Data Bank Validation
Once all the information is collected via primary and secondary sources, we run that information for data validation. At our intelligence centre our research heads track a lot of information related to the market which includes the quarterly reports, the daily stock prices, and other relevant information. Our data bank server gets updated every fortnight and that is how the information which we collected using our primary and secondary information is revalidated in real time.
Step 4: QA/QC Process
After all the data collection and validation our team does a final level of quality check and quality assurance to get rid of any unwanted or undesired mistakes. This might include but not limited to getting rid of the any typos, duplication of numbers or missing of any important information. The people involved in this process include technical content writers, research heads and graphics people. Once this process is completed the title gets uploader on our platform for our clients to read it.
Step 5: Final QC/QA Process:
This is the last process and comes when the client has ordered the study. In this process a final QA/QC is done before the study is emailed to the client. Since we believe in giving our clients a good experience of our research studies, therefore, to make sure that we do not lack at our end in any way humanly possible we do a final round of quality check and then dispatch the study to the client.
Key Segments:
By Product
Noble Gases
Ultra-high Purity Gases
Carbon Gases
Halogen Gases
Others
By Application
Manufacturing
Healthcare
Electronics
Institutions
Others
Request for Segment Customization as per your Business Requirement: Segment Customization Request
Regional Coverage:
North America
US
Canada
Mexico
Europe
Eastern Europe
Poland
Romania
Hungary
Turkey
Rest of Eastern Europe
Western Europe
Germany
France
UK
Italy
Spain
Netherlands
Switzerland
Austria
Rest of Western Europe
Asia Pacific
China
India
Japan
South Korea
Vietnam
Singapore
Australia
Rest of Asia Pacific
Middle East & Africa
Middle East
UAE
Egypt
Saudi Arabia
Qatar
Rest of Middle East
Africa
Nigeria
South Africa
Rest of Africa
Latin America
Brazil
Argentina
Colombia
Rest of Latin America
Request for Country Level Research Report: Country Level Customization Request
Available Customization
With the given market data, SNS Insider offers customization as per the company’s specific needs. The following customization options are available for the report:
Product Analysis
Criss-Cross segment analysis (e.g. Product X Application)
Product Matrix which gives a detailed comparison of product portfolio of each company
Geographic Analysis
Additional countries in any of the regions
Company Information
Detailed analysis and profiling of additional market players (Up to five)
Recycled Carbon Fiber Market Size was valued at USD 163.3 million in 2023, and is expected to reach USD 464.02 billion by 2032, and grow at a CAGR of 11.7% over the forecast period 2024-2032.
The Liquid Ring Vacuum Pumps Market Size was valued at USD 1.21 billion in 2023 and is expected to reach USD 1.91 billion by 2032 and grow at a CAGR of 5.20% over the forecast period 2024-2032.
The Biofuel Additives Market Size was valued at USD 15.05 billion in 2023 and is expected to reach USD 32.39 billion by 2032 and grow at a CAGR of 8.89% over the forecast period 2024-2032.
The Concrete Floor Coating Market size was USD 4.75 Billion in 2023. It is estimated to hit USD 7.6 million by 2032 and grow at a CAGR of 5.4% by 2024-2032.
The Bio-Based Construction Polymer Market Size was valued at USD 14.29 Bn in 2023 and will reach $25.36 Bn by 2032 and grow at a CAGR of 6.58% by 2024-2032
The Unsaturated Polyester Resins Market Size was valued at USD 10.31 billion in 2022, and is expected to reach USD 16.81 billion by 2030, and grow at a CAGR of 6.3% over the forecast period 2023-2030.
Hi! Click one of our member below to chat on Phone