Specialty PACS Market Size & Overview:
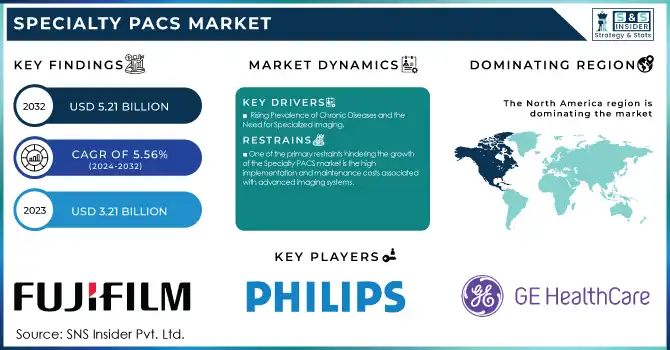
The Specialty PACS Market was valued at USD 3.21 billion in 2023 and is expected to reach USD 5.21 billion by 2032, growing at a CAGR of 5.56% over the forecast period 2024-2032.
Get more information on Specialty PACS Market - Request Sample Report
The Specialty PACS market is evolving rapidly, driven by technological advancements and the growing demand for specialized imaging solutions. A significant factor fueling this growth is integrating artificial intelligence into radiology workflows. Studies indicate that AI can improve diagnostic accuracy by 25–30% and reduce radiologists’ workload by up to 40%, as reported by the Journal of Digital Imaging. For instance, AI tools like Zebra Medical Vision’s breast cancer detection algorithms have demonstrated sensitivity rates exceeding 90%, comparable to experienced radiologists.
AI integration is particularly impactful in neuroradiology. Automated tools for brain tumor segmentation and radiomic feature extraction, like those included in PACS platforms developed by Novarad, have reduced analysis time by over 40% and improved detection precision. A study published found that AI-assisted PACS systems enhance the detection of neurological anomalies by 35%, underscoring their transformative role in specialized imaging.
The shift toward personalized and precision medicine also drives the adoption of specialty PACS. According to a report by the National Institutes of Health, tailored treatment approaches, particularly in cardiology and oncology, have surged by 50% over the last decade. Specialty PACS has facilitated this growth by enabling seamless integration of imaging data, such as echocardiograms and CT scans, with clinical decision-making tools. In cardiology-specific applications, PACS systems have reduced diagnostic delays by 30%, improving patient outcomes significantly.
Additionally, the need for specialized training in AI and PACS systems is evident. A survey conducted by the American College of Radiology revealed that 67% of radiologists are undergoing AI-related training, and 80% of radiology departments are planning to incorporate AI within the next two years. These training initiatives are supported by programs like ACR’s AI-Lab, which helps radiologists and healthcare professionals integrate AI tools into their workflows efficiently.
Specialty PACS Market Dynamics
Drivers
-
Rising Prevalence of Chronic Diseases and the Need for Specialized Imaging
The increasing prevalence of chronic diseases, including cardiovascular disorders, cancer, and neurological conditions, is a significant driver for the Specialty PACS market. According to the World Health Organization, chronic diseases account for nearly 70% of global deaths, creating a pressing need for advanced imaging systems to support early detection and targeted treatment. Specialty PACS solutions, tailored to specific medical domains, enable precise diagnostics by integrating modalities such as CT, MRI, and PET scans. For instance, oncology-specific PACS systems help oncologists track tumor progression and evaluate treatment efficacy, contributing to better patient outcomes.
-
Adoption of Cloud-Based PACS for Enhanced Efficiency and Accessibility
The growing preference for cloud-based PACS solutions is transforming how imaging data is stored, accessed, and shared. Offering scalability, cost efficiency, and remote accessibility, cloud PACS allows healthcare providers to streamline workflows and improve collaboration among multidisciplinary teams. A report by the Journal of Cloud Computing highlights that cloud PACS adoption is increasing by over 35% annually. These solutions are particularly beneficial in rural or underserved areas, where radiologists can remotely interpret images, providing timely and accurate diagnoses.
-
Technological Advancements and Interoperability Enhancements
Advances in imaging technologies, including 3D imaging, artificial intelligence, and teleradiology, are significantly boosting the specialty PACS market. These innovations enhance diagnostic accuracy and enable real-time consultations across locations, improving patient care. Moreover, the rising demand for interoperability ensures seamless integration of PACS with electronic health records and other hospital systems, promoting efficient data exchange. This capability is critical for multidisciplinary teams managing complex cases, as it facilitates better-coordinated and informed decision-making.
Restraints
-
One of the primary restraints hindering the growth of the Specialty PACS market is the high implementation and maintenance costs associated with advanced imaging systems.
Deploying specialty PACS involves significant expenses for hardware, software, and infrastructure upgrades, which can be challenging for smaller healthcare facilities or those in low-resource settings. Additionally, cloud-based PACS solutions, while offering scalability and remote accessibility, raise concerns over data security and compliance with stringent regulations such as HIPAA and GDPR. The potential risks of data breaches and unauthorized access to sensitive patient information deter some organizations from adopting these technologies. Furthermore, integrating PACS with existing healthcare IT systems, such as EHRs and HIS, can be complex and require significant customization efforts, adding to the overall cost and time required for deployment. These challenges underscore the need for affordable and secure solutions to drive wider adoption across diverse healthcare settings.
Specialty PACS Market Segmentation Analysis
By Type
Radiology PACS led the Specialty PACS market in 2023, accounting for 42.3% of the overall market share. This dominance is attributed to the broad utilization of radiology imaging in healthcare, as it is essential for diagnosing and monitoring a wide range of medical conditions, including cardiovascular diseases and cancer. The extensive use of imaging modalities such as X-rays, CT scans, and MRIs in hospitals and diagnostic centers contributes to the strong demand for radiology PACS. Technological advancements like AI integration to automate image analysis and improve diagnostic accuracy have further solidified radiology PACS' leadership in the market.
Ophthalmology PACS is anticipated to emerge as one of the fastest-growing segments within the Specialty PACS market by type. This growth is driven by the increasing prevalence of eye-related disorders, particularly age-related conditions like cataracts, glaucoma, and diabetic retinopathy, which require advanced imaging for diagnosis and treatment planning. The adoption of ophthalmology PACS is also facilitated by advancements in optical imaging technologies, such as Optical Coherence Tomography (OCT), fundus photography, and retinal imaging, which have become vital in detecting and monitoring eye diseases.
By Component
The software segment held the largest share in the Specialty PACS market in 2023, representing nearly 43.8% of the total market. PACS software plays a crucial role in managing, storing, and facilitating the sharing of medical imaging data efficiently across healthcare systems. The integration of advanced features like AI-based image processing, automated reporting, and data analytics has further driven the demand for PACS software. Additionally, software updates to comply with evolving healthcare regulations and interoperability standards continue to fuel its prominence in the market.
The services segment emerged as the fastest-growing area within the Specialty PACS market by component, with increasing demand for implementation, maintenance, and integration services. Healthcare providers are increasingly turning to specialized services to ensure smooth integration of PACS with existing systems such as EHRs and HIS. The adoption of cloud-based PACS models also boosts the demand for services related to data storage, security, and system management. The growing need for tailored solutions, especially in complex healthcare environments, is contributing to the rapid growth of the services segment.
Specialty PACS Market Regional Outlook
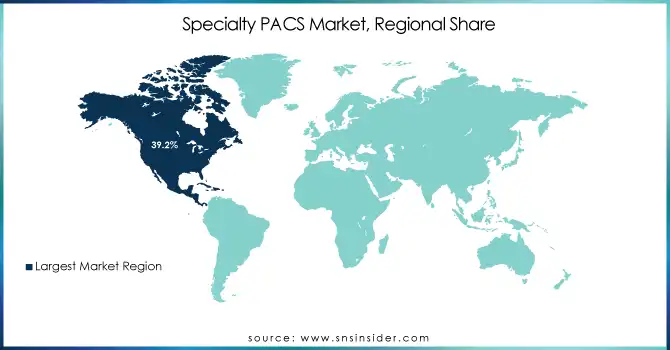
In 2023, North America dominated the Specialty PACS market, accounting for a 39.2% share due to advanced healthcare infrastructure, high adoption rates of digital health solutions, and the presence of key market players. The United States, in particular, has a well-established healthcare system with significant investments in medical imaging technology and cloud-based solutions. This has contributed to the widespread adoption of specialty PACS across various medical fields such as radiology, oncology, and ophthalmology. Moreover, the ongoing trend of integrating AI and machine learning in imaging systems has fueled the region’s market growth.
Europe also held a prominent share, driven by the increasing demand for advanced imaging technologies, the presence of leading healthcare providers, and rising investments in healthcare digitalization. Countries like Germany, the UK, and France are witnessing a surge in the adoption of specialized PACS for various medical disciplines, including cardiology, dermatology, and pathology. Additionally, the European Union's healthcare policies encouraging digital health adoption are further supporting market growth.
The Asia Pacific region is expected to exhibit rapid growth, driven by rising healthcare expenditure, growing aging populations, and the increasing prevalence of chronic diseases. Countries like China and India are seeing substantial investments in healthcare infrastructure and are adopting digital solutions to improve medical imaging capabilities. The rising demand for telemedicine and remote diagnostics in these regions is also propelling the growth of PACS systems, particularly in ophthalmology and dermatology.
Need any customization research on Specialty PACS Market - Enquiry Now
Key Players and Their Specialty PACS Products
-
IBM Corporation (Merge Healthcare Incorporated) - Merge PACS, Merge Eye Care PACS, Merge Oncology PACS
-
GE HealthCare - Centricity PACS, Centricity Universal Viewer, Centricity Imaging
-
Koninklijke Philips NV - IntelliSpace PACS, Philips Digital Pathology Solution, Philips Ophthalmology PACS
-
FUJIFILM Corporation - Synapse PACS, Synapse 3D, Synapse Mobility
-
Siemens AG - syngo PACS, syngo.via, syngo.plaza
-
Intelerad - IntelePACS, InteleRad RIS, InteleViewer
-
RamSoft - PowerPACS, PowerServer PACS, PowerWeb
-
eRAD - eRAD PACS, eRAD Cloud PACS, eRAD RIS
-
Oracle - Oracle PACS Solutions, Oracle Healthcare Imaging Suite
-
Sectra AB - Sectra PACS, Sectra Enterprise Imaging, Sectra Breast Imaging PACS
-
McKesson Corporation - McKesson Radiology PACS, McKesson Cardiology PACS
-
Agfa Healthcare - Enterprise Imaging PACS, Agfa Xero PACS
-
Carestream Health - Carestream Vue PACS, Carestream Radiology PACS
-
Novarad - NovaPACS, NovaCloud PACS
-
INFINITT North America - INFINITT PACS, INFINITT Cloud PACS
-
Topcon Corporation - Topcon 3D OCT-1 PACS, Topcon Eye Imaging Solutions
-
Sonomed Escalon - Sonomed PACS, Sonomed Retina Imaging Solutions
-
Canon USA, Inc. - Canon Digital Radiography PACS, Canon Ophthalmology Imaging PACS
-
Visbion - Visbion PACS, Visbion Diagnostic Imaging Solutions
-
EyePACS, LLC - EyePACS Diabetic Retinopathy PACS, EyePACS Telemedicine Solutions
Recent Developments
In Sept 2024, FUJIFILM Irvine Scientific expanded its product portfolio and services by aligning its commercial operations with FUJIFILM Wako Chemicals U.S.A., effective October 1, 2024. The collaboration will involve promoting products from FUJIFILM Wako Chemicals' Lab Automation, Lab Chemicals, and LAL Group divisions directly to customers in the U.S. and Europe.
In June 2024, Skyway Capital Markets, LLC advised Aqua ChemPacs, LLC on its acquisition by Solenis, a global leader in specialty chemicals. This strategic sale enhances Solenis' portfolio in the specialty chemicals sector.
| Report Attributes | Details |
|---|---|
| Market Size in 2023 | USD 3.21 Billion |
| Market Size by 2032 | USD 5.21 Billion |
| CAGR | CAGR of 5.56% From 2024 to 2032 |
| Base Year | 2023 |
| Forecast Period | 2024-2032 |
| Historical Data | 2020-2022 |
| Report Scope & Coverage | Market Size, Segments Analysis, Competitive Landscape, Regional Analysis, DROC & SWOT Analysis, Forecast Outlook |
| Key Segments | • By Type (Radiology PACS, Cardiology PACS, Pathology PACS, Ophthalmology PACS, Orthopedics PACS, Oncology PACS, Dermatology PACS, Neurology PACS, Endoscopy PACS, Women’s Health PACS, Other specialty PACS) • By Component (Hardware, Software, Services) • By Deployment Model (On-premise specialty PACS, Web/Cloud-based specialty PACS) • By End-User (Hospitals, Ambulatory Surgery Centers & Clinics, Diagnostic Imaging Centers, Other End Users) |
| Regional Analysis/Coverage | North America (US, Canada, Mexico), Europe (Eastern Europe [Poland, Romania, Hungary, Turkey, Rest of Eastern Europe] Western Europe] Germany, France, UK, Italy, Spain, Netherlands, Switzerland, Austria, Rest of Western Europe]), Asia Pacific (China, India, Japan, South Korea, Vietnam, Singapore, Australia, Rest of Asia Pacific), Middle East & Africa (Middle East [UAE, Egypt, Saudi Arabia, Qatar, Rest of Middle East], Africa [Nigeria, South Africa, Rest of Africa], Latin America (Brazil, Argentina, Colombia, Rest of Latin America) |
| Company Profiles | IBM Corporation (Merge Healthcare Incorporated), GE HealthCare, Koninklijke Philips NV, FUJIFILM Corporation, Siemens AG, Intelerad, RamSoft, eRAD, Oracle, Sectra AB, McKesson Corporation, Agfa Healthcare, Carestream Health, Novarad, INFINITT North America, Topcon Corporation, Sonomed Escalon, Canon USA, Inc., Visbion, EyePACS, LLC. |
| Key Drivers | • Rising Prevalence of Chronic Diseases and the Need for Specialized Imaging • Adoption of Cloud-Based PACS for Enhanced Efficiency and Accessibility • Technological Advancements and Interoperability Enhancements |
| Restraints | • One of the primary restraints hindering the growth of the Specialty PACS market is the high implementation and maintenance costs associated with advanced imaging systems. |
Frequently Asked Questions
Ans: The forecast period of the Specialty PACS Market is 2024-2032.
Ans: The major players are Canon Inc., Siemens Healthineers, McKesson Corporation, INC Escalon Medical Corp., Intelerad Medical Systems, Eye PACS, LLC, IBM Corporation, Sectra AB, INFINITT Healthcare Co. Ltd., Topcon Corporation, Novarad, Onex Corporation (Carestream Health), Philips Healthcare, Agfa Healthcare, Visbion.
-
Technological Advancements
-
The increasing adoption of cloud-based PACS offers advantages like scalability and affordability, potentially expanding the market reach
Ans: The market is grown at a CAGR of 5.56% From 2024 to 2032.
Ans: The market is expected to reach USD 5.21 billion by 2032.
Get in Touch
