Sustainable Packaging Market Report Scope & Overview:
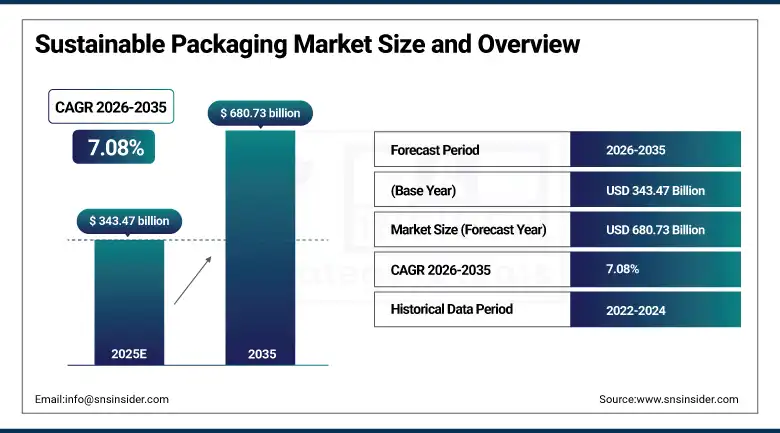
Sustainable Packaging Market was valued at USD 343.47 billion in 2025 and is expected to reach USD 680.73 billion by 2035, growing at a CAGR of 7.08% from 2026–2035.
The sustainable packaging market is experiencing substantial growth owing to increasing awareness about environmental issues, stringent laws regarding the use of single-use plastics, commitment towards ESG by global companies, and growing adoption of sustainable packaging solutions in the consumer industry. Several policies are being followed around the world to promote the use of recyclable, reusable, biodegradable, and compostable packaging solutions to minimize plastic pollution and CO2 emissions. There has been an increasing trend for using sustainable packaging solutions like recyclable paper and paperboard, bioplastics, reusable packaging, and high recycled glass and metal packaging in the consumer sectors such as food & beverages, personal care, pharmaceuticals, and e-commerce. Innovations in bio-materials, circular packaging, and advanced recycling processes are expected to boost growth in the market until 2035.
The sustainable packaging market's 7.08% CAGR from 2026 to 2035 reflects the extraordinary alignment between regulatory mandates from EU Packaging and Packaging Waste Regulation, the U.S. Plastics Pact, and Extended Producer Responsibility legislation across 60-plus national markets, the corporate sustainability commitment ecosystem where over 400 major brand owners have made specific sustainable packaging pledges, and the material technology innovation pipeline that is progressively closing the performance and cost gaps between sustainable alternatives and the conventional packaging formats they must replace to achieve commercial adoption at scale.
Market Size and Forecast
-
Market Size in 2026E: USD 367.79 Billion
-
Market Size by 2035: USD 680.73 Billion
-
CAGR (2026-2035): 7.08%
-
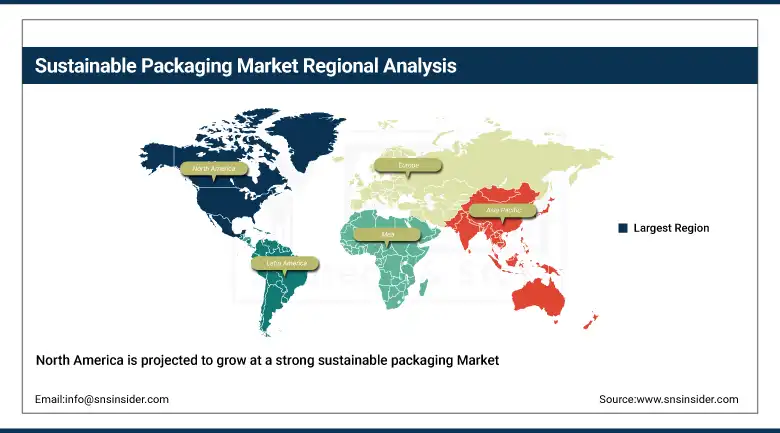
Fastest Growing Region: Asia Pacific
-
Largest Region: Europe
To Get more information On Sustainable Packaging Market - Request Free Sample Report
Sustainable Packaging Market Trends
-
Accelerating innovation in high-barrier paper packaging is enabling paper-based materials to achieve improved moisture and oxygen resistance for sustainable food packaging applications previously dominated by plastic packaging solutions.
-
Rising use of post-consumer recycled plastics is boosting the demand for recycled PET, HDPE, and PP packaging that meet the food-grade criteria due to increasing efforts towards sustainability compliance by brands.
-
Fast growth in e-commerce is creating a need for sustainable shipping packaging such as recyclable corrugated packaging, biodegradable cushioning, paper-based void fill, and lightweight sustainable packaging solutions.
-
Rising investment in reusable and refillable packaging systems is supporting circular economy initiatives across premium consumer goods, food service, personal care, and household product industries worldwide.
-
Increasing regulatory standardization for compostable packaging is improving adoption of certified biodegradable packaging materials across food service, fresh produce, and institutional catering applications in global markets.
The U.S. Sustainable Packaging Market Size Outlook
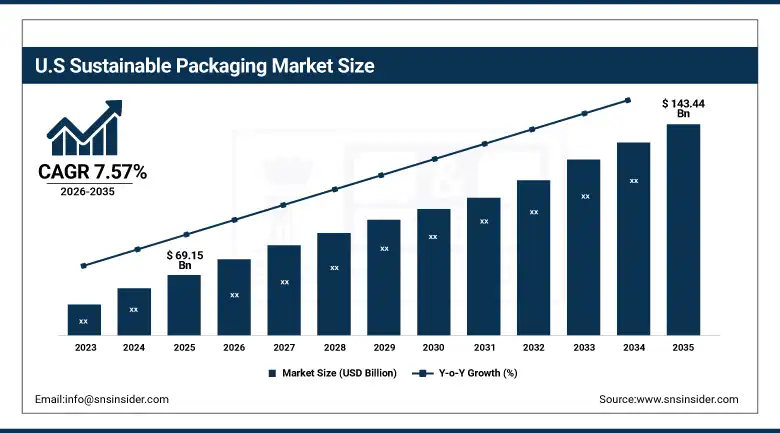
The U.S. Sustainable Packaging Market was valued at approximately USD 69.15 billion in 2025 and is expected to reach approximately USD 143.44 billion by 2035, growing at a CAGR of 7.57% during 2026–2035.
The United States represents the world's most commercially dynamic sustainable packaging market, driven by the most extensive brand owner sustainability commitment ecosystem of any national market, California's market-defining packaging extended producer responsibility legislation that is compelling national packaging standard adoption among CPG brands seeking single national compliance specification, the U.S. Plastics Pact's brand commitments targeting 100% reusable, recyclable, or compostable packaging by 2025, and a USD 40 million government grant programme supporting biodegradable packaging manufacturing expansion. The US sustainable packaging market also gains strength due to the considerable presence of consumer demand, evidenced by the consistent results in surveys indicating the willingness of the consumers to pay extra for sustainably packaged goods within the fast-growing age group of consumers.
In March 2025, Amcor introduced its AmFiber performance paper packaging platform designed for flexible food packaging applications with fully recyclable high-barrier paper pouch structures. November 2024 saw Sealed Air extend its Bubble Wrap line of paper-based packaging materials with the introduction of new recyclable cushioning products for use in e-commerce packaging. These innovations point to the increasing trend towards innovation in the United States sustainable packaging industry, which is seeing large packaging companies invest increasingly in recyclable, paper-based, and environmentally friendly packaging products. Increasing demand for environmentally friendly packaging solutions in food, retail, and e-commerce industries will drive further innovation in sustainable packaging until 2035.
Sustainable Packaging Market Segment Analysis
-
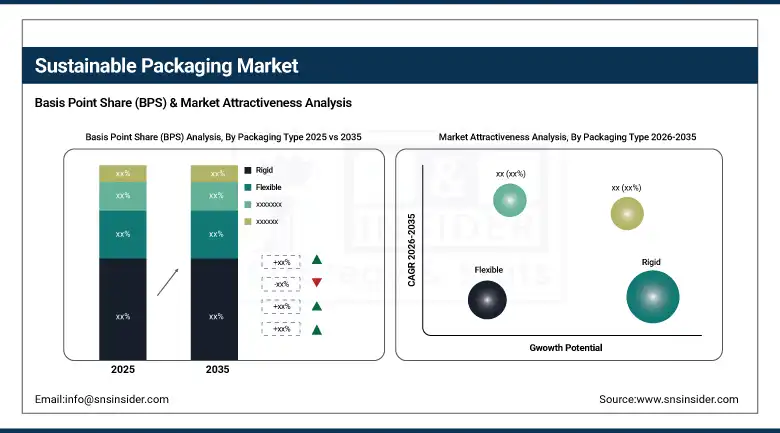
By Packaging Type, rigid packaging dominated with approximately 54.62% of revenues in 2025; flexible packaging is the fastest-growing type at approximately 8.43% CAGR from 2026 to 2035.
-
By Material, paper and paperboard dominated with approximately 45% of revenues in 2025; bioplastics are the fastest-growing material.
-
By Process, recycled packaging dominated with approximately 41.36% in 2025 and is simultaneously the fastest-growing process at approximately 9.27% CAGR from 2026 to 2035.
-
By End-User Industry, food and beverages dominated with approximately 34.58% in 2025; e-commerce is the fastest-growing end-user at approximately 9.64% CAGR.
By packaging type, rigid segment dominates, flexible segment expected to grow fastest
Rigid packaging led the way in the market for sustainable packaging in 2025 accounting for about 54.62% share of total revenue owing to the adoption of sustainable packaging options such as glass bottles, aluminum cans, paperboard cartons, and recycled PET bottles. This type of packaging is favored due to its well-established recycling system, higher recycled content, durability, and circular economy system. Glass, metal, and corrugated packaging solutions have remained very popular owing to their high recyclability and sustainability.
The flexible packaging segment is expected to have the highest CAGR during 2026–2035 owing to growing innovations in the realm of recyclable, compostable, and mono-material flexible packaging options. Innovations in sustainable paper pouches, recyclable polyethylene films, and bio-based barrier coatings are fueling adoption in applications including food, bakery, frozen foods, and e-commerce packaging.
By material, paper and paperboard dominates, Bioplastics expected to grow fastest
The paper & paperboard category accounted for the highest market share of around 45% in the sustainable packaging market in 2025 due to its recyclability, use of renewable sources, biodegradability, and preference among consumers as sustainable packaging material. The applications of corrugated boxes, paper bags, cartons, and molded fiber packaging are numerous in the food and beverage, retail, and e-commerce industries due to their recyclability. The developments in PFAS-free barrier coatings and sustainable fiber technology are expected to accelerate the demand for paper-based packaging products globally.
Bioplastics are projected to witness the fastest growth through 2035 driven by rising demand for compostable and bio-based packaging solutions across food service, fresh produce, and takeaway packaging applications. Growing adoption of PLA, PHA, and starch-based biopolymers is supporting expansion of certified compostable packaging worldwide..
By process, recycled packaging dominates and is expected to grow fastest
Recycled content packaging retained the dominant process position with approximately 41.36% of the sustainable packaging market in 2025 and is simultaneously the fastest-growing process at approximately 9.27% CAGR through 2035. Recycled packaging encompasses post-consumer recycled PET bottles for beverages and personal care, recycled HDPE for detergent and household product containers, recycled aluminium cans achieving 70%+ recycled content, recycled glass bottles, and the massive corrugated and carton board packaging market where 70 to 85% recycled fibre content is the commercial baseline.
The convergence of recycled content, reusability, and degradability within single product programmes is creating the most comprehensive circular economy packaging solutions that command the highest consumer sustainability perception premiums in the sustainable packaging market.
By end-user, food and beverages dominates, e-commerce expected to grow fastest
Food and beverages dominated the sustainable packaging market in 2025 with approximately 34.58% revenue share due to the massive global demand for sustainable food containers, beverage bottles, cartons, pouches, and takeaway packaging solutions. The growing regulatory push towards reducing the use of single-use plastics, along with the sustainability efforts of leading food and beverage companies, has led to rapid development of recyclable, biodegradable, and reusable packaging solutions. There is a marked trend towards using recycled material and light-weighting packaging solutions among companies.
E-commerce is expected to record the highest CAGR until 2035 due to the fast-paced growth of e-commerce and direct-to-consumer delivery services. The rising demand for reusable corrugated boxes, biodegradable mailers, paper cushioning materials, and right-sizing packaging is largely contributing to the adoption of sustainable packaging in logistics and shipping.
Regional Analysis
|
Region |
Major Country |
Share within Region, 2025 (%) |
|---|---|---|
|
North America |
United States |
81% |
|
Europe |
Germany |
28% |
|
Asia Pacific |
China |
43% |
|
Middle East & Africa |
UAE |
27% |
|
Latin America |
Brazil |
43% |
North America Sustainable Packaging Market Insights
North America is projected to grow at a strong sustainable packaging CAGR through 2035, anchored by the United States at approximately 81% of North American revenues at USD 69.15 billion in 2025. U.S. market leadership is driven by the most extensive brand owner sustainability commitment ecosystem, California's packaging EPR legislation compelling national specification alignment, and the most active sustainable packaging innovation investment ecosystem encompassing Amcor, Sealed Air, Berry Global, and hundreds of packaging material technology companies. The U.S. food and beverage industry's compliance with the FDA's PFAS packaging ban and adoption of the U.S. Plastics Pact standards is creating the most comprehensive domestic sustainable packaging transition of any national market outside Europe.
Get Customized Report as per Your Business Requirement - Enquiry Now
Europe Sustainable Packaging Market Insights
Europe dominated the global sustainable packaging market in 2025 with approximately 35.07% of revenues, reflecting the world's most comprehensive and legally binding sustainable packaging regulatory framework encompassing the EU Packaging and Packaging Waste Regulation, the Single-Use Plastics Directive, the European Green Deal's circular economy targets, and national Extended Producer Responsibility schemes in Germany, France, and the UK that collectively create the most powerful compliance-driven sustainable packaging market development environment globally. The EU's mandatory minimum recycled content thresholds for plastic packaging, recyclability requirements for all packaging placed on the European market by 2030, and extended producer responsibility fees incentivising packaging design simplification are systematically driving every packaging supplier serving European markets toward sustainable specification compliance.
Asia Pacific Sustainable Packaging Market Insights
Asia Pacific is the fastest-growing regional sustainable packaging market at approximately 8.37% CAGR through 2035, driven by rising packaging waste regulation enforcement in China, India, Japan, and South Korea, government-backed Extended Producer Responsibility framework rollouts, and investments in sustainable material manufacturing capacity across the region. China's domestic recyclable packaging mandate programme and India's Plastic Waste Management Rules creating EPR obligations for packaging producers are creating the regulatory foundation for rapid sustainable packaging adoption across the world's two most populous markets.
Latin America and MEA Sustainable Packaging Market Insights
Latin America and MEA are growing sustainable packaging markets driven by expanding consumer awareness, corporate ESG programme adoption by multinational brands operating across these regions, and progressive packaging waste regulation development. Brazil leads Latin American sustainable packaging revenues at approximately 43% through its large food and consumer goods manufacturing sector and progressive plastic waste reduction policies. MEA adoption is driven by the UAE and Saudi Arabia's sustainability-focused Vision 2030 commitments influencing corporate packaging specification standards across the Gulf region's sophisticated retail sector.
Market Dynamics
Regulatory mandates and ESG commitments accelerating sustainable packaging adoption globally
The factors that mainly influence the growth of the sustainable packaging market include the close interconnection between regulatory policies, ESG commitments from corporations, and increasing consumer interest in environmentally friendly packaging. Governments of different countries are introducing strict regulations that focus on reducing plastic waste, increasing the recyclability rate, and using sustainable materials, especially in Europe and North America. Besides, leading consumer goods manufacturers are increasingly adopting sustainable packaging options that include recyclable, reusable, biodegradable, and compostable types of packaging. An increase in consumer awareness and their readiness to support environmentally friendly products also boosts the adoption of sustainable packaging practices among retailers and manufacturers. Moreover, innovations in the field of paper flexible packaging, recyclable protective packaging, bio-based materials, and circular packaging systems drive the sustainable packaging adoption process.
Restraints: High material costs and recycling infrastructure limitations restraining sustainable packaging adoption
The sustainable packaging market is faced by several challenges, including the increased costs associated with the use of sustainable materials compared to conventional packaging materials based on petroleum. For instance, bioplastics, recyclable paper packaging, and post-consumer recycled plastics have some premium pricing, thus increasing the cost of packaging for businesses. Another issue affecting the sustainability of packaging is the performance concerns of some sustainable packaging materials in terms of moisture barrier, oxygen barrier, durability, and shelf-life maintenance, especially when it comes to food and beverage packaging. Besides, there are no adequate recycling facilities in most developing countries, which poses difficulties in recovering end-of-life materials for reuse. Lastly, recycling regulations, contamination in recycling streams, and lack of quality recycled materials pose challenges to sustainable packaging producers.
Opportunities: Advanced recycling technologies and reusable packaging systems creating major growth opportunities
Sustainable packaging market can benefit from tremendous growth prospects with the increase in developments in chemical recycling technologies, recyclable flexible packaging, and reusable packaging services. Modern recycling processes like pyrolysis, solvolysis, and gasification have made possible to create high-quality recycled plastic that can be used in the creation of food contact packaging, promoting the concept of a circular economy. Moreover, innovations in recyclable mono-material films, compostable pouches, and high barrier paper packaging will help in making a shift towards sustainable flexible packaging in the food and consumer goods industry. Finally, there will be significant growth prospects for sustainable packaging due to the increase in investments in the reusable packaging ecosystem for food delivery, retail, and e-commerce markets.
Recent Developments:
-
2026: Amcor plc expanded its recyclable AmFiber packaging portfolio with advanced paper-based flexible packaging solutions designed for food and beverage applications requiring high-barrier protection and reduced plastic usage.
-
2026: Mondi plc launched a new range of sustainable e-commerce packaging products incorporating recycled paper materials and lightweight protective designs to support circular packaging initiatives across retail logistics.
-
2026: Berry Global Group Inc. introduced next-generation post-consumer recycled plastic packaging solutions aimed at increasing recycled content utilization across personal care, healthcare, and food packaging applications globally.
Sustainable Packaging key players are:
-
Amcor plc
-
Sealed Air Corporation
-
Smurfit Kappa Group plc
-
Mondi plc
-
DS Smith plc
-
Berry Global Group Inc.
-
Tetra Pak International SA
-
Huhtamaki Oyj
-
Graphic Packaging Holding Company
-
International Paper Company
-
Sonoco Products Company
-
WestRock Company
-
Ardagh Group SA
-
Ball Corporation
-
Crown Holdings Inc.
-
BASF SE
-
NatureWorks LLC
-
Novamont SpA
-
TotalEnergies Corbion BV
-
Carbios SA
Sustainable Packaging Market Report Scope:
| Report Attributes | Details |
|---|---|
| Market Size in 2025 | USD 343.47 Billion |
| Market Size by 2035 | USD 680.73 Billion |
| CAGR | CAGR of 7.08% From 2026 to 2035 |
| Base Year | 2025 |
| Forecast Period | 2026-2035 |
| Historical Data | 2022-2024 |
| Report Scope & Coverage | Market Size, Segments Analysis, Competitive Landscape, Regional Analysis, DROC & SWOT Analysis, Forecast Outlook |
| Key Segments | • By Packaging Type (Rigid, Flexible) • By Material (Paper and Paperboard, Bioplastics, Glass, Metal, Others) • By Process (Recyclable Packaging, Reusable Packaging, Degradable Packaging) • By End-User Industry (Food and Beverages, Healthcare and Pharmaceuticals, E-commerce, Consumer Goods, Others) |
| Regional Analysis/Coverage | North America (US, Canada), Europe (Germany, UK, France, Italy, Spain, Russia, Poland, Rest of Europe), Asia Pacific (China, India, Japan, South Korea, Australia, ASEAN Countries, Rest of Asia Pacific), Middle East & Africa (UAE, Saudi Arabia, Qatar, South Africa, Rest of Middle East & Africa), Latin America (Brazil, Argentina, Mexico, Colombia, Rest of Latin America). |
| Company Profiles | Amcor plc, Sealed Air Corporation, Smurfit Kappa Group plc, Mondi plc, DS Smith plc, Berry Global Group Inc., Tetra Pak International SA, Huhtamaki Oyj, Graphic Packaging Holding Company, International Paper Company, Sonoco Products Company, WestRock Company, Ardagh Group SA, Ball Corporation, Crown Holdings Inc., BASF SE (Packaging Polymers), NatureWorks LLC, Novamont SpA, TotalEnergies Corbion BV, Carbios SA |
Frequently Asked Questions
Europe dominated with approximately 35.07% of global revenues in 2025.
Recycled Content Packaging dominated with approximately 41.36% in 2025 and is simultaneously the fastest-growing process at approximately 9.27% CAGR through 2035.
Rigid packaging dominated with approximately 54.62% of revenues in 2025.
The unprecedented alignment of legally binding EU packaging regulation imposing mandatory recyclability and recycled content requirements, consumer preference for visibly sustainable packaging sustainable material technology closing performance gaps against conventional packaging alternatives.
The Sustainable Packaging Market was valued at USD 343.47 billion in 2025.
The Sustainable Packaging Market is expected to grow at a CAGR of 7.08% from 2026 to 2035.
Get in Touch
