Tea Tree Oil Market Report Scope & Overview:
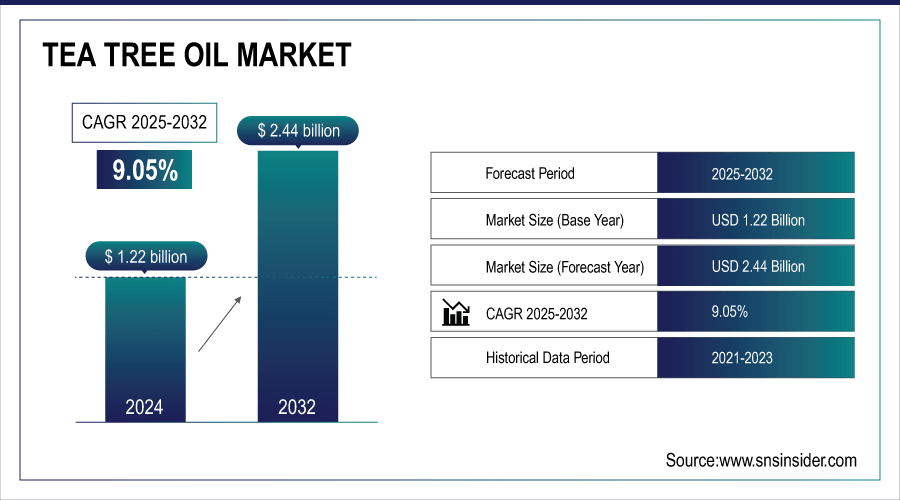
The Tea Tree Oil Market Size was valued at USD 1.22 Billion in 2025 and is expected to reach USD 2.44 Billion by 2033, growing at a CAGR of 9.05% over the forecast period of 2026-2033.
The Tea Tree Oil Market is witnessing robust growth due to rising demand in personal care, cosmetics, and therapeutic applications. Increasing consumer preference for natural and organic products, coupled with expanding distribution channels like retail and direct sales, is driving global adoption. Innovation and sustainable sourcing further support market expansion.
The Australian government implements a levy on tea tree oil distilled and sold domestically, which supports industry development and research funding. Additionally, an export charge is applied to tea tree oil exported from Australia, contributing to the industry's growth and global competitiveness.
To Get More Information On Tea Tree Oil Market - Request Free Sample Report
Key Tea Tree Oil Market Trends
-
Rising consumer preference for natural and organic personal care products is boosting demand for tea tree oil.
-
Increasing use in cosmetics and skincare formulations due to its antimicrobial and anti-inflammatory properties.
-
Growing application in pharmaceuticals and medicinal products, including ointments, creams, and antiseptics.
-
Expansion of direct-to-consumer and e-commerce channels, enhancing accessibility and market reach.
-
Rising demand for sustainable and ethically sourced tea tree oil from environmentally conscious consumers.
-
Increasing adoption in spa and aromatherapy treatments for relaxation and wellness benefits.
-
Development of value-added derivatives and blended formulations to cater to premium segments.
-
Government and industry initiatives supporting research, production efficiency, and export promotion.
Tea Tree Oil Market Growth Drivers
-
Rising Consumer Demand for Natural and Organic Products Drives the Market Growth
The global shift toward natural, organic, and chemical-free products is a key driver for tea tree oil. Consumers increasingly prefer plant-based ingredients in personal care, cosmetics, and therapeutic products, seeking safer alternatives to synthetic chemicals. Tea tree oil’s proven antibacterial, antifungal, and anti-inflammatory properties make it a highly desirable ingredient in skincare, haircare, and wellness products. This trend is amplified by growing awareness of environmental sustainability and eco-conscious lifestyles. Governments and industry associations, particularly in Australia, support research and sustainable cultivation to ensure a high-quality supply.
In November 2023, the Australian government provided AUD 2 million in grants to support R&D in tea tree oil production, focusing on sustainability, yield improvement, and quality standards.
Tea Tree Oil Market Restraints
-
Supply Chain Challenges and Price Volatility May Hamper the Market Growth
The tea tree oil industry is currently grappling with supply chain interruptions and fluctuating raw material prices. Elements like unfavourable weather, restricted production areas, and global trade risks can affect a reliable supply of tea tree oil. These are problems that the industry faces, but play into price-to-volatility through the supply chain," she said, mentioning the idea of supply-chain issues to be a roundabout way producers can't make a living and consumers can't afford the product. The use of a single source (principally Australia) of high-quality TTO also compounds the exposure to supply chain risk.
A severe drought hit Australia in 2022, resulting in a sharp decrease in tea tree oil output, which in turn resulted in a price increase and a shortage of supply in the global markets. This demonstrated the susceptibility of the tea tree oil industry to weather-related impacts and the importance of agro-diversification and sustainable agronomy.
Tea Tree Oil Market Opportunities
-
Regulatory Hurdles and Quality Standards Creates an Opportunity for the Market
The tea tree oil industry faces potential threats from stringent regulatory requirements and varying quality standards across different regions. Differences in regulations concerning product labelling, certification, and safety standards can create barriers to market entry and expansion. Non-compliance with these regulations can lead to product recalls, legal issues, and damage to brand reputation. Additionally, the lack of standardized quality benchmarks can result in inconsistent product offerings, affecting consumer trust and market growth.
In 2022, a batch of tea tree oil exported from Australia was rejected by European Union authorities due to non-compliance with EU cosmetic ingredient regulations. The incident led to financial losses for the exporter and highlighted the importance of adhering to international quality and safety standards.
Tea Tree Oil Market Segment Highlights:
-
By Application: Dominating – Personal Care & Cosmetics 52.3%, Fastest-growing – Pharmaceuticals and Medicinal Formulations 28.7%
-
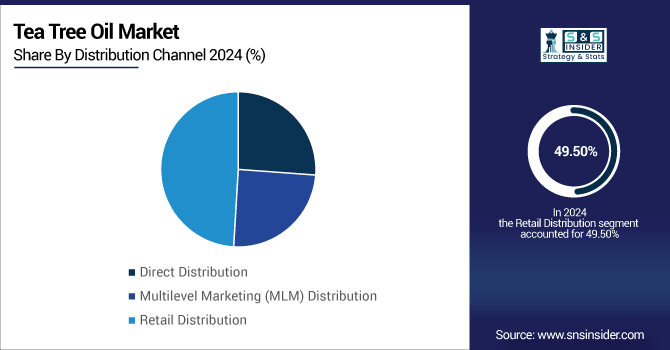
By Distribution Channel: Dominating – Retail Distribution 49.5%, Fastest-growing – Direct Distribution 26.4%
Tea Tree Oil Market Segmentation Analysis:
By Distribution Channel
Retail Distribution holds the largest share at 49.5%, as consumers continue to purchase tea tree oil through pharmacies, supermarkets, and specialty stores for convenience and trust in product authenticity. The Direct Distribution segment is the fastest-growing, with 26.4%, fueled by rising e-commerce adoption, online marketplaces, and company-owned websites offering direct-to-consumer sales. Increasing digital literacy and preference for doorstep delivery have accelerated this channel, especially in urban and semi-urban regions.
By Application
The Personal Care & Cosmetics segment dominates the market with a 52.3% share, driven by the increasing consumer preference for natural ingredients in skincare, haircare, and wellness products. Tea tree oil’s antimicrobial and anti-inflammatory properties make it a key ingredient in face creams, shampoos, and cosmetic formulations. The Pharmaceuticals and Medicinal Formulations segment is the fastest-growing at 28.7%, supported by rising demand for natural remedies, antiseptics, and therapeutic applications in topical ointments and creams. The growth is further reinforced by expanding awareness of herbal and plant-based medicinal solutions.
Tea Tree Oil Market Regional Analysis
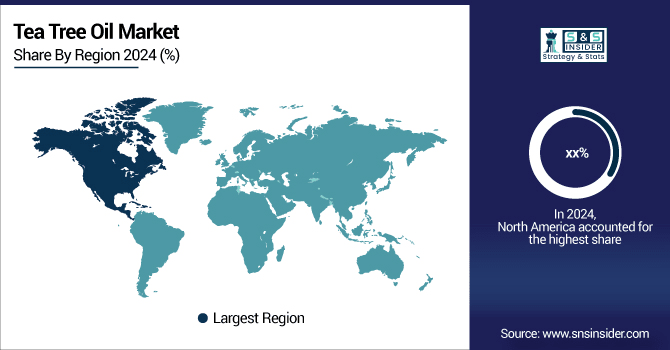
North America Tea Tree Oil Market Insights
North America is a key market for tea tree oil due to rising consumer preference for natural and therapeutic wellness solutions, coupled with increasing interest in aromatherapy and alternative medicine. The U.S. and Canada have strong retail and online channels, making tea tree oil widely accessible. Awareness campaigns about the benefits of natural ingredients in combating skin issues and hair care problems have strengthened demand. Consumers also show willingness to pay a premium for high-quality, certified organic oils.
In 2024, a leading U.S.-based producer expanded its distribution network to include major e-commerce platforms and wellness stores, increasing tea tree oil availability and meeting growing online demand.
Get Customized Report as Per Your Business Requirement - Enquiry Now
U.S. Tea Tree Oil Market Insights
The U.S. market is characterized by high adoption of natural and organic products in personal care, health, and wellness segments. Consumers are increasingly turning to plant-based oils like tea tree for skincare, haircare, and medicinal purposes. Retail and online channels, including direct-to-consumer sales, have facilitated widespread availability. Regulatory oversight ensures quality and safety, which encourages consumer confidence. The presence of leading global brands also drives innovation and product diversification.
In 2024, a U.S. tea tree oil company invested in a new extraction and packaging plant in California, aimed at expanding production capacity and meeting growing demand for certified organic and sustainable oils.
Asia Pacific Tea Tree Oil Market Insights
The Asia-Pacific region is the fastest-growing market for tea tree oil, driven by increasing urbanization, rising disposable incomes, and growing health consciousness. Countries like India, China, and Southeast Asia are witnessing a surge in demand for natural personal care, cosmetics, and therapeutic oils. Local production, combined with imports, supports the growing market. Social media and wellness trends have also contributed to awareness about tea tree oil’s benefits for skin and hair.
In 2023, a tea tree oil manufacturer opened a new processing facility in Vietnam to cater to rising regional demand, improve supply chain efficiency, and provide high-quality oils for both domestic and export markets.
Europe Tea Tree Oil Market Analysis
Europe held the largest Tea Tree Oil market share at around 42% in 2024. Baby Formula leads the Tea Tree Oil industry in Europe, with stringent regulations, high levels of parental awareness, and good entitlement to healthcare. Those countries with higher birth rates and maturing healthcare systems, such as France, the U.K., and the Netherlands, show relatively consistent demand. Quality, traceability, and organic certifications are central to consumer demands.
In 2023, the EU tightened its labeling and marketing rules for baby formula to make them more transparent and prevent misleading claims. Manufacturers are now required by law to offer specific nutrient data, which has encouraged consumer confidence and better food choices.
Latin America (LATAM) and Middle East & Africa (MEA) Tea Tree Oil Market Insights
The LATAM and MEA countries are potential markets for tea tree oil owing to increasing consumer preferences towards natural personal care, cosmetic, and wellness products. A growing disposable income, urbanization, and growing awareness of herbal and plant-based medicine are some of factors accelerating the market growth. In LATAM, some countries including Brazil and Mexico are experiencing greater uptake of organic skincare products and in MEA, awareness continues to grow in the UAE, South Africa and Saudi Arabia with the spread of health and wellness trends. More and more distribution systems, such as retail and internet distribution channels, are being built, and the market space is better. They are also supported by local farming projects and international partners that share their commitment to quality and sustainability.
Tea Tree Oil Market Competitive Landscape
doTERRA
doTERRA is a leading global essential oils company, offering a wide range of pure and certified therapeutic-grade oils, including tea tree oil, with a focus on personal care, wellness, and aromatherapy products. The company emphasizes sustainable sourcing and quality certification.
-
In 2023, doTERRA expanded its tea tree oil extraction facility in Australia, increasing production capacity to meet growing global demand for natural and organic personal care products.
Young Living
Young Living specializes in essential oils and wellness products, including tea tree oil, with a strong emphasis on plant-based formulations and ethical sourcing practices. The company invests heavily in farm-to-bottle traceability and quality control.
-
In 2024, Young Living launched a new line of organic tea tree oil skincare products in North America and Europe, targeting the rising demand for natural and sustainable personal care solutions.
NOW Foods
NOW Foods offers a diverse portfolio of essential oils and wellness products, including tea tree oil, catering to personal care and therapeutic applications. The company focuses on affordability and quality assurance.
-
In 2023, NOW Foods introduced a new certified organic tea tree oil line in the U.S., addressing growing consumer preference for natural, chemical-free products.
Plant Therapy
Plant Therapy provides a wide range of essential oils, including tea tree oil, emphasizing purity, affordability, and sustainable sourcing. The company invests in third-party testing and educational campaigns for consumers.
-
In 2024, Plant Therapy opened a new distribution center in Europe to streamline supply chains and expand the availability of tea tree oil across European markets.
Tea Tree Oil Market Key Players
Some of the Tea Tree Oil Companies
-
doTERRA
-
Young Living
-
NOW Foods
-
Eden’s Garden
-
Starwest Botanicals
-
Aromatherapy Associates
-
Desert Essence
-
Melaleuca, Inc.
-
Nature’s Oil
-
Australian Bodycare
-
Majestic Pure
-
Aura Cacia
-
Florihana
-
Biotiva
-
Sun Essential Oils
-
Healing Solutions
-
Mountain Rose Herbs
-
ArtNaturals
| Report Attributes | Details |
|---|---|
| Market Size in 2025 | USD1.22 Billion |
| Market Size by 2033 | USD 2.44 Billion |
| CAGR | CAGR of9.05% From 2026 to 2033 |
| Base Year | 2025 |
| Forecast Period | 2026-2033 |
| Historical Data | 2022-2024 |
| Report Scope & Coverage | Market Size, Segments Analysis, Competitive Landscape, Regional Analysis, DROC & SWOT Analysis, Forecast Outlook |
| Key Segments | • By Application (Personal Care & Cosmetics, Spa & Relaxation, Pharmaceuticals and Medicinal Formulations, and Others) • By Distribution Channel (Direct Distribution, Multilevel Marketing (MLM) Distribution, and Retail Distribution) |
| Regional Analysis/Coverage | North America (US, Canada), Europe (Germany, France, UK, Italy, Spain, Poland, Russsia, Rest of Europe), Asia Pacific (China, India, Japan, South Korea, Australia,ASEAN Countries, Rest of Asia Pacific), Middle East & Africa (UAE, Saudi Arabia, Qatar, Egypt, South Africa, Rest of Middle East & Africa), Latin America (Brazil, Argentina, Mexico, Colombia Rest of Latin America) |
| Company Profiles | doTERRA, Young Living, NOW Foods, Plant Therapy, Eden’s Garden, Starwest Botanicals, Aromatherapy Associates, Desert Essence, Tea Tree Therapy, Melaleuca, Inc., Nature’s Oil, Australian Bodycare, Majestic Pure, Aura Cacia, Florihana, Biotiva, Sun Essential Oils, Healing Solutions, Mountain Rose Herbs, ArtNaturals |
Frequently Asked Questions
Dominant regions are Australia, Europe, and North America, while emerging markets include Asia-Pacific, Latin America, and the Middle East & Africa.
The industry faces challenges from supply chain volatility, price fluctuations, regulatory compliance, and inconsistent quality standards.
Key players include doTERRA, Young Living, NOW Foods, Plant Therapy, Eden’s Garden, Melaleuca, Inc., Starwest Botanicals, and Aura Cacia.
Consumers increasingly favor sustainable, chemical-free, multi-functional, and ethically sourced personal care and wellness products, influencing tea tree oil adoption.
The growing preference for natural and organic products is driving Tea Tree Oil demand in personal care, cosmetics, and therapeutic applications globally.
Get in Touch
