Temperature Sensor Market Report Scope & Overview:
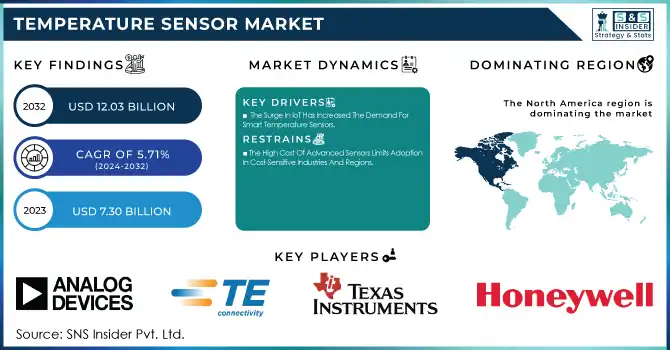
The Temperature Sensor Market Size was valued at USD 7.30 Billion in 2023 and is expected to reach USD 12.03 Billion by 2032 and grow at a CAGR of 5.71% over the forecast period 2024-2032.
Get more information on Temperature Sensor Market - Request Sample Report
The Temperature Sensor Market is going through tremendous growth and transformation, driven by technological advances, changing government policies, and new applications. In 2023 and 2024, countries all around the world are focusing on putting into place advanced temperature monitoring systems to increase the efficiency of industries, healthcare services, and environmental monitoring. Stringent regulations implemented by governments in regions such as North America and Europe ensure better energy management, which makes a good climate for temperature sensor adoption. For example, the European Green Deal has energy efficiency at its core, indirectly driving up the demand for precise temperature sensors in HVAC systems. The U.S. Department of Energy also implemented regulations in 2023 to make industries more energy-efficient, thus increasing the use of advanced temperature monitoring systems.
The latest technologies, including AI and IoT, have improved sensor accuracy and enabled real-time data analytics. For instance, smart temperature sensors integrated with IoT platforms enable predictive maintenance in industrial settings, thus reducing downtime by up to 25%. The health care sector has experienced some incredible innovation, such as wearable temperature sensors that are capable of continuously monitoring patient vitals. This is a development that is gaining momentum in 2024. The automotive industry is also adopting temperature sensors to enhance the performance and safety of electric vehicles.
Ultra-thin temperature sensors for wearable devices were launched in 2023, opening up new opportunities in healthcare and consumer electronics. Advancements in wireless connectivity have also fueled the demand for remote monitoring solutions. Applications in agriculture, where temperature sensors are used for precision farming, are some of the emerging applications that highlight the versatility of the Temperature Sensor Market. Smart city initiatives in India and China are further driving the adoption of these sensors for environmental monitoring and energy management.
The future is packed with tremendous prospects in smart home automation, self-driving cars, and industrial applications of IoT, which mainly depend on proper temperature measurement. As the world is investing increasingly in R&D, the Temperature Sensor Market will be directed toward various sectors, leading to innovation, sustainability, and efficiency. This rapidly changing environment assures that the market will be one of the most integral parts of global technological development.
Market Dynamics
Key Drivers:
-
The Surge In IoT Has Increased The Demand For Smart Temperature Sensors.
The increasing use of IoT and smart devices has been a crucial factor driving the Temperature Sensor Market. In 2023, the global count of IoT-connected devices exceeded 15 billion, with temperature sensors guaranteeing optimal operation of the devices. Smart home applications, for instance, rely on automated thermostats that depend on these sensors to ensure ideal indoor conditions.
Likewise, IIoT requires temperature sensors to monitor the equipment, which helps avoid overheating and consequently decreases downtime by 30%. This is additionally promoted by governmental programs like India's "Smart Cities Mission," which includes temperature sensors in city infrastructure. These sensors help save energy and enhance the user experience. Consequently, these are widely utilized.
-
Advances In Healthcare Across The World Have Increased The Demand For Temperature Sensors Of The Medical Grade.
Temperature sensors have become integral in healthcare with its accuracy needed to be a prerequisite. In 2023, wearable health monitoring devices, such as smartwatches with integrated sensors, accounted for a large share of consumer health products. These devices track body temperature to detect early signs of illness, such as fever. Advanced temperature sensors in clinical settings ensure accurate readings in applications like patient monitoring systems and diagnostic equipment.
The COVID-19 pandemic has brought to the forefront the need for thermal imaging solutions, which depend on temperature sensors for mass fever detection. Government funding for health infrastructure upgrades, especially in developing nations, is further driving market growth. As healthcare technologies advance rapidly, the reliance on temperature sensors for real-time, accurate data is only going to increase.
Restrain:
-
The High Cost Of Advanced Sensors Limits Adoption In Cost-Sensitive Industries And Regions.
Despite the growing applications of temperature sensors, their high costs remain a significant barrier. Advanced technologies, such as infrared and fiber optic sensors, are expensive due to their complex manufacturing processes and integration requirements. Although these sensors are very accurate and long-lasting, they are not as accessible to small-scale industries and low-income regions. For instance, in Africa, the budget for industrial automation is usually too limited to allow widespread use of high-end temperature sensors.
Moreover, the maintenance and calibration of these sensors increase the overall cost, which makes them less attractive for cost-sensitive applications. Government subsidies and initiatives to encourage industrial automation are attempting to ease this problem, but the gap in adoption rates across regions remains. Manufacturers are now working on creating cost-effective solutions to bridge this gap and expand their market reach.
Segment Analysis
By Output
Analog segment was the leading segment in 2023, accounting for 65% of the market share. They are used where the system or industrial setup is old and integration has to be as simple as possible, with minimal processing. Analog sensors are preferred due to their simplicity and real-time response, thus being highly relevant in applications like HVAC systems and industrial process monitoring.
The digital segment is expected to grow at the fastest CAGR of 6.16% during the forecast period from 2024 to 2032. Digital sensors have improved features, such as noise immunity, precise data transmission, and compatibility with modern IoT ecosystems.
Recent developments in digital sensors have allowed integration with AI-driven platforms, offering predictive maintenance and analytics capabilities. For instance, industries leveraging smart manufacturing technologies are increasingly adopting digital temperature sensors to optimize production efficiency. This growing preference for digital sensors reflects a shift toward automated and interconnected systems, particularly in regions embracing Industry 4.0.
By Connectivity
In 2023, the wired segment dominated the market with 64% market share, as this is more reliable and used almost everywhere in the industrial and commercial sectors. The applications that demand consistent performance will require the sensors to be wired, such as manufacturing process control and data centers, where the real-time monitoring of temperature is critical.
Wireless segment is projected to grow at the fastest CAGR of 6.24% during the forecast period between 2024 and 2032. Due to the constant improvements in connectivity technology such as Bluetooth and Zigbee, wireless temperature sensors are taking precedence in the fields of smart homes, health monitoring devices, and remote surveillance applications.
Since they can be adapted anywhere and have cheaper installation costs than other types and compatibility with most IoT frameworks, modern infrastructure employs wireless temperature sensors. For example, wireless sensors in agricultural IoT solutions allow real-time monitoring of environmental conditions to enhance crop yield and resource efficiency. The widespread adoption of wireless connectivity also aligns with the trend toward smart and automated systems globally.
Regional Analysis
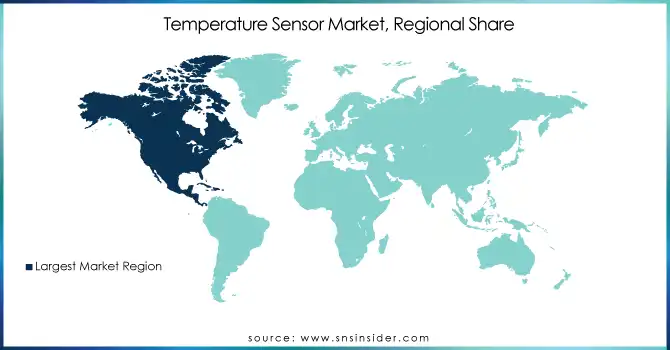
North America took the largest share of 38% in 2023 with lead technological progress, a strong industrial setup, and the government's drive to be energy efficient. More for the region to pay attention to smart manufacturing and IoT applications makes the demand for temperature sensors higher. For instance, the U.S. government investments into advanced manufacturing technologies under Manufacturing USA have had a great acceleration in integrating the temperature sensors into an industrial process.
Asia Pacific will be the fastest-growing region, and its growth is expected to be the highest during the forecast period from 2024 to 2032, with a CAGR of 6.23%. Rapid urbanization, smart city projects, and increasing investments in industrial automation contribute to growth factors. With such government initiatives such as "Made in China 2025" in China and "Digital India" in India, this is the major region where adoption of temperature sensors takes place. Other applications range from automotive and healthcare to consumer electronics. Increasingly, there are manufacturing facilities emerging in this region, while conserving energy, which propels this market forward.
Get Customized Report as per your Business Requirement - Request For Customized Report
Key Players
Some of the Major Players in the Temperature Sensor Market Are
-
Honeywell International (Thermistors, Infrared Sensors)
-
Siemens AG (RTDs, Thermocouples)
-
Texas Instruments (Temperature Sensors, ICs)
-
TE Connectivity (Thermistors, Digital Sensors)
-
Amphenol Corporation (RTDs, Thermocouples)
-
Analog Devices (Integrated Sensors, Wireless Sensors)
-
STMicroelectronics (Digital Sensors, Microcontrollers)
-
Infineon Technologies (Thermistors, Microchips)
-
Fluke Corporation (Infrared Sensors, Thermal Cameras)
-
Omega Engineering (RTDs, Thermistors)
-
Sensirion AG (Digital Sensors, IoT Solutions)
-
Microchip Technology (Integrated Circuits, Digital Sensors)
-
ABB Group (RTDs, Process Sensors)
-
NXP Semiconductors (Analog Sensors, IoT Sensors)
-
Panasonic Corporation (Thermistors, Infrared Sensors)
-
Emerson Electric (RTDs, Wireless Sensors)
-
Dwyer Instruments (Analog Sensors, IoT Sensors)
-
WIKA Instruments (Thermocouples, Digital Sensors)
-
Yokogawa Electric (Process Sensors, RTDs)
-
Renesas Electronics (Integrated Sensors, IoT Sensors)
Major Suppliers (Components, Technologies)
-
Dow Inc. (Silicon Materials, Coatings)
-
BASF SE (Polymer Materials, Thermal Insulators)
-
Dupont (Substrates, Adhesives)
-
3M Company (Conductive Tapes, Thermal Solutions)
-
Solvay Group (Specialty Polymers, High-Performance Materials)
-
Rogers Corporation (Thermal Management Materials, Laminates)
-
Heraeus Holding (Platinum Components, Precious Metals)
-
Henkel AG (Adhesives, Conductive Inks)
-
Mitsui Chemicals (Polyimides, High-Performance Resins)
-
Evonik Industries (Silicone Rubber, Specialty Plastics)
Recent Trends
-
February 2024: Infineon Technologies AG, based in Munich, launched the CoolMOS S7T family of metal-oxide-semiconductor field-effect transistors (MOSFETs) for solid-state relay applications that require high performance and reliability. The CoolMOS S7T MOSFET features a built-in temperature sensor to enhance the precision of junction temperature detection in power electronics uses.
-
January 2025: TDK partners with Texas Instruments to introduce the i3 Micro Module, the first sensor module globally featuring integrated edge AI and wireless mesh connectivity.
| Report Attributes | Details |
|---|---|
|
Market Size in 2023 |
US$ 7.30 Billion |
|
Market Size by 2032 |
US$ 12.03 BillionA |
|
CAGR |
CAGR of 5.71% From 2024 to 2032 |
|
Base Year |
2023 |
|
Forecast Period |
2024-2032 |
|
Historical Data |
2020-2022 |
|
Report Scope & Coverage |
Market Size, Segments Analysis, Competitive Landscape, Regional Analysis, DROC & SWOT Analysis, Forecast Outlook |
|
Key Segments |
• By Product Type (Contact Temperature Sensors, Non-Contact Temperature Sensors), |
|
Regional Analysis/Coverage |
North America (US, Canada, Mexico), Europe (Eastern Europe [Poland, Romania, Hungary, Turkey, Rest of Eastern Europe] Western Europe] Germany, France, UK, Italy, Spain, Netherlands, Switzerland, Austria, Rest of Western Europe]), Asia Pacific (China, India, Japan, South Korea, Vietnam, Singapore, Australia, Rest of Asia Pacific), Middle East & Africa (Middle East [UAE, Egypt, Saudi Arabia, Qatar, Rest of Middle East], Africa [Nigeria, South Africa, Rest of Africa], Latin America (Brazil, Argentina, Colombia, Rest of Latin America) |
|
Company Profiles |
Honeywell International, Siemens AAG, Texas Instruments, TE Connectivity, Amphenol Corporation, Analog Devices, STMicroelectronics, Infineon Technologies, Fluke Corporation, Omega Engineering, Sensirion AG, Microchip Technology, ABB Group, NXP Semiconductors, Panasonic Corporation, Emerson Electric, Dwyer Instruments, WIKA Instruments, Yokogawa Electric, Renesas Electronics. |
|
Key Drivers |
• The Surge In IoT Has Increased The Demand For Smart Temperature Sensors. |
|
Restraints |
• The High Cost Of Advanced Sensors Limits Adoption In Cost-Sensitive Industries And Regions. |
Frequently Asked Questions
Ans: The Temperature Sensor Market is expected to grow at a CAGR of 5.71% during 2024-2032.
Ans: Temperature Sensor Market size was USD 7.30 Billion in 2023 and is expected to USD 12.03 Billion by 2032.
Ans: The major growth factors of the Temperature Sensor Market are Rising Adoption of IoT and Smart Devices and Growing Demand from the Healthcare and Medical Devices Market.
Ans: The wired segment dominated the Temperature Sensor Market.
Ans: North America dominated the Temperature Sensor Market in 2023.
Get in Touch
