Terminal Automation Market Scope & Overview:
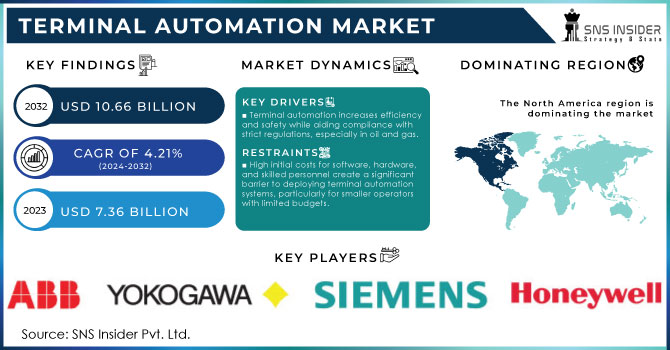
The Terminal Automation Market size was estimated at USD 7.36 billion in 2023 and is expected to reach USD 10.66 billion by 2032 at a CAGR of 4.21% during the forecast period of 2024-2032.
To get more information on Terminal Automation Market - Request Free Sample Report
The Terminal Automation Market has been witnessing significant growth owing to the growing demand for efficient and reliable operations, specifically in the oil and gas, bulk-handling, and chemical industries. Terminal automation involves the use of advanced technologies such as Supervisory Control and Data Acquisition (SCADA), Distributed Control Systems (DCS), and Programmable Logic Controllers (PLC) to monitor and regulate vital processes such as product handling, distribution, and safety. With automation, organizations can minimize instances of human errors, reduce operational costs, and enhance safety measures. Furthermore, the increase in the demand for energy and the ongoing trend of digital transformation across industries contribute to the growth of the terminal automation market. The modern-day terminal automation market is also driven by the demand for increased safety and the presence of stringent environmental regulations. As such, there is an increasing need among industries to adopt terminal automation as a measure to improve their operational efficiency as well as to comply with the requirements of the regulatory bodies.
Devices and systems based on cloud computing technology are gradually taking over the Terminal Automation Market, as they provide real-time monitoring and analytics, leading to informed decision-making. With the rising number of cyber threats, there is also an increasing need to focus on Cybersecurity, which protects the vital infrastructure from possible attacks. In the contemporary market, IoT-enabled devices that facilitate increased automation and provide abundant data and information are increasingly being implemented. To cater to these requirements, providers in the market design and develop highly modular and attuned solutions that are also easily scalable.
MARKET DYNAMICS
DRIVERS
-
Terminal automation enhances operational efficiency and safety by reducing human error, streamlining processes, and helping industries comply with stringent safety regulations, especially in sectors like oil and gas.
Terminal automation significantly boosts operational efficiency and safety by minimizing human error, optimizing processes, and aiding compliance with stringent safety regulations, particularly in sectors like oil and gas. Automation systems, such as those used in terminals, integrate advanced technologies to control and monitor various processes, reducing the reliance on manual operations. This reduction in human intervention lowers the risk of mistakes that can lead to operational disruptions, safety incidents, or costly errors. For instance, automated systems can precisely control the flow of materials, manage inventory, and monitor equipment performance in real-time, ensuring that processes run smoothly and efficiently.
In high-stakes industries like oil and gas, where safety is paramount, terminal automation plays a crucial role in adhering to rigorous safety standards. Automated systems can detect and respond to potential hazards faster than human operators, providing early warnings and activating safety protocols to prevent accidents. Additionally, automation helps in maintaining compliance with regulatory requirements by providing accurate and reliable data for reporting and audits. This ensures that operations not only meet safety standards but also improve overall efficiency by streamlining workflows and reducing operational downtime. In essence, terminal automation enhances both the safety and efficiency of operations, making it an indispensable tool in modern industrial settings.
-
Technological advancements like IoT, AI, cloud computing, and blockchain are driving terminal automation by enabling real-time monitoring, predictive maintenance, and enhanced security and transparency in operations.
Technological advancements such as the Internet of Things (IoT), Artificial Intelligence (AI), cloud computing, and blockchain are revolutionizing terminal automation by significantly enhancing operational efficiency, security, and transparency. IoT facilitates real-time monitoring by connecting sensors and devices across terminals, allowing for continuous tracking of cargo, equipment status, and environmental conditions. This connectivity enables immediate data collection and analysis, which is critical for optimizing workflows and quickly addressing issues. AI further leverages this data by providing predictive maintenance capabilities; algorithms can analyze historical data to forecast potential equipment failures before they occur, minimizing downtime and reducing repair costs. Cloud computing supports these advancements by offering scalable storage and computing power, enabling seamless integration and analysis of large volumes of data from various sources. It also facilitates remote access and management, improving operational flexibility and responsiveness. Meanwhile, blockchain technology enhances security and transparency by providing a decentralized ledger for recording transactions. This immutable record ensures that all changes are traceable and verifiable, thereby reducing the risk of fraud and errors in terminal operations. Together, these technologies not only streamline processes but also create a more resilient and transparent operational environment, driving efficiency and reliability in terminal automation.
RESTRAIN
-
High initial costs for software, hardware, and skilled personnel make deploying terminal automation systems a significant barrier, especially for smaller operators with limited budgets.
Deploying terminal automation systems presents a substantial challenge primarily due to the high initial costs associated with software, hardware, and skilled personnel. The investment required for these systems includes purchasing sophisticated automation software, and advanced hardware, and integrating these components seamlessly. Additionally, recruiting and retaining highly skilled personnel who can manage and maintain these systems adds to the financial burden. For smaller operators with limited budgets, these costs can be prohibitive, creating a significant barrier to entry. The substantial upfront investment required can strain financial resources, making it difficult for smaller firms to compete with larger players who have the capital to absorb these costs. As a result, the financial implications of adopting terminal automation systems can hinder the growth and competitiveness of smaller operators within the industry.
KEY MARKET SEGMENTATION
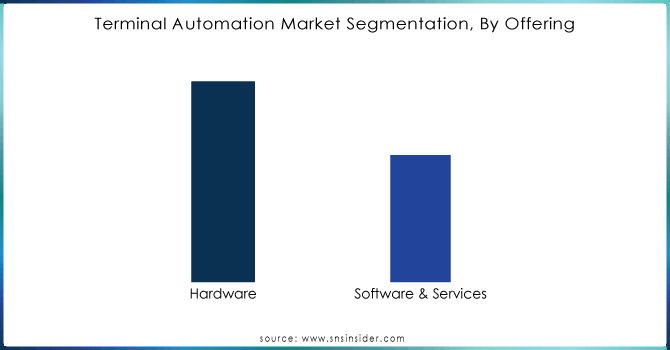
By Offering
The Hardware segment dominated the market share by over 62.14% in 2023, this is because hardware components like controllers, sensors, actuators, and other field devices are essential for automating terminal operations. The demand for reliable and advanced hardware solutions is high, especially in industries like oil & gas, chemicals, and utilities, where operational efficiency and safety are crucial.
Need any customization research on Terminal Automation Market - Enquiry Now
By Vertical
The Oil & Gas segment dominated the market share over 28.08% in 2023. This dominance is due to the critical need for efficient and safe handling, monitoring, and distribution of petroleum products. Terminal automation solutions help ensure operational safety, optimize storage and distribution, and comply with stringent industry regulations. The high volume of global oil & gas production and transport further contributes to the demand for automation in this vertical.
REGIONAL ANALYSES
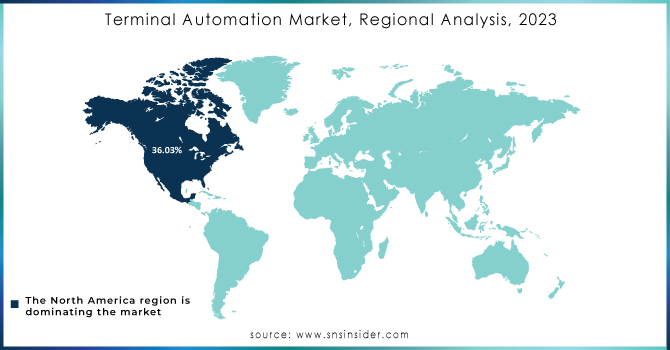
North America led the market share of over 36.03% in 2023, primarily due to the region's advanced infrastructure, high adoption of automation technologies, and significant investments in oil & gas, and chemicals industries. The presence of key players, along with stringent regulations for safety and efficiency, has further solidified North America's leading position in this market.
Asia Pacific region is the fastest-growing in the Terminal Automation Market. This growth is driven by the increasing demand for energy, rapid industrialization, and growing investments in infrastructure, particularly in countries like China and India. The expansion of refineries and the adoption of automation solutions to enhance operational efficiency in the oil & gas sector are key contributors to the rapid market growth in Asia Pacific.
Key Players
The major key players are Schneider Electric (France), Emerson Electric Co. (U.S.), ABB Lid (Switzerland), Siemens (Germany), Honeywell International Inc (U.S.), TechnipFMC plc (U.K.), Rockwell Automation, Inc. (U.S.), LARSEN & TOUBRO LIMITED. (India), Implico (U.S.), General Electric (U.S.), Endress+Hauser Group Services AG (Germany), Yokogawa India Ltd. (India), Inter Terminals Limited (U.K.), INTECH (U.S.), Varec, Inc. (U.S.)., Chemtrols Industries Pvt. Ltd. (India), MHT Technology (U.K.), Advanced Sys-tek Pvt. Ltd. (India), General Atomics (U.S.) others.
RECENT DEVELOPMENTS
In August 2023: Evergreen Marine Corp., in cooperation with Taiwan International Ports Corporation, launched Terminal 7 at Kaohsiung Port, Taiwan’s first fully-automated container terminal. This terminal is equipped with remote-controlled gantry cranes, 5 berths, etc., that will facilitate the handling of ultra-large container ships.
In July 2024: OPW Engineered Systems announced the launch of a new 8800 Series Overfill and Ground Monitoring System. It is an advanced solution for terminal operators who seek to make the filling processes more intuitive and safer. This series is incorporated with advanced features that can be easily integrated into existing terminal automation systems. It includes LED lights and pictograms that can rapidly communicate the loading status, irrespective of language.
In August 2024: Shanghai International Port Group (SIPG) has officially announced the commencement of operations at Shanghai’s Luojing Container Terminal. This strategic development marks a significant milestone for SIPG, expanding its capacity and efficiency in handling international cargo. The Luojing Terminal is set to enhance Shanghai's position as a global shipping hub, supporting increased trade volumes and fostering economic growth in the region. The new terminal is equipped with state-of-the-art facilities designed to streamline container handling and boost operational productivity.
In March 2024: Kalmar, a leading provider of cargo handling solutions, has recently delivered electric AutoStrads to APM Terminals' Pier 400 LA. This move is part of APM Terminals' commitment to reducing its carbon footprint and enhancing sustainability within its operations. The electric AutoStrads, known for their efficiency and lower emissions compared to traditional diesel-powered models, will support the terminal's efforts in modernizing its equipment and improving operational efficiency. This initiative reflects a growing trend in the industry towards more environmentally friendly technologies.
| Report Attributes | Details |
| Market Size in 2023 | US$ 7.36 Bn |
| Market Size by 2031 | US$ 10.66 Bn |
| CAGR | CAGR of 4.21% From 2024 to 2032 |
| Base Year | 2023 |
| Forecast Period | 2024-2032 |
| Historical Data | 2020-2022 |
| Report Scope & Coverage | Market Size, Segments Analysis, Competitive Landscape, Regional Analysis, DROC & SWOT Analysis, Forecast Outlook |
| Key Segments | • By Offering (Hardware, Software & Services) • By Project type (Brownfield projects, Greenfield projects) • By Vertical (Oil & Gas, Chemical, Others) |
| Regional Analysis/Coverage | North America (US, Canada, Mexico), Europe (Eastern Europe [Poland, Romania, Hungary, Turkey, Rest of Eastern Europe] Western Europe] Germany, France, UK, Italy, Spain, Netherlands, Switzerland, Austria, Rest of Western Europe]), Asia Pacific (China, India, Japan, South Korea, Vietnam, Singapore, Australia, Rest of Asia Pacific), Middle East & Africa (Middle East [UAE, Egypt, Saudi Arabia, Qatar, Rest of Middle East], Africa [Nigeria, South Africa, Rest of Africa], Latin America (Brazil, Argentina, Colombia Rest of Latin America) |
| Company Profiles | Schneider Electric (France), Emerson Electric Co. (U.S.), ABB Lid (Switzerland), Siemens (Germany), Honeywell International Inc (U.S.), TechnipFMC plc (U.K.), Rockwell Automation, Inc. (U.S.), LARSEN & TOUBRO LIMITED. (India), Implico (U.S.), General Electric (U.S.), Endress+Hauser Group Services AG (Germany), Yokogawa India Ltd. (India), Inter Terminals Limited (U.K.), INTECH (U.S.), Varec, Inc. (U.S.)., Chemtrols Industries Pvt. Ltd. (India), MHT Technology (U.K.), Advanced Sys-tek Pvt. Ltd. (India), General Atomics (U.S.) |
| Key Drivers | • Terminal automation enhances operational efficiency and safety by reducing human error, streamlining processes, and helping industries comply with stringent safety regulations, especially in sectors like oil and gas. • Technological advancements like IoT, AI, cloud computing, and blockchain are driving terminal automation by enabling real-time monitoring, predictive maintenance, and enhanced security and transparency in operations. |
| Market Challenges | • High initial costs for software, hardware, and skilled personnel make deploying terminal automation systems a significant barrier, especially for smaller operators with limited budgets. |
Get in Touch
