Touch Sensor Market Report Scope & Overview:
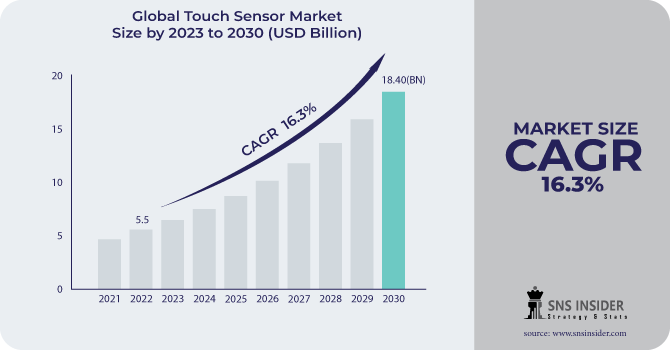
The Touch Sensor Market was valued at USD 6.3 Billion in 2023 and is expected to reach USD 17.5 Billion by 2032, growing at a CAGR of 12.07% from 2024-2032.
The Touch Sensor market has been witnessing significant growth owing to the growing need for interactive, intuitive user interfaces in various sectors. These sensors are essential components of consumer electronics, automotive, healthcare, and industrial applications, enabling smooth user-device interaction. They have been incorporated into these user experience implementations like smartphones, tablets, wearables, and automotive touch panels, leading to more precise and efficient touch experience interactions. Such significant growth is viewed to be primarily induced by the continual technological evolution revolving around touch sensors, which is making them more responsive, durable, and multi-functional. Two of the most common types of touch sensors, capacitive and resistive, have been drastically improved in terms of performance, expanding their application range. Capacitive sensors are not only widely used in consumer electronics but offer better accuracy, faster response, and multi-touch capability compared to resistive sensors. Such advancements have pushed the power of smartphones, tablets, and wearables and have enabled even more growth due to increased penetration.
Automotive is another important area for market growth. With more in-car infotainment systems and digital dashboards, many manufacturers have started embedding touch sensors to enhance driver and passenger interaction with vehicle systems. Touchscreens are now a common element of vehicle dashboards and center consoles but with the push toward electric and autonomous vehicles—which will necessitate more advanced human-machine interfaces.
This is also evident in the rising number of touch sensors used in the healthcare sector for instance, the healthcare sector accounted for over 10% of the global touch sensor market in 2023. Touch sensors can be seen in medical devices and since they can help patient monitoring, diagnostic devices, and even in prosthetics far more efficient and accurate interaction can be achieved through touch sensors. Another major trend is the production of wearable health devices, for example, Fitbit, and Apple, which have also used touch sensors to analyze real-time health data collected from the human body.
Touch sensors are also increasingly finding applications in smart home devices, which are also expected to drive the demand for touch sensors. With an increase in smart appliances, home automation systems, and security devices, more manufacturers are adopting touch-based interfaces to make their appliances more user-friendly and convenient. Market growth will continue driven by increased adoption of touch sensors in the automotive, industrial, consumer, and medical markets, along with some innovations in sensor technology. Touch sensor technology remains an essential foundation in Advantech's R&D efforts when developing next-generation products and systems, especially as the demand for technologies that are natural, easy, and intuitive continues to increase.
Market Dynamics:
Drivers
-
Continuous innovation in sensor technologies, such as capacitive and resistive sensors, enhances responsiveness, accuracy, and durability, driving widespread adoption
-
The integration of touch sensors in medical devices, including diagnostic tools and patient monitoring systems, supports their growing use in the healthcare sector
-
The expansion of smart home devices like smart thermostats, security systems, and automation solutions is accelerating the demand for touch sensors
The expansion of smart home devices like smart thermostats, security systems, and home automation solutions, the demand for touch sensors continues to rise. With an increasing consumer base using smart home technologies to enhance convenience, energy efficiency, and security, demand for more user-friendly interfaces is on the rise. Touch sensors offer an automatic and intuitiveness to the way that users are interacting with such devices, making them crucial parts of the smart home market because this market continuously expands. Smart thermostats that enable users to adjust the temperature of their home via touchscreens used to be a novelty, but now, they feature AI, control systems, and voice control functionalities. While the devices themselves will continue to evolve, the touch sensor technology that makes them possible is also evolving: better response times and more accurate interaction. Likewise, the introduction of smart home security systems that include touch sensors also makes it easier for users to use the system; users can easily control alarms, cameras, and access points through touch interactive screens.
Touch sensors enhance the usability of complex devices by allowing more sophisticated applications to be created that are easier to use. Touchscreens meant no more buttons or dials for consumers to interact with home systems and, as a result, controlling lighting, temperature, and security settings became more natural. It has, therefore, resulted in the higher penetration of such touch-enabled smart home devices, and hence, accounted for a significant portion of the touch sensor market.
In addition, the demand for touch sensors is being driven by the increasing adoption of intelligent machinery, including refrigerators, washing machines, and ovens. Such devices have touch-based interfaces for easy and efficient interaction with appliances. Touch sensors will be part of the driver in bridging the consumer experience-led smart home ecosystem, driven by the influx of connected devices.
Restraints
-
Touch sensors may not perform well in harsh environments, such as extreme temperatures or high moisture conditions, restricting their use in industrial applications.
-
The rise of alternative input technologies like voice recognition and gesture control can reduce the demand for touch sensors.
-
The need for sophisticated technology for multi-touch, haptic feedback, and displays can increase development and maintenance costs for manufacturers.
The growing adoption of other input nature such as voice recognition and gesture control is limiting the use of touch sensors in various sectors. Over the last couple of years, systems like Amazon Alexa, Google Assistant, and Apple’s Siri have made it almost a common practice for users to control smart devices without touching a physical touchscreen. Similarly, Gesture control technologies, which enable users to interact with devices through movement, are experiencing significant growth in the consumer electronics, automotive systems, and smart home technology sectors. These systems are the future of technology and are even more innovative and human-friendly than they normally are, offering up a future user experience for consumers who are looking for heightened convenience and unique methods of interacting with devices.
Smart devices and mobile phones these days have a voice recognition feature that enables users to execute tasks like controlling smart devices, setting alarms, playing songs, etc. without needing to touch any screen. Gesture controls—like those you start seeing in smart TVs and video game consoles—allow a consumer to control a device via hand movements rather than a more traditional touch interface. This blend is especially enticing because, once these technologies are embedded in more devices, hands-free will likely get a lot more usage for numerous use cases. Wearable technologies like smartwatches or fitness trackers are on the rise; voice-based controls are on the fast track too. They use regions that eliminate the need for touch sensors, enabling performers to carry out tasks using voice commands instead of touch-based interfaces. As these technologies become more mature and capable of high accuracy and responsiveness, voice recognition and gesture control are set to ramp up their competition with touch sensors in cases where hands-free may be preferred.
Segment Analysis:
By Type
The single-touch sensor segment dominated the market and represented a significant revenue share of 58.8% in 2023, such sensors are used for their ease of use, relatively cheap manufacturing costs, and ideality for devices that do not need to support multi-touch. Single-touch sensors, which are widely used in point-of-sale terminals and household appliances, are especially used in lower-end and low-cost devices. The single-touch sensor segment market is likely to remain dominant in the global market for obstacle detection sensors market in the years to come, due to technological growth that has been directed at reducing overall cost and enhancing performance over time.
The multi-touch sensor segment is expected to grow at the fastest CAGR during the forecast period, driven by the rising demand for more advanced user interfaces for devices like smartphones, tablets, and interactive displays. For gaming, graphic design, and high-end consumer electronics applications that rely on interaction with multiple points on a screen at the same time, multi-touch sensors are critical. This segment is also expected to witness considerable growth owing to the adoption of touch-based systems in automotive infotainment and educational tools. Owing to the rise in sensor precision, response time, and adoption of Augmented Reality (AR) and Virtual Reality (VR), the multi-touch sensor market is expected to witness rapid growth during the coming years.
By Technology
The capacitive touch sensors segment dominated the market and represented a significant revenue share of 45.23% in 2023, many of the consumer electronic products like smartphones, tablets, and other touch screen devices use this type of sensor. Touch sensors detect touch by detecting the change in an electrical capacitance when a finger or conductive object touches the screen. They are designed to be used in high-performance and responsive devices that require high accuracy, multi-touch, and a high-speed output signal. This is why they are used in most of the consumer products we use daily, especially in smart devices, as capacitive sensors are more reliable and come without the need to apply any physical pressure to detect a touch thus making them more focused in terms of their area of application. Regular technological advancements enable capacitive sensing with improved power, performance, and costs of ownership.
The IR (infrared) touch sensors are expected to experience the fastest compound annual growth rate (CAGR) in the market. It does this using an array of infrared light beams to provide touch detection that has high longevity and can operate without a physical layer above the touchscreen. This reliability and flexibility make IR sensors well-suited for large-format display kiosks and public information systems. They have the advantage of being able to work in many all-encompassing conditions such as when the user is gloved up or utilizing a stylus, thus their larger adoption in the more industrial, public, and commercial applications. IR touch sensors are going to witness tremendous growth primarily due to the increasing demand for interactive touch-based solutions, especially across the digital signage & public display markets.
Regional Analysis:
North America dominated the market and represented a significant revenue share in 2023 as is expected to have a high demand for advanced consumer electronics, such as smartphones, tablets, and wearables. This region includes major electronics and automotive companies, meaning there are lots of businesses innovating and adding touch sensors to new devices. Moreover, with increasing adoption of smart home devices and growing demand for automotive touch sensors in infotainment systems and autonomous vehicles also boosts the market growth in this region. These inherent advantages can make North America a market leader owing to its diverse manufacturing base, expertise in technology, as well as consumer spending. This trend will continue to propagate with new advancements in touchscreen technologies providing an effective experience throughout many industries.
Asia-Pacific is estimated to register the highest CAGR over the forecast period. Rapid technological advancements coupled with growing demand for smartphones, tablets, and other consumer electronics have been the primary drivers of this growth, particularly in emerging countries including China, India, and Southeast Asia. Apart from this, the growing use of touch sensors across automotive, healthcare, and industrial applications, due to a well-established manufacturing base and low-cost production strategies in the region, is driving the market in the coming years. The increasing adoption of smart home devices as well as rising penetration of touch sensors in automotive and wearable applications are expected to propel market growth in APAC over the forecast period. Demand will continue to rise as these markets mature and the APAC region will emerge as a key driver of growth for the global touch sensor market.
.png)
Key Players:
The major key players along with their products are
-
Apple Inc. - iPhone (Capacitive Touch Screen)
-
Samsung Electronics - Galaxy Smartphones (Capacitive Touch Screen)
-
LG Electronics - LG Smart TVs (Capacitive Touch Screen)
-
Synaptics Incorporated - Synaptics Touchpad
-
Microchip Technology Inc. - MTOUCH Capacitive Touch Sensor Controller
-
Harman International - Automotive Touch Control Systems
-
Sharp Corporation - Sharp Touchscreen Panels
-
Texas Instruments - TSC2007 Touch Screen Controller
-
Nokia Corporation - Nokia 7 Plus (Capacitive Touch Screen)
-
Gestigon GmbH - Gestigon Touch-Free Gesture Control System
-
Toshiba Corporation - Toshiba Touchscreen Displays
-
Panasonic Corporation - Panasonic Toughpad (Resistive Touchscreen)
-
Himax Technologies - HX8298-A (Touch Controller IC)
-
Fujitsu Ltd. - Fujitsu Stylus-Free Touch Panel
-
3M Company - 3M MicroTouch Systems (Surface Acoustic Wave)
-
Elo Touch Solutions - Elo 15.6" Touchscreen Monitor
-
Broadcom Inc. - Broadcom Capacitive Touch ICs
-
Atmel Corporation (now part of Microchip Technology) - Atmel Touch Screen Controllers
-
Qualcomm Inc. - Qualcomm Snapdragon (Touchscreen Controllers)
-
Wintek Corporation - Wintek Touchscreen Solutions
Texas Instruments Incorporated-Company Financial Analysis
Recent Developments:
January 2024: Honeywell launched new capacitive touch sensor technology aimed at improving user experiences in the industrial and consumer electronics sectors. The sensors are designed for enhanced responsiveness and durability, catering to the needs of industrial automation applications
March 2024: Infineon Technologies expanded its range of capacitive touch sensors with new product launches, aimed at increasing efficiency for smart home devices. The company's strategy focuses on advancing touch sensor solutions for connected home ecosystems
|
Report Attributes |
Details |
|
Market Size in 2023 |
US$ 6.3 Bn |
|
Market Size by 2032 |
US$ 17.5 Bn |
|
CAGR |
CAGR of 12.07% From 2024 to 2032 |
|
Base Year |
2023 |
|
Forecast Period |
2024-2032 |
|
Historical Data |
2020-2022 |
|
Report Scope & Coverage |
Market Size, Segments Analysis, Competitive Landscape, Regional Analysis, DROC & SWOT Analysis, Forecast Outlook |
|
Market Restrain |
•Declining demand for everyone in-one-pes |
|
Key Drivers |
•Increasing use of touch-based displays •Increased demand for interactive |
Frequently Asked Questions
Ans Touch Sensor Market was valued at USD 6.3 Billion in 2023 and is expected to reach USD 17.5 Billion by 2032, growing at a CAGR of 12.07% from 2024-2032.
Ans- the CAGR of the Touch Sensor Market during the forecast period is 12.07% from 2024-2032.
Ans- the North America dominated the market and represented a significant revenue share in 2023
Ans- one main growth factor for the Touch Sensor Market is
- Continuous innovation in sensor technologies, such as capacitive and resistive sensors, enhances responsiveness, accuracy, and durability, driving widespread adoption
Ans- Challenges in the Touch Sensor Market are
- Touch sensors may not perform well in harsh environments, such as extreme temperatures or high moisture conditions, restricting their use in industrial applications.
- The rise of alternative input technologies like voice recognition and gesture control can reduce the demand for touch sensors.
Get in Touch
