Volumetric 3D Display Market Size:
Get more information on Volumetric 3D Display Market - Request Sample Report
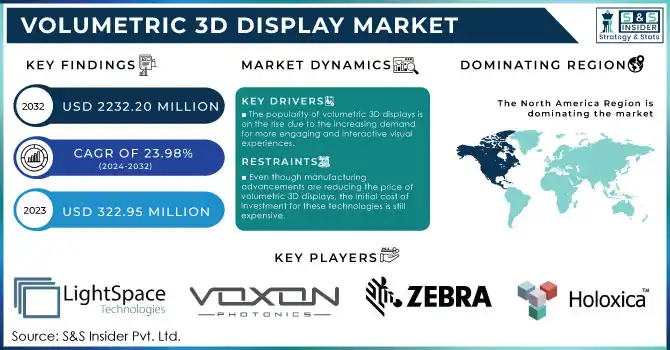
The Volumetric 3D Display Market Size was valued at USD 322.95 Million in 2023 and is expected to reach USD 2232.20 Million by 2032 and grow at a CAGR of 23.98% over the forecast period 2024-2032.
The volumetric 3D display market represents a growing and dynamic sector within the broader display and visualization technologies. In the entertainment and media industries, volumetric 3D displays are already beginning to transform how content is consumed. For example, in gaming, users can interact with objects and environments in three-dimensional space, creating a more realistic and engaging experience. In the film and television industry, volumetric displays offer the potential to bring new storytelling methods to life, allowing audiences to experience films and shows in 3D without the need for traditional screens or VR headsets. For example, the Voxon Photonics VX1 is an example, providing an 18 cm × 18 cm × 8 cm volume area and rendering 500 million voxels per second. Additionally, immersive 3D displays are beginning to be explored for live concerts, theater performances, and other forms of entertainment, offering viewers an unprecedented level of interactivity and immersion. Similarly, according to Barry Blundell and Adam Schwarz, developers of the cathode ray sphere volumetric display, volumetric 3D display creates 3D lightfields by projecting 30 to 200 views of a 3D scene onto an image surface from different angles.
In healthcare, the market for volumetric 3D displays is also expanding, especially in fields like medical imaging and surgery. Doctors and surgeons can use volumetric displays to visualize complex anatomical structures in 3D, improving their ability to diagnose and treat patients. These displays can present MRI, CT, and ultrasound data in a more comprehensible and intuitive format, helping medical professionals plan and perform surgeries with greater precision. The ability to see a 3D rendering of a patient's internal structures can also enhance the understanding of medical conditions and treatment options, leading to better patient outcomes. For instance, Singular Health offers volumetric 3D imaging solutions with Sony's Spatial Reality Display that allow surgeons to see 3D models of anatomical structures without wearing glasses. Their platform enables the immediate adjustment of 3D models obtained from CT, MRI, and PET scans, enhancing surgical accuracy and preparation.
Volumetric 3D Display Market Dynamics
Drivers
-
The popularity of volumetric 3D displays is on the rise due to the increasing demand for more engaging and interactive visual experiences.
Consumers and businesses are both looking for more engaging ways to engage with digital content, leading to the creation of displays capable of showing 3D images instantly. The demand for engaging visual experiences applies to various sectors such as entertainment, education, healthcare, and automotive design. In the realm of gaming and entertainment, there is a clear movement towards content that is increasingly immersive and interactive. Virtual reality and augmented reality technologies have already displayed the ability to create such experiences, but the next phase involves incorporating these elements into daily digital interactions. Volumetric 3D displays offer a more realistic visual experience similar to the real world, without the need for bulky accessories. In gaming, players can engage with objects and characters in a three-dimensional environment, enhancing their experience and providing a heightened sense of immersion. In the same way, volumetric displays offer an interactive learning platform in areas such as education and training. Students and professionals can interact with complex models, animations, and simulations in ways not possible on traditional 2D screens. In areas like medical education, this software proves to be highly beneficial by offering lifelike 3D models of the human body for training students, leading to a better grasp of anatomy.
-
Volumetric 3D displays allow for the visualization of intricate data, such as MRI scans, CT scans, and other diagnostic images, within a three-dimensional environment.
Healthcare providers can engage with 3D representations of patient information, like organs, tissues, and tumors, using a more instinctive approach. Surgeons can use 3D models of organs to enhance their understanding of structure and improve surgical planning accuracy. Furthermore, the capacity to examine medical information from various viewpoints and aspects improves diagnostics, enabling more precise analyses of the images. This can result in enhanced decision-making, decreased error rates, and enhanced patient outcomes. Real-time visualization of 3D data also enhances the medical education process. Students and professionals can enhance their understanding of human anatomy and surgical techniques by utilizing volumetric 3D displays to recreate intricate procedures and situations. The lifelike quality of these presentations makes them a perfect resource for educating medical staff without using cadavers or other tangible models. Consequently, the healthcare industry is expected to be one of the main users of volumetric 3D display technologies, leading to their increase in both market growth and adoption. The medical field can benefit from enhanced precision, training, and patient care due to the ongoing development of these displays.
Restraints
-
Even though manufacturing advancements are reducing the price of volumetric 3D displays, the initial cost of investment for these technologies is still expensive.
The cost of volumetric 3D displays is often high due to the specialized materials and equipment needed for production. Therefore, these screens are inaccessible to numerous small businesses or individual consumers, which hinders their overall uptake. In sectors such as healthcare and education, the clear advantages of 3D displays are outweighed by the substantial obstacle of high initial costs. While the technology provides lasting advantages such as better efficiency and improved user experiences, the initial cost of installing volumetric 3D displays may discourage potential customers, especially in financially constrained industries or developing areas. Furthermore, the expenses for maintaining these systems can be costly, especially in terms of guaranteeing the durability and performance of the displays. The overall cost continues to be a major barrier for businesses or institutions reluctant to make substantial capital investments.
Volumetric 3D Display Market Segmentation
by Type
In 2023, the static volume held the major market share with 58% of the market share. Static volume displays generate three-dimensional images without requiring any motion, incorporating various display technologies such as LEDs or holograms across multiple layers. These screens can create a top-notch 3D image that stays steady in one place, perfect for situations with limited interaction or needing consistent visuals. Static displays are frequently utilized in areas such as medical imaging, scientific visualization, and advertising, where precision and clarity are essential. For instance, Holoxica and Lyncee Tec have created stationary volumetric displays for applications in medical imaging and digital signage.
The swept volume is expected to experience substantial expansion between 2024 and 2032. Utilizing quick movement of light or display components in a span creates the impression of depth and volume in space, producing 3D images. Swept volume displays, unlike static displays, allow for real-time interaction with 3D objects, making them well-suited for immersive applications like virtual reality (VR) and augmented reality (AR). For example, Voxon Photonics and Looking Glass Factory are using swept volume technology in products like interactive medical simulations, 3D designs tools, and interactive media displays to improve user engagement with realistic holographic content.
by End User
The medical led the market in 2023 with a 42% market share. These screens offer improved and easier-to-understand visuals of complicated medical information such as CT scans or MRIs, improving the precision of diagnoses and treatment strategizing. During surgery, hospitals and medical research institutions utilize these displays to create interactive real-time visuals, aiding in the visualization of internal organs and tissues in 3D. For instance, Vivid Technologies and similar companies are incorporating 3D volumetric displays into their imaging solutions to improve patient results.
The aerospace & defense segment is anticipated to become the fastest-growing between 2024 and 2032. Volumetric 3D displays play a crucial role in this sector for simulations, training, and tactical decision-making. Military and aerospace professionals can interact with live 3D models of terrains, aircraft, and other intricate systems. The use of technology for flight simulations is growing, giving pilots a more realistic training experience in an immersive environment. Corporations such as Lockheed Martin and Boeing use volumetric displays for designing and simulating aircraft systems, as well as for mission planning.
Volumetric 3D Display Market Regional Analysis
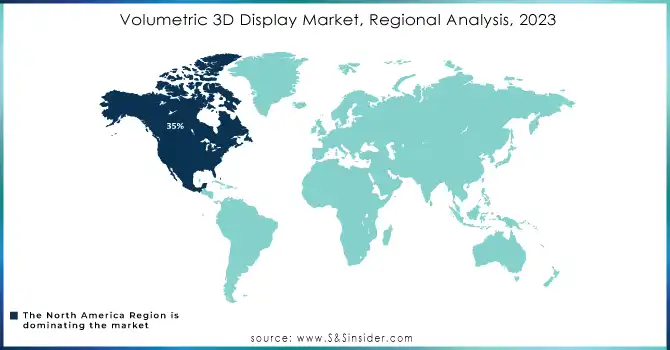
In 2023, North America dominated the volumetric 3D display market with a 35% market share. The region's leading position is a result of its advanced technology, widespread use of immersive technologies in various sectors, and substantial investments in research and development. Businesses in North America, especially in the US, are leading the way in implementing creative 3D display solutions for various industries such as entertainment, healthcare, automotive, and aerospace. For example, Vuzix Corporation and Looking Glass Factory are leading the way in augmented reality (AR) and 3D visual displays, especially for consumer electronics and virtual collaboration tools. Furthermore, healthcare companies are using 3D volumetric displays for medical imaging, improving diagnostics, and generating virtual models for surgeries.
Asia-Pacific is projected to experience the highest growth rate and become the fastest-growing region in the volumetric 3D displays market during 2024-2032. The growth is being fueled by rapid technological advancements, rising urbanization, and an increasing number of digital initiatives. Nations such as Japan, China, South Korea, and India are making significant investments in advancing next-generation display technologies, establishing APAC as a center of innovation. For instance, LG Electronics and Samsung Electronics are unveiling cutting-edge 3D display options for the consumer and professional sectors, especially in smart TVs and immersive media encounters. In the entertainment and gaming industries, businesses in APAC are choosing to use 3D displays to improve interactive experiences.
Get Customized Report as per your Business Requirement - Request For Customized Report
Key Players
The major players in the Volumetric 3D Display Market are:
-
3DIcon Corporation (CAVITATION, 3D Visualization System)
-
LightSpace Technologies Inc (LightSpace 3D Display, LightSpace Touchless Interaction)
-
Voxon (Voxon VX1, Voxon VX2)
-
Holografika Kft (HoloVizio 3D Display, HoloVizio 3D Platform)
-
Zebra Imaging (Zebra Imaging Volumetric Display, Zebra 3D Holographic Prints)
-
Holoxica Ltd (Holoxica 3D Holographic Display, Holovision)
-
Burton Inc (3D Volumetric Displays, Augmented Reality Displays)
-
LEIA Inc (LEIA 3D Lightfield Display, LeiaCast)
-
Seekway Technologies (Seekway 3D Display, Seekway 3D Platform)
-
Alioscopy (Alioscopy 3D Glasses-Free Display, Alioscopy 3D Digital Signage)
-
VividQ (VividQ Software Platform, VividQ for AR/VR)
-
Looking Glass Factory (Looking Glass Portrait, Looking Glass 8K)
-
RealView Imaging (RealView 3D Display, RealView 3D Imaging System)
-
ARHT Media (ARHT HoloPod, ARHT HoloPresence)
-
Kioxia (Kioxia Volumetric Display, 3D OLED Panels)
-
Burj Engineering (Burj Volumetric Display, AR/VR Volumetric Systems)
-
CIMON (CIMON Volumetric Display, 3D Imaging for Smart Industry)
-
Displaylink (DisplayLink for 3D Interfaces, 3D Holographic Display Solution)
-
Holoxica (Holoxica Volumetric Display, Holo-Tube)
-
InnoVision Labs (InnoVision 3D Display, Multi-View 3D Solutions)
Suppliers of components/raw materials:
-
LG Display (OLED panels)
-
Samsung Electronics (LED and OLED technology)
-
Sharp Corporation (LCD components)
-
Nikon Corporation (Optical lenses and imaging solutions)
-
Intel Corporation (Processing chips for volumetric display systems)
-
Sony Corporation (Display technology)
-
Synaptics (Touch sensors and interactive components)
-
Lumentum (Laser and optical components)
-
OmniVision Technologies (Image sensors)
-
Corning Inc (Glass for high-resolution displays)
Recent Development
-
In 2023, Light Field Lab, Inc. introduced a new volumetric display platform, specifically for the entertainment sector, offering improved resolution and brightness to enhance user experiences.
-
In September 2024, Voxon manufactured volumetric holograms, which consist of a 3D display made up of LED lights arranged in a cylinder that rotate and blink in a specific order to create the impression of a 3D image.
-
In September 2024, Kioxia Corporation, unveiled an industry pioneering probing system for high-frequency characteristic measurement for three-dimensional (3D) objects up to 110 GHz at The European Microwave Conference (EuMC).
| Report Attributes | Details |
|---|---|
| Market Size in 2023 | USD 322.95 Million |
| Market Size by 2032 | USD 2232.20 Million |
| CAGR | CAGR of 23.98% From 2024 to 2032 |
| Base Year | 2023 |
| Forecast Period | 2024-2032 |
| Historical Data | 2020-2022 |
| Report Scope & Coverage | Market Size, Segments Analysis, Competitive Landscape, Regional Analysis, DROC & SWOT Analysis, Forecast Outlook |
| Key Segments | • By Type (Swept Volume, Static Volume) • By End User (Medical, Aerospace & Defense Automotive Media, Communication, & Entertainment, Education & Training, Others) |
| Regional Analysis/Coverage | North America (US, Canada, Mexico), Europe (Eastern Europe [Poland, Romania, Hungary, Turkey, Rest of Eastern Europe] Western Europe] Germany, France, UK, Italy, Spain, Netherlands, Switzerland, Austria, Rest of Western Europe]), Asia Pacific (China, India, Japan, South Korea, Vietnam, Singapore, Australia, Rest of Asia Pacific), Middle East & Africa (Middle East [UAE, Egypt, Saudi Arabia, Qatar, Rest of Middle East], Africa [Nigeria, South Africa, Rest of Africa], Latin America (Brazil, Argentina, Colombia, Rest of Latin America) |
| Company Profiles | 3DIcon Corporation, LightSpace Technologies Inc, Voxon, Holografika Kft, Zebra Imaging, Holoxica Ltd, Burton Inc, LEIA Inc, Seekway Technologies, Alioscopy, VividQ, Looking Glass Factory, RealView Imaging, ARHT Media, Kioxia, Burj Engineering, CIMON, Displaylink, InnoVision Labs |
| Key Drivers | • The popularity of volumetric 3D displays is on the rise due to the increasing demand for more engaging and interactive visual experiences. • Volumetric 3D displays allow for the visualization of intricate data, such as MRI scans, CT scans, and other diagnostic images, within a three-dimensional environment. |
| RESTRAINTS | • Even though manufacturing advancements are reducing the price of volumetric 3D displays, the initial cost of investment for these technologies is still expensive. |
Frequently Asked Questions
Ans: The Static Volume segment dominated the Volumetric 3D Display Market.
Ans: North America dominated the Volumetric 3D Display Market in 2023.
Ans: The Volumetric 3D Display Market is expected to grow at a CAGR of 23.98% during 2024-2032.
Ans: The popularity of volumetric 3D displays is on the rise due to the increasing demand for more engaging and interactive visual experiences.
Ans: Volumetric 3D Display Market size was USD 322.95 Million in 2023 and is expected to Reach USD 2232.20 Million by 2032.
Get in Touch
