Touchless Sensing market Report Scope & Overview:
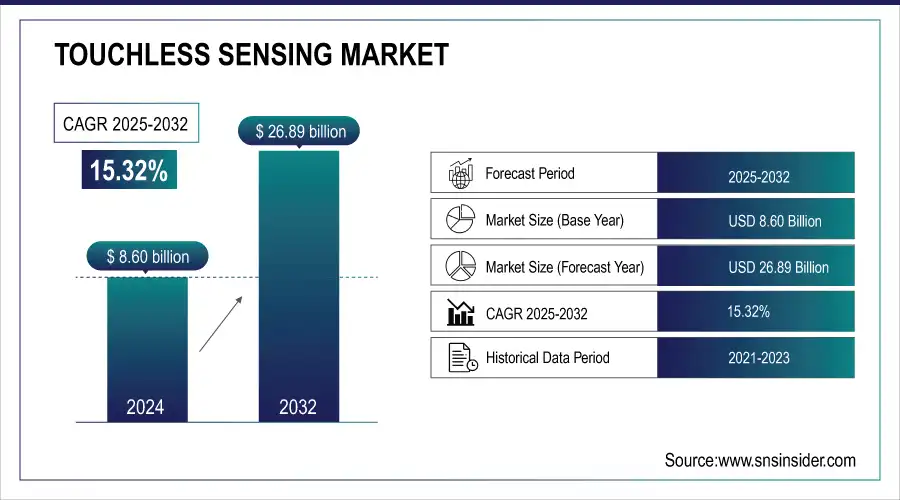
The Touchless Sensing Market size was valued at USD 2.52 Billion in 2024 and is projected to reach USD 3.81 Billion by 2032, growing at a CAGR of 12.40% during 2025-2032.
Global Touchless Sensing market is experiencing rapid growth driven by rising demand for hygiene, convenience, and automation across public, commercial, and healthcare spaces. Traditional infrared (IR) sensors, while widely used, face limitations such as sensitivity to ambient light and reflective surfaces, leading to inefficiencies and user dissatisfaction. Advanced Time-of-Flight (TOF) sensors are emerging as a superior solution, offering precise 3D distance measurement, reducing false activations, and improving resource management, particularly water conservation. Adoption of these technologies supports sustainability goals, operational efficiency, and enhanced user experience, making touchless solutions increasingly standard in high-traffic areas like airports, educational campuses, and commercial buildings.
Time-of-Flight (TOF) sensors are revolutionizing touchless public facilities by enhancing accuracy and reducing water waste, becoming a key feature in high-traffic and sustainable buildings (Eduardo Souza, August 14, 2025).

To Get more information on Touchless Sensing Market - Request Free Sample Report
Key Touchless Sensing market Trends
-
AI-Powered Gesture Control is driving adoption of neural and gesture-based interfaces across defense, enterprise, and consumer sectors
-
Wearable and neural input devices enhance operational efficiency, safety, and user experience in military and industrial applications
-
Multi-sensing technologies combining capacitive, inductive, and liquid-level sensing enable sleek, durable, and waterproof devices
-
Expansion in smart environments includes robotics, smart homes, and healthcare boosting market growth
-
Touchless sensing supports next-generation automation and seamless human-device interaction
-
Improved precision and reduced physical contact lead to operational efficiency and cost savings
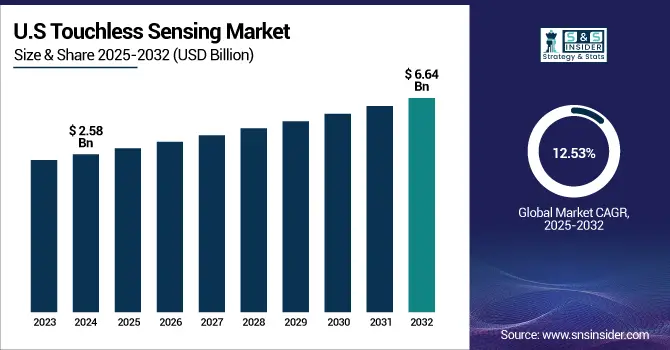
The U.S Touchless Sensing market size was valued at USD 2.58 Billion in 2024 and is projected to reach USD 6.64 Billion by 2032, growing at a CAGR of 12.53% during 2025-2032. Touchless Sensing Market growth is fueled by increasing adoption of touchless technologies in public, healthcare, and commercial spaces to enhance hygiene, convenience, and operational efficiency. Advanced sensors like Time-of-Flight (TOF) are driving superior accuracy and resource management, making touchless solutions standard in high-traffic areas while supporting sustainability and improved user experiences.

The Touchless Sensing market Trends include the rise of advanced sensors such as Time-of Flight (TOF), capacitive, and camera-based systems replacing traditional infrared; integration with IoT and AI for predictive analytics and resource optimization; growing adoption in public, commercial, healthcare, automotive, and retail sectors; emphasis on hygiene, water and energy conservation; sleek, user-friendly product designs; and increasing focus on sustainability, operational efficiency, and seamless, touch-free user experiences in high-traffic and smart environments.
Touchless Sensing Market Growth Drivers:
-
AI-Driven Gesture Control Accelerating Touchless Sensing Adoption Across Sectors
The Touchless Sensing market is the rising adoption of advanced human-machine interfaces (HMI) across defense, enterprise, and consumer applications. AI-powered touchless wearables and neural input devices allow users to control systems through intuitive gestures, enhancing operational efficiency, safety, and overall user experience. By reducing physical contact and enabling seamless interactions, these technologies are particularly valuable in high-stakes environments like military operations and immersive enterprise solutions. The integration of AI, gesture recognition, and touchless interfaces is expanding market opportunities and accelerating the shift toward contact-free, efficient, and intuitive human-device interactions.
In Aug 2025, Wearable Devices Ltd. launched AI-powered touchless neural wearables for military applications, enabling soldiers to control systems via intuitive gestures, enhancing safety and operational efficiency
Touchless Sensing Market Restraints:
-
High Implementation Costs and Technological Complexity Limit Touchless Sensing Adoption
High implementation costs and technological complexity are significant factors limiting the adoption of touchless sensing solutions across industries. Advanced AI-powered neural and gesture-based systems require substantial investment in research, development, and integration, which can be prohibitive for small and mid-sized enterprises. Additionally, these systems may face performance challenges in complex environments, such as fluctuating ambient light, reflective surfaces, or crowded spaces, leading to occasional inaccuracies. Coupled with concerns over data privacy and security in connected systems, these barriers slow large-scale deployment despite growing demand for contactless interaction and automation.
Touchless Sensing Market Opportunities:
-
Rising Demand for Advanced Interfaces Drives Growth in the Touchless Sensing Market
The Touchless Sensing market offers significant opportunities driven by the growing demand for advanced human-machine interfaces and multi-functional sensing solutions across consumer, industrial, and smart home applications. Combining technologies such as capacitive, inductive, and liquid-level sensing enables the development of sleek, durable, and waterproof devices with enhanced functionality. Applications in robotics, home appliances, healthcare, and wearable devices provide potential for cost savings, improved user experience, and operational efficiency. Increasing integration of AI and machine learning further expands capabilities, positioning touchless sensing as a key enabler of next-generation automation, smart environments, and innovative product designs.
In March 2025, Infineon Technologies launched PSOC™ 4 Multi-Sense in 2025, expanding capacitive sensing with inductive, liquid, and hover touch capabilities to enable advanced touchless HMI and sensing applications
Key Direct Imaging System market Segment Analysis:
By Technology: Infrared (IR) dominates at 38.75% in 2024, Capacitive/Proximity grows fastest at 10.88% in 2024;
By Product Type: Touchless Biometric Devices dominate at 44.25% in 2024, Gesture-Recognition Controllers grow fastest at 10.50%;
By End-User Industry: Consumer Electronics dominate at 39.25% in 2024, Automotive grows fastest at 10.57%;
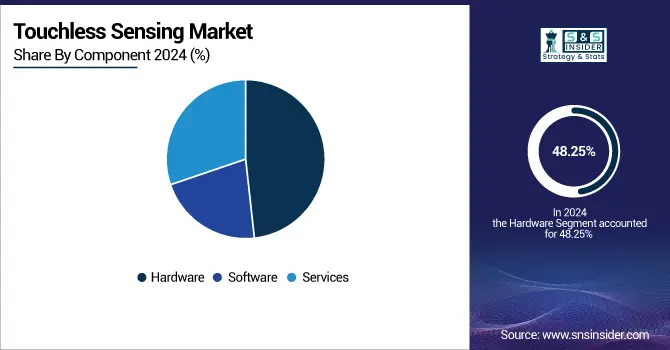
By Component: Hardware dominates at 48.25% in 2024, Software grows fastest at 21.53%.
By Component, Hardware Lead While Software Grow Fastest
In the Touchless Sensing market, Hardware leads as the primary component, powering sensors, controllers, and interactive devices across various applications. Meanwhile, Software is experiencing the fastest growth, driven by increasing integration of AI, machine learning, and advanced algorithms that enhance sensor intelligence, enable seamless human-machine interaction, and support the development of innovative, responsive, and efficient touchless solutions across industries.

By Technology, Infrared (IR) Leads Market While Capacitive/Proximity Registers Fastest Growth
Infrared (IR) technology dominates the Touchless Sensing market, widely adopted across consumer and industrial applications for reliable contactless interactions. At the same time, Capacitive/Proximity technology is experiencing the fastest growth, fueled by increasing demand for advanced human-machine interfaces and interactive devices that deliver precise, responsive, and seamless touchless experiences across various industries, enhancing usability and efficiency.
By Product Type, Touchless Biometric Devices Dominate While Gesture-Recognition Controllers Shows Rapid Growth
Touchless Biometric Devices dominate the market by product type, driven by their extensive use in security, healthcare, and consumer applications for seamless and hygienic user interactions. Meanwhile, Gesture-Recognition Controllers are showing rapid growth, fueled by increasing adoption in gaming, virtual reality, and smart home systems. These devices enable intuitive, contactless control, enhancing user experience and expanding the scope of touchless technology across industries.
By End-User Industry, Consumer Electronics Lead While Automotive Registers Fastest Growth
In the Touchless Sensing market, Consumer Electronics lead by end-user industry due to the widespread integration of touchless interfaces in smartphones, wearables, and smart devices. Meanwhile, the Automotive sector is registering the fastest growth, driven by rising demand for contactless controls, gesture recognition, and advanced in-vehicle user interfaces that enhance safety, convenience, and overall driving experience across modern vehicles.
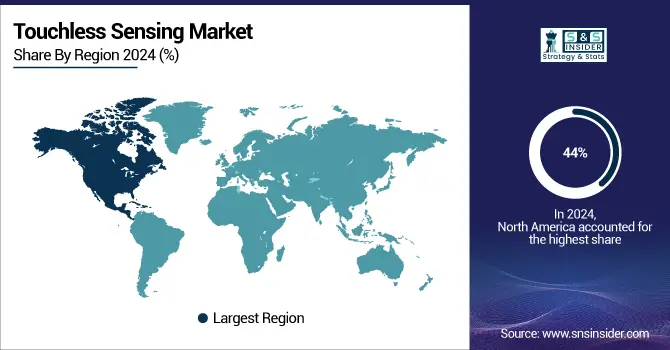
North America Touchless Sensing Market Insights
In 2024 North America dominated the Touchless Sensing Market and accounted for 44% of revenue share, The region’s leadership is driven by strong adoption of advanced technologies, presence of key industry players, and high demand for touchless solutions across consumer electronics, healthcare, and industrial applications. Rapid innovation and investments in AI-driven and contactless interfaces further strengthen its market position.

Get Customized Report as per Your Business Requirement - Enquiry Now
Europe Direct Imaging System Market Insights
Europe is expected to witness the fastest growth in the Touchless Sensing Market over 2025-2032, with a projected CAGR of 17.12%, This growth is fueled by increasing adoption of smart devices, automation in industrial and healthcare sectors, and supportive regulatory frameworks. Rising investments in AI-driven touchless technologies and innovative human-machine interfaces further accelerate market expansion across the region.
Asia-Pacific Touchless Sensing Market Insights
In 2024, Asia-Pacific emerged as a promising region in the Touchless Sensing Market, driven by rapid urbanization, rising disposable incomes, and growing adoption of smart consumer electronics. The region benefits from a strong manufacturing base, expanding industrial automation, and increasing investments in AI-powered touchless technologies. These factors collectively position Asia-Pacific as a key growth hub, attracting major market players and fostering innovation across multiple sectors.
Latin America (LATAM) and Middle East & Africa (MEA) Touchless Sensing Market Insights
The Touchless Sensing Market is experiencing moderate growth in the Latin America (LATAM) and Middle East & Africa (MEA) regions, driven by increasing adoption of contactless technologies in healthcare, retail, and public infrastructure. Rising awareness of hygiene, gradual digitalization, and investments in smart devices and automation are supporting steady market expansion, creating opportunities for regional players and international technology providers.
Competitive Landscape for Touchless Sensing Market:
iProov, founded in 2012, is a leading provider of touchless biometric and liveness detection solutions, enabling secure, passwordless authentication across enterprise systems, devices, and facilities. Their technology enhances user experience, prevents identity fraud, and supports seamless access for employees, making it a key player in advancing touchless security and human-machine interaction.
-
On Dec 10, 2024, iProov integrated biometrics and liveness detection with Microsoft Entra ID to enable secure, passwordless workforce access across systems, terminals, and facilities, enhancing protection against identity fraud and improving user experience.
Apple Inc., founded in 1976 in Cupertino, California, is a global technology leader designing and manufacturing consumer electronics, software, and services. Renowned for its iPhone, iPad, Mac, and Apple Watch products, the company emphasizes innovation, user experience, and ecosystem integration, while advancing touchless sensing and biometric technologies for secure, intuitive device interactions.
-
In Sept 2024,Apple revealed plans for future iPhones and iPads with optical touch sensors that remain functional in the presence of moisture, enhancing usability and touch accuracy in wet conditions.
Touchless Sensing Market Key Players:
Some of the Touchless Sensing Market Companies
-
Infineon Technologies AG
-
Apple Inc.
-
Google Inc.
-
XYZ Interactive
-
GestureTek
-
OmniVision Technologies, Inc.
-
Cognitech Systems GmbH
-
Microchip Technology Inc.
-
iPROOV Limited
-
Elliptic Labs
-
Lightricity Technologies
-
Sony Depth Sensing Solutions
-
Microsoft Corporation
-
Samsung Electronics
-
STMicroelectronics
-
Texas Instruments
-
Intel Corporation
-
Qualcomm Technologies, Inc.
-
Panasonic Holdings Corporation
-
Toshiba Corporation
Report Attributes | Details |
Market Size in 2024 | USD 8.60 Billion |
Market Size by 2032 | USD 26.89 Billion |
CAGR | CAGR of 15.32% From 2024 to 2032 |
Base Year | 2024 |
Forecast Period | 2025-2032 |
Historical Data | 2021-2023 |
Report Scope & Coverage | Market Size, Segments Analysis, Competitive Landscape, Regional Analysis, DROC & SWOT Analysis, Forecast Outlook |
Key Segments | • By Technology(Infrared (IR), Ultrasound, Capacitive / Proximity, Camera-based and RFID / NFC) • By Product Type(Touchless Biometric Devices, Gesture-Recognition Controllers, Sanitary Equipment and Interactive Kiosks / Screens) • By End-User Industry(Consumer Electronics, Healthcare and Life-Sciences, Automotive and Transportation, BFSI and Retail and Industrial and Logistics) • By Component(Hardware, Software and Services) |
Regional Analysis/Coverage | North America (US, Canada), Europe (Germany, UK, France, Italy, Spain, Russia, Poland, Rest of Europe), Asia Pacific (China, India, Japan, South Korea, Australia, ASEAN Countries, Rest of Asia Pacific), Middle East & Africa (UAE, Saudi Arabia, Qatar, South Africa, Rest of Middle East & Africa), Latin America (Brazil, Argentina, Mexico, Colombia, Rest of Latin America). |
Company Profiles | Infineon Technologies AG, Apple Inc., Google Inc., XYZ Interactive, GestureTek, OmniVision Technologies, Inc., Cognitech Systems GmbH, Microchip Technology Inc., iPROOV Limited, Elliptic Labs, Lightricity Technologies, Sony Depth Sensing Solutions, Microsoft Corporation, Samsung Electronics, STMicroelectronics, Texas Instruments, Intel Corporation, Qualcomm Technologies, Inc., Panasonic Holdings Corporation, Toshiba Corporation |
Table Of Contents
1. Introduction
1.1 Market Definition & Scope
1.2 Research Assumptions & Abbreviations
1.3 Research Methodology
2. Executive Summary
2.1 Market Snapshot
2.2 Market Absolute $ Opportunity Assessment & Y-o-Y Analysis, 2021–2032
2.3 Market Size & Forecast, By Segmentation, 2021–2032
2.3.1 Market Size By Technology
2.3.2 Market Size By Product Type
2.3.3 Market Size By End-User Industry
2.3.4 Market Size By Component
2.4 Market Share & Bps Analysis by Region, 2024
2.5 Industry Growth Scenarios – Conservative, Including & Optimistic
2.6 Industry CxO’s Perspective
3. Market Overview
3.1 Market Dynamics
3.1.1 Drivers
3.1.2 Restraints
3.1.3 Opportunities
3.1.4 Key Market Trends
3.2 Industry PESTLE Analysis
3.3 Key Industry Forces (Porter’s) Impacting Market Growth
3.4 Industry Supply Chain Analysis
3.4.1 Raw Interconnecting Analog Type Suppliers
3.4.2 Manufacturers
3.4.3 Distributors/Suppliers
3.4.4 Customers/ Voltage Range
3.5 Industry Life Cycle Assessment
3.6 Parent Market Overview
3.7 Market Risk Assessment
4. Statistical Insights & Trends Reporting
4.1 Adoption & Usage Metrics
4.1.1 Percentage of commercial vs. consumer adoption of touchless sensors
4.1.2 Annual growth rate of new device installations in healthcare, automotive, and retail sectors
4.1.3 Average number of touchless interactions per device per day
4.2 Technology Penetration Statistics
4.2.1 Share of capacitive vs. infrared vs. ultrasonic touchless sensors in the market
4.2.2 Percentage of IoT-integrated touchless sensing devices
4.2.3 Number of patents filed annually for touchless sensor innovations
4.3 Safety & Hygiene Impact
4.3.1 Reduction in surface contamination (%) after implementing touchless systems
4.3.2 Number of infection-prevention protocols integrating touchless sensing
4.3.3 Average decrease in workplace absenteeism (%) attributed to hygiene improvements
4.4 Cost & Efficiency Metrics
4.4.1 Average operational cost savings (%) for businesses adopting touchless solutions
4.4.2 ROI period (months/years) for installing touchless sensors in commercial buildings
4.4.3 Energy efficiency improvements (%) in automated touchless systems
5. Touchless Sensing market Segmental Analysis & Forecast, By Technology, 2021 – 2032
5.1 Introduction
5.2 Infrared (IR)
5.2.1 Key Trends
5.2.2 Market Size & Forecast, 2021 – 2032
5.3 Ultrasound
5.3.1 Key Trends
5.3.2 Market Size & Forecast, 2021 – 2032
5.4 Capacitive / Proximity
5.4.1 Key Trends
5.4.2 Market Size & Forecast, 2021 – 2032
5.5 Camera-based
5.5.1 Key Trends
5.5.2 Market Size & Forecast, 2021 – 2032
5.6 RFID / NFC
5.6.1 Key Trends
5.6.2 Market Size & Forecast, 2021 – 2032
6. Touchless Sensing market Segmental Analysis & Forecast, By Product Type, 2021 – 2032
6.1 Introduction
6.2 Touchless Biometric Devices
6.2.1 Key Trends
6.2.2 Market Size & Forecast, 2021 – 2032
6.3 Gesture-Recognition Controllers
6.3.1 Key Trends
6.3.2 Market Size & Forecast, 2021 – 2032
6.4 Sanitary Equipment
6.4.1 Key Trends
6.4.2 Market Size & Forecast, 2021 – 2032
6.5 Interactive Kiosks / Screens
6.5.1 Key Trends
6.5.2 Market Size & Forecast, 2021 – 2032
7. Touchless Sensing market Segmental Analysis & Forecast, By End-User Industry, 2021 – 2032
7.1 Introduction
7.2 Consumer Electronics
7.2.1 Key Trends
7.2.2 Market Size & Forecast, 2021 – 2032
7.3 Healthcare and Life-Sciences
7.3.1 Key Trends
7.3.2 Market Size & Forecast, 2021 – 2032
7.4 Automotive and Transportation
7.4.1 Key Trends
7.4.2 Market Size & Forecast, 2021 – 2032
7.5 BFSI and Retail
7.5.1 Key Trends
7.5.2 Market Size & Forecast, 2021 – 2032
7.6 Industrial and Logistics
7.6.1 Key Trends
7.6.2 Market Size & Forecast, 2021 – 2032
8. Touchless Sensing market Segmental Analysis & Forecast, By Component, 2021 – 2032
8.1 Introduction
8.2 Hardware
8.2.1 Key Trends
8.2.2 Market Size & Forecast, 2021 – 2032
8.3 Software
8.3.1 Key Trends
8.3.2 Market Size & Forecast, 2021 – 2032
8.4 Services
8.4.1 Key Trends
8.4.2 Market Size & Forecast, 2021 – 2032
9. Touchless Sensing market Segmental Analysis & Forecast By Region, 2021 – 2025
9.1 Introduction
9.2 North America
9.2.1 Key Trends
9.2.2 Touchless Sensing market Size & Forecast, By Technology , 2021 – 2032
9.2.3 Touchless Sensing market Size & Forecast, By Product Type , 2021 – 2032
9.2.4 Touchless Sensing market Size & Forecast, By End-User Industry, 2021 – 2032
9.2.5 Touchless Sensing market Size & Forecast, By Component , 2021 – 2032
9.2.6 Touchless Sensing market Size & Forecast, By Country, 2021 – 2032
9.2.6.1 USA
9.2.6.1.1 Touchless Sensing market Size & Forecast, By Technology , 2021 – 2032
9.2.6.1.2 Touchless Sensing market Size & Forecast, By Product Type , 2021 – 2032
9.2.6.1.3 Touchless Sensing market Size & Forecast, By End-User Industry, 2021 – 2032
9.2.6.1.4 Touchless Sensing market Size & Forecast, By Component , 2021 – 2032
9.2.6.2 Canada
9.2.6.2.1 Touchless Sensing market Size & Forecast, By Technology , 2021 – 2032
9.2.6.2.2 Touchless Sensing market Size & Forecast, By Product Type , 2021 – 2032
9.2.6.2.3 Touchless Sensing market Size & Forecast, By Detection Technology, 2021 – 2032
9.2.6.2.4 Touchless Sensing market Size & Forecast, By Component, 2021 – 2032
9.3 Europe
9.3.1 Key Trends
9.3.2 Touchless Sensing market Size & Forecast, By Technology , 2021 – 2032
9.3.3 Touchless Sensing market Size & Forecast, By Product Type , 2021 – 2032
9.3.4 Touchless Sensing market Size & Forecast, By End-User Industry, 2021 – 2032
9.3.5 Touchless Sensing market Size & Forecast, By Component , 2021 – 2032
9.3.6 Touchless Sensing market Size & Forecast, By Country, 2021 – 2032
9.3.6.1 Germany
9.3.6.1.1 Touchless Sensing market Size & Forecast, By Technology , 2021 – 2032
9.3.6.1.2 Touchless Sensing market Size & Forecast, By Product Type , 2021 – 2032
9.3.6.1.3 Touchless Sensing market Size & Forecast, By End-User Industry, 2021 – 2032
9.3.6.1.4 Touchless Sensing market Size & Forecast, By Component , 2021 – 2032
9.3.6.2 UK
9.3.6.2.1 Touchless Sensing market Size & Forecast, By Technology , 2021 – 2032
9.3.6.2.2 Touchless Sensing market Size & Forecast, By Product Type , 2021 – 2032
9.3.6.2.3 Touchless Sensing market Size & Forecast, By End-User Industry, 2021 – 2032
9.3.6.2.4 Touchless Sensing market Size & Forecast, By Component , 2021 – 2032
9.3.6.3 France
9.3.6.3.1 Touchless Sensing market Size & Forecast, By Technology , 2021 – 2032
9.3.6.3.2 Touchless Sensing market Size & Forecast, By Product Type , 2021 – 2032
9.3.6.3.3 Touchless Sensing market Size & Forecast, By End-User Industry, 2021 – 2032
9.3.6.3.4 Touchless Sensing market Size & Forecast, By Component , 2021 – 2032
9.3.6.4 Italy
9.3.6.4.1 Touchless Sensing market Size & Forecast, By Technology , 2021 – 2032
9.3.6.4.2 Touchless Sensing market Size & Forecast, By Product Type , 2021 – 2032
9.3.6.4.3 Touchless Sensing market Size & Forecast, By End-User Industry, 2021 – 2032
9.3.6.4.4 Touchless Sensing market Size & Forecast, By Component , 2021 – 2032
9.3.6.5 Spain
9.3.6.5.1 Touchless Sensing market Size & Forecast, By Technology , 2021 – 2032
9.3.6.5.2 Touchless Sensing market Size & Forecast, By Product Type , 2021 – 2032
9.3.6.5.3 Touchless Sensing market Size & Forecast, By End-User Industry, 2021 – 2032
9.3.6.5.4 Touchless Sensing market Size & Forecast, By Component , 2021 – 2032
9.3.6.6 Russia
9.3.6.6.1 Touchless Sensing market Size & Forecast, By Technology , 2021 – 2032
9.3.6.6.2 Touchless Sensing market Size & Forecast, By Product Type , 2021 – 2032
9.3.6.6.3 Touchless Sensing market Size & Forecast, By End-User Industry, 2021 – 2032
9.3.6.6.4 Touchless Sensing market Size & Forecast, By Component , 2021 – 2032
9.3.6.7 Poland
9.3.6.7.1 Touchless Sensing market Size & Forecast, By Technology , 2021 – 2032
9.3.6.7.2 Touchless Sensing market Size & Forecast, By Product Type , 2021 – 2032
9.3.6.7.3 Touchless Sensing market Size & Forecast, By End-User Industry, 2021 – 2032
9.3.6.7.4 Touchless Sensing market Size & Forecast, By Component , 2021 – 2032
9.3.6.8 Rest of Europe
9.3.6.8.1 Touchless Sensing market Size & Forecast, By Technology , 2021 – 2032
9.3.6.8.2 Touchless Sensing market Size & Forecast, By Product Type , 2021 – 2032
9.3.6.8.3 Touchless Sensing market Size & Forecast, By End-User Industry, 2021 – 2032
9.3.6.8.4 Touchless Sensing market Size & Forecast, By Component , 2021 – 2032
9.4 Asia-Pacific
9.4.1 Key Trends
9.4.2 Touchless Sensing market Size & Forecast, By Technology , 2021 – 2032
9.4.3 Touchless Sensing market Size & Forecast, By Product Type , 2021 – 2032
9.4.4 Touchless Sensing market Size & Forecast, By End-User Industry, 2021 – 2032
9.4.5 Touchless Sensing market Size & Forecast, By Component , 2021 – 2032
9.4.6 Touchless Sensing market Size & Forecast, By Country, 2021 – 2032
9.4.6.1 China
9.4.6.1.1 Touchless Sensing market Size & Forecast, By Technology , 2021 – 2032
9.4.6.1.2 Touchless Sensing market Size & Forecast, By Product Type , 2021 – 2032
9.4.6.1.3 Touchless Sensing market Size & Forecast, By End-User Industry, 2021 – 2032
9.4.6.1.4 Touchless Sensing market Size & Forecast, By Component , 2021 – 2032
9.4.6.2 India
9.4.6.2.1 Touchless Sensing market Size & Forecast, By Technology , 2021 – 2032
9.4.6.2.2 Touchless Sensing market Size & Forecast, By Product Type , 2021 – 2032
9.4.6.2.3 Touchless Sensing market Size & Forecast, By End-User Industry, 2021 – 2032
9.4.6.2.4 Touchless Sensing market Size & Forecast, By Component , 2021 – 2032
9.4.6.3 Japan
9.4.6.3.1 Touchless Sensing market Size & Forecast, By Technology , 2021 – 2032
9.4.6.3.2 Touchless Sensing market Size & Forecast, By Product Type , 2021 – 2032
9.4.6.3.3 Touchless Sensing market Size & Forecast, By End-User Industry, 2021 – 2032
9.4.6.3.4 Touchless Sensing market Size & Forecast, By Component , 2021 – 2032
9.4.6.4 South Korea
9.4.6.4.1 Touchless Sensing market Size & Forecast, By Technology , 2021 – 2032
9.4.6.4.2 Touchless Sensing market Size & Forecast, By Product Type , 2021 – 2032
9.4.6.4.3 Touchless Sensing market Size & Forecast, By End-User Industry, 2021 – 2032
9.4.6.4.4 Touchless Sensing market Size & Forecast, By Component , 2021 – 2032
9.4.6.5 Australia
9.4.6.5.1 Touchless Sensing market Size & Forecast, By Technology , 2021 – 2032
9.4.6.5.2 Touchless Sensing market Size & Forecast, By Product Type , 2021 – 2032
9.4.6.5.3 Touchless Sensing market Size & Forecast, By End-User Industry, 2021 – 2032
9.4.6.5.4 Touchless Sensing market Size & Forecast, By Component , 2021 – 2032
9.4.6.6 ASEAN Countries
9.4.6.6.1 Touchless Sensing market Size & Forecast, By Technology , 2021 – 2032
9.4.6.6.2 Touchless Sensing market Size & Forecast, By Product Type , 2021 – 2032
9.4.6.6.3 Touchless Sensing market Size & Forecast, By End-User Industry, 2021 – 2032
9.4.6.6.4 Touchless Sensing market Size & Forecast, By Component , 2021 – 2032
9.4.6.7 Rest of Asia-Pacific
9.4.6.7.1 Touchless Sensing market Size & Forecast, By Technology , 2021 – 2032
9.4.6.7.2 Touchless Sensing market Size & Forecast, By Product Type , 2021 – 2032
9.4.6.7.3 Touchless Sensing market Size & Forecast, By End-User Industry, 2021 – 2032
9.4.6.7.4 Touchless Sensing market Size & Forecast, By Component , 2021 – 2032
9.5 Latin America
9.5.1 Key Trends
9.5.2 Touchless Sensing market Size & Forecast, By Technology , 2021 – 2032
9.5.3 Touchless Sensing market Size & Forecast, By Product Type , 2021 – 2032
9.5.4 Touchless Sensing market Size & Forecast, By End-User Industry, 2021 – 2032
9.5.5 Touchless Sensing market Size & Forecast, By Component , 2021 – 2032
9.5.6 Touchless Sensing market Size & Forecast, By Country, 2021 – 2032
9.5.6.1 Brazil
9.5.6.1.1 Touchless Sensing market Size & Forecast, By Technology , 2021 – 2032
9.5.6.1.2 Touchless Sensing market Size & Forecast, By Product Type , 2021 – 2032
9.5.6.1.3 Touchless Sensing market Size & Forecast, By End-User Industry, 2021 – 2032
9.5.6.1.4 Touchless Sensing market Size & Forecast, By Component , 2021 – 2032
9.5.6.2 Argentina
9.5.6.2.1 Touchless Sensing market Size & Forecast, By Technology , 2021 – 2032
9.5.6.2.2 Touchless Sensing market Size & Forecast, By Product Type , 2021 – 2032
9.5.6.2.3 Touchless Sensing market Size & Forecast, By End-User Industry, 2021 – 2032
9.5.6.2.4 Touchless Sensing market Size & Forecast, By Component , 2021 – 2032
9.5.6.3 Mexico
9.5.6.3.1 Touchless Sensing market Size & Forecast, By Technology , 2021 – 2032
9.5.6.3.2 Touchless Sensing market Size & Forecast, By Product Type , 2021 – 2032
9.5.6.3.3 Touchless Sensing market Size & Forecast, By End-User Industry, 2021 – 2032
9.5.6.3.4 Touchless Sensing market Size & Forecast, By Component , 2021 – 2032
9.5.6.4 Colombia
9.5.6.4.1 Touchless Sensing market Size & Forecast, By Technology , 2021 – 2032
9.5.6.4.2 Touchless Sensing market Size & Forecast, By Product Type , 2021 – 2032
9.5.6.4.3 Touchless Sensing market Size & Forecast, By End-User Industry, 2021 – 2032
9.5.6.4.4 Touchless Sensing market Size & Forecast, By Component , 2021 – 2032
9.5.6.5 Rest of Latin America
9.5.6.5.1 Touchless Sensing market Size & Forecast, By Technology , 2021 – 2032
9.5.6.5.2 Touchless Sensing market Size & Forecast, By Product Type , 2021 – 2032
9.5.6.5.3 Touchless Sensing market Size & Forecast, By End-User Industry, 2021 – 2032
9.5.6.5.4 Touchless Sensing market Size & Forecast, By Component , 2021 – 2032
9.6 Middle East & Africa
9.6.1 Key Trends
9.6.2 Touchless Sensing market Size & Forecast, By Technology , 2021 – 2032
9.6.3 Touchless Sensing market Size & Forecast, By Product Type , 2021 – 2032
9.6.4 Touchless Sensing market Size & Forecast, By Detection Technology, 2021 – 2032
9.6.5 Touchless Sensing market Size & Forecast, By Component, 2021 – 2032
9.6.6 Touchless Sensing market Size & Forecast, By Country, 2021 – 2032
9.6.6.1 UAE
9.6.6.1.1 Touchless Sensing market Size & Forecast, By Technology , 2021 – 2032
9.6.6.1.2 Touchless Sensing market Size & Forecast, By Product Type , 2021 – 2032
9.6.6.1.3 Touchless Sensing market Size & Forecast, By End-User Industry, 2021 – 2032
9.6.6.1.4 Touchless Sensing market Size & Forecast, By Component , 2021 – 2032
9.6.6.2 Saudi Arabia
9.6.6.2.1 Touchless Sensing market Size & Forecast, By Technology , 2021 – 2032
9.6.6.2.2 Touchless Sensing market Size & Forecast, By Product Type , 2021 – 2032
9.6.6.2.3 Touchless Sensing market Size & Forecast, By End-User Industry, 2021 – 2032
9.6.6.2.4 Touchless Sensing market Size & Forecast, By Component , 2021 – 2032
9.6.6.3 Qatar
9.6.6.3.1 Touchless Sensing market Size & Forecast, By Technology , 2021 – 2032
9.6.6.3.2 Touchless Sensing market Size & Forecast, By Product Type , 2021 – 2032
9.6.6.3.3 Touchless Sensing market Size & Forecast, By End-User Industry, 2021 – 2032
9.6.6.3.4 Touchless Sensing market Size & Forecast, By Component , 2021 – 2032
9.6.6.4 Egypt
9.6.6.4.1 Touchless Sensing market Size & Forecast, By Technology , 2021 – 2032
9.6.6.4.2 Touchless Sensing market Size & Forecast, By Product Type , 2021 – 2032
9.6.6.4.3 Touchless Sensing market Size & Forecast, By End-User Industry, 2021 – 2032
9.6.6.4.4 Touchless Sensing market Size & Forecast, By Component , 2021 – 2032
9.6.6.5 South Africa
9.6.6.5.1 Touchless Sensing market Size & Forecast, By Technology , 2021 – 2032
9.6.6.5.2 Touchless Sensing market Size & Forecast, By Product Type , 2021 – 2032
9.6.6.5.3 Touchless Sensing market Size & Forecast, By End-User Industry, 2021 – 2032
9.6.6.5.4 Touchless Sensing market Size & Forecast, By Component , 2021 – 2032
9.6.6.6 Rest of Middle East & Africa
9.6.6.6.1 Touchless Sensing market Size & Forecast, By Technology , 2021 – 2032
9.6.6.6.2 Touchless Sensing market Size & Forecast, By Product Type , 2021 – 2032
9.6.6.6.3 Touchless Sensing market Size & Forecast, By End-User Industry, 2021 – 2032
9.6.6.6.4 Touchless Sensing market Size & Forecast, By Component , 2021 – 2032
10. Competitive Landscape
10.1 Key Players' Positioning
10.2 Competitive Developments
10.2.1 Key Strategies Adopted (%), By Key Players, 2024
10.2.2 Year-Wise Strategies & Development, 2021 – 2025
10.2.3 Number Of Strategies Adopted By Key Players, 2024
10.3 Market Share Analysis, 2024
10.4 Product /Service & Interconnecting Analog Type Benchmarking
10.4.1 Product /Service Specifications & Features By Key Players
10.4.2 Product /Service Heatmap By Key Players
10.4.3 Interconnecting Analog Type Heatmap By Key Players
10.5 Industry Start-Up & Innovation Landscape
10.6 Key Company Profiles
10.6.1 Infineon Technologies AG
10.6.1.1 Company Overview & Snapshot
10.6.1.2 Product /Service Portfolio
10.6.1.3 Key Company Financials
10.6.1.4 SWOT Analysis
10.6.2 Apple Inc.
10.6.2.1 Company Overview & Snapshot
10.6.2.2 Product /Service Portfolio
10.6.2.3 Key Company Financials
10.6.2.4 SWOT Analysis
10.6.3 Google Inc.
10.6.3.1 Company Overview & Snapshot
10.6.3.2 Product /Service Portfolio
10.6.3.3 Key Company Financials
10.6.3.4 SWOT Analysis
10.6.4 XYZ Interactive
10.6.4.1 Company Overview & Snapshot
10.6.4.2 Product /Service Portfolio
10.6.4.3 Key Company Financials
10.6.4.4 SWOT Analysis
10.6.5 GestureTek
10.6.5.1 Company Overview & Snapshot
10.6.5.2 Product /Service Portfolio
10.6.5.3 Key Company Financials
10.6.5.4 SWOT Analysis
10.6.6 OmniVision Technologies, Inc.
10.6.6.1 Company Overview & Snapshot
10.6.6.2 Product /Service Portfolio
10.6.6.3 Key Company Financials
10.6.6.4 SWOT Analysis
10.6.7 Cognitech Systems GmbH
10.6.7.1 Company Overview & Snapshot
10.6.7.2 Product /Service Portfolio
10.6.7.3 Key Company Financials
10.6.7.4 SWOT Analysis
10.6.8 Microchip Technology Inc.
10.6.8.1 Company Overview & Snapshot
10.6.8.2 Product /Service Portfolio
10.6.8.3 Key Company Financials
10.6.8.4 SWOT Analysis
10.6.9 iPROOV Limited
10.6.9.1 Company Overview & Snapshot
10.6.9.2 Product /Service Portfolio
10.6.9.3 Key Company Financials
10.6.9.4 SWOT Analysis
10.6.10 Elliptic Labs
10.6.10.1 Company Overview & Snapshot
10.6.10.2 Product /Service Portfolio
10.6.10.3 Key Company Financials
10.6.10.4 SWOT Analysis
10.6.11 Lightricity Technologies
10.6.11.1 Company Overview & Snapshot
10.6.11.2 Product /Service Portfolio
10.6.11.3 Key Company Financials
10.6.11.4 SWOT Analysis
10.6.12 Sony Depth Sensing Solutions
10.6.12.1 Company Overview & Snapshot
10.6.12.2 Product /Service Portfolio
10.6.12.3 Key Company Financials
10.6.12.4 SWOT Analysis
10.6.13 Microsoft Corporation
10.6.13.1 Company Overview & Snapshot
10.6.13.2 Product /Service Portfolio
10.6.13.3 Key Company Financials
10.6.13.4 SWOT Analysis
10.6.14 Samsung Electronics
10.6.14.1 Company Overview & Snapshot
10.6.14.2 Product /Service Portfolio
10.6.14.3 Key Company Financials
10.6.14.4 SWOT Analysis
10.6.15 STMicroelectronics
10.6.15.1 Company Overview & Snapshot
10.6.15.2 Product /Service Portfolio
10.6.15.3 Key Company Financials
10.6.15.4 SWOT Analysis
10.6.16 Texas Instruments
10.6.16.1 Company Overview & Snapshot
10.6.16.2 Product /Service Portfolio
10.6.16.3 Key Company Financials
10.6.16.4 SWOT Analysis
10.6.17 Intel Corporation
10.6.17.1 Company Overview & Snapshot
10.6.17.2 Product /Service Portfolio
10.6.17.3 Key Company Financials
10.6.17.4 SWOT Analysis
10.6.18 Qualcomm Technologies, Inc.
10.6.18.1 Company Overview & Snapshot
10.6.18.2 Product /Service Portfolio
10.6.18.3 Key Company Financials
10.6.18.4 SWOT Analysis
10.6.19 Panasonic Holdings Corporation
10.6.19.1 Company Overview & Snapshot
10.6.19.2 Product /Service Portfolio
10.6.19.3 Key Company Financials
10.6.19.4 SWOT Analysis
10.6.20 Toshiba Corporation
10.6.20.1 Company Overview & Snapshot
10.6.20.2 Product /Service Portfolio
10.6.20.3 Key Company Financials
10.6.20.4 SWOT Analysis
11. Analyst Recommendations
11.1 SNS Insider Opportunity Map
11.2 Industry Low-Hanging Fruit Assessment
11.3 Market Entry & Growth Strategy
11.4 Analyst Viewpoint & Suggestions On Market Growth
12. Assumptions
13. Disclaimer
14. Appendix
14.1 List Of Tables
14.2 List Of Figures
Key Segments:
By Technology
-
Infrared (IR)
-
Ultrasound
-
Capacitive / Proximity
-
Camera-based
-
RFID / NFC
By Product Type
-
Touchless Biometric Devices
-
Gesture-Recognition Controllers
-
Sanitary Equipment
-
Interactive Kiosks / Screens
By End-User Industry
-
Consumer Electronics
-
Healthcare and Life-Sciences
-
Automotive and Transportation
-
BFSI and Retail
-
Industrial and Logistics
By Component
-
Hardware
-
Software
-
Services
Request for Segment Customization as per your Business Requirement: Segment Customization Request
Regional Coverage:
North America
-
US
-
Canada
Europe
-
Germany
-
UK
-
France
-
Italy
-
Spain
-
Russia
-
Poland
-
Rest of Europe
Asia Pacific
-
China
-
India
-
Japan
-
South Korea
-
Australia
-
ASEAN Countries
-
Rest of Asia Pacific
Middle East & Africa
-
UAE
-
Saudi Arabia
-
Qatar
-
South Africa
-
Rest of Middle East & Africa
Latin America
-
Brazil
-
Argentina
-
Mexico
-
Colombia
-
Rest of Latin America
Request for Country Level Research Report: Country Level Customization Request
Available Customization
With the given market data, SNS Insider offers customization as per the company’s specific needs. The following customization options are available for the report:
-
Detailed Volume Analysis
-
Criss-Cross segment analysis (e.g. Product X Application)
-
Competitive Product Benchmarking
-
Geographic Analysis
-
Additional countries in any of the regions
-
Customized Data Representation
-
Detailed analysis and profiling of additional market players
An accurate research report requires proper strategizing as well as implementation. There are multiple factors involved in the completion of good and accurate research report and selecting the best methodology to compete the research is the toughest part. Since the research reports we provide play a crucial role in any company’s decision-making process, therefore we at SNS Insider always believe that we should choose the best method which gives us results closer to reality. This allows us to reach at a stage wherein we can provide our clients best and accurate investment to output ratio.
Each report that we prepare takes a timeframe of 350-400 business hours for production. Starting from the selection of titles through a couple of in-depth brain storming session to the final QC process before uploading our titles on our website we dedicate around 350 working hours. The titles are selected based on their current market cap and the foreseen CAGR and growth.
The 5 steps process:
Step 1: Secondary Research:
Secondary Research or Desk Research is as the name suggests is a research process wherein, we collect data through the readily available information. In this process we use various paid and unpaid databases which our team has access to and gather data through the same. This includes examining of listed companies’ annual reports, Journals, SEC filling etc. Apart from this our team has access to various associations across the globe across different industries. Lastly, we have exchange relationships with various university as well as individual libraries.

Step 2: Primary Research
When we talk about primary research, it is a type of study in which the researchers collect relevant data samples directly, rather than relying on previously collected data. This type of research is focused on gaining content specific facts that can be sued to solve specific problems. Since the collected data is fresh and first hand therefore it makes the study more accurate and genuine.
We at SNS Insider have divided Primary Research into 2 parts.
Part 1 wherein we interview the KOLs of major players as well as the upcoming ones across various geographic regions. This allows us to have their view over the market scenario and acts as an important tool to come closer to the accurate market numbers. As many as 45 paid and unpaid primary interviews are taken from both the demand and supply side of the industry to make sure we land at an accurate judgement and analysis of the market.
This step involves the triangulation of data wherein our team analyses the interview transcripts, online survey responses and observation of on filed participants. The below mentioned chart should give a better understanding of the part 1 of the primary interview.

Part 2: In this part of primary research the data collected via secondary research and the part 1 of the primary research is validated with the interviews from individual consultants and subject matter experts.
Consultants are those set of people who have at least 12 years of experience and expertise within the industry whereas Subject Matter Experts are those with at least 15 years of experience behind their back within the same space. The data with the help of two main processes i.e., FGDs (Focused Group Discussions) and IDs (Individual Discussions). This gives us a 3rd party nonbiased primary view of the market scenario making it a more dependable one while collation of the data pointers.
Step 3: Data Bank Validation
Once all the information is collected via primary and secondary sources, we run that information for data validation. At our intelligence centre our research heads track a lot of information related to the market which includes the quarterly reports, the daily stock prices, and other relevant information. Our data bank server gets updated every fortnight and that is how the information which we collected using our primary and secondary information is revalidated in real time.

Step 4: QA/QC Process
After all the data collection and validation our team does a final level of quality check and quality assurance to get rid of any unwanted or undesired mistakes. This might include but not limited to getting rid of the any typos, duplication of numbers or missing of any important information. The people involved in this process include technical content writers, research heads and graphics people. Once this process is completed the title gets uploader on our platform for our clients to read it.
Step 5: Final QC/QA Process:
This is the last process and comes when the client has ordered the study. In this process a final QA/QC is done before the study is emailed to the client. Since we believe in giving our clients a good experience of our research studies, therefore, to make sure that we do not lack at our end in any way humanly possible we do a final round of quality check and then dispatch the study to the client.