Ethernet PHY Chip Market Size & Growth:
The Ethernet PHY Chip Market size was valued at USD 11.76 billion in 2025 and is expected to reach USD 27.62 billion by 2035 and grow at a CAGR of 8.91% over the forecast period of 2026-2035.
The global market consists of detailed ethernet PHY chip market analysis over regional markets, market drivers, challenges and segmentation by data rate, type, integration type, and verticals for various end-user applications. This primarily driven by the implementation of high-speed Ethernet networks globally, increasing need for low-latency communications, and increasing adoption of cloud computing, IoT, and 5G infrastructure. This combination of factors is pushing more Ethernet PHY chips to be deployed across multiple vertical application segments.
For instance, over 70% of newly constructed hyperscale data centers incorporate multi-rate Ethernet PHYs for scalability and backward compatibility.
Market Size and Forecast:
-
Market Size in 2025: USD 11.76 Billion
-
Market Size by 2035: USD 27.62 Billion
-
CAGR: 8.91% from 2026 to 2035
-
Base Year: 2025
-
Forecast Period: 2026–2035
-
Historical Data: 2022–2024

To Get more information On Ethernet PHY Chip Market - Request Free Sample Report
Ethernet PHY Chip Market Trends:
-
Growing Demand for High‑Speed Networking: Increasing deployment of 5G infrastructure, data centers, and enterprise networks is driving demand for high‑speed Ethernet PHY chips that support 25G, 50G, 100G, and beyond connectivity.
-
Shift to Cloud and Hyperscale Architectures: Expansion of cloud computing and hyperscale data centers is accelerating the adoption of advanced PHY technologies that provide low latency, high throughput, and energy‑efficient performance.
-
Rise of AI and Edge Computing: Integration of AI workloads and edge computing architectures is boosting the requirement for robust PHY solutions that deliver reliable, high‑bandwidth connectivity in distributed and latency‑sensitive applications.
-
Industrial and Automotive Ethernet Adoption: The proliferation of Industrial Ethernet and automotive networking (e.g., ADAS, autonomous vehicles, Industrial IoT) is creating new opportunities for ruggedized and automotive‑grade PHY chips with enhanced reliability and extended temperature operation.
The U.S. Ethernet PHY Chip Market size was USD 2.93 billion in 2025 and is expected to reach USD 5.66 billion by 2035, growing at a CAGR of 8.62% over the forecast period of 2026–2035.
In the U.S. market, this growth is primarily driven by strong investments in next-generation data centers, the development of high-speed broadband infrastructure, and increasing adoption of automotive ADAS systems with integrated Ethernet PHY chips and expanding applications in industrial automation. Demand is being further boosted by the existence of top semiconductor companies and abundant federal technology push for digital transformation projects. Such factors together make the U.S., a significant center for the global Ethernet PHY chip market growth.
For instance, over 60% of the U.S. manufacturing plants now deploy Ethernet-based control networks, requiring rugged PHY chip solutions.

Ethernet PHY Chip Market Drivers:
-
Rising Deployment of High-Speed Data Centers Across Developed and Emerging Economies Boosts Market Growth Rapidly
Increasing utilization of high-speed data centers, particularly in developed and developing nations are rapidly driving the market due to the associated high-speed data transfer demand. The transformation of businesses to cloud and virtual modes have created a high demand for Ethernet PHY chips that offer high-speed and low-latency communication capabilities. They come with Ethernet PHYs for physical-layer connectivity, delivering bandwidth, and lossless packet transport within data centers. The growing trend of low-power, high-speed communication chips for AI and machine learning processing further compels Ethernet PHY to become a central facilitator of this global digital infrastructure expansion.
For instance, over 94% of workloads in 2024 were processed by cloud-based data centers, heavily relying on high-speed Ethernet PHYs.
Ethernet PHY Chip Market Restraints:
-
Growing Shift Toward Wireless Communication Technologies Poses Threat to Ethernet PHY Demand
Trend to wireless communication technologies is further evidence that demand for Ethernet PHYs is at risk as companies shift to flexible, cable-free networking solutions. Wi-Fi 6/6E, 5G, and Bluetooth Low Energy are becoming increasingly popular for large volume production due to their easy scalability and low installation cost and adequate data rates for the majority of applications. Wireless solutions minimize the burden of physical infrastructure, affecting wired Ethernet PHY solutions related to IoT devices and remote monitoring setups. One of the key ethernet PHY chip market trends is wireless shift. While this is not a full-on replacement, it reduces the growth potential for PHYs in consumer devices and some enterprise-level applications as time goes on.
Ethernet PHY Chip Market Opportunities:
-
Emergence of 5G Infrastructure and Edge Computing Opens Lucrative Avenues for Ethernet PHY Applications
The increasing data traffic and ultra-low latency requirements on 5G infrastructure and edge computing create attractive opportunities for new Ethernet PHY applications. Dense high-speed fronthaul and backhaul links are essential for 5G deployment, and Ethernet PHY chips help enable both fiber and copper-based connectivity. Margin and Edge, Edge computing systems, on the other hand, are built on real-time propagation of data with central servers. Ethernet PHYs guarantee robust and resilient physical connections between distributed nodes. This wide array of applications generates demand for new multi-rate, energy-efficient PHY chips tailored for outdoor and embedded environments.
For instance, edge computing setups can involve over 1000 nodes per square kilometer in urban deployments, demanding reliable PHY layer connections.
Ethernet PHY Chip Market Challenges:
-
Supply Chain Disruptions and Semiconductor Shortages Create Uncertainty in Production and Delivery Timelines Globally
Global supply chain disruptions and shortages of semiconductor parts have implications for uncertain production and shipment timelines for major Ethernet PHY vendors. Raw material scarcities, wafer shortages, and geopolitical trade tensions have made critical components hit or miss at best. Longer lead times for fab production and assembly are delaying shipments and customer projects and this hinders planning for OEMs and mass deployment. At the same time, vendors need to balance sustainable ongoing production against rising procurement costs and pressure to diversify sourcing. The best PHY solution may not mean much if it cannot hit the market in a timely manner, and that comes down to supply chain resilience.
Ethernet PHY Chip Market Segmentation Analysis:
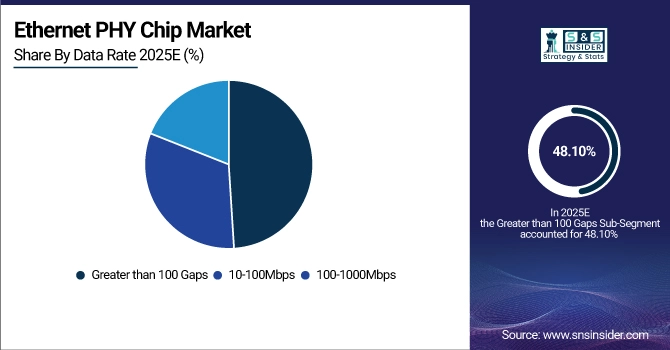
By Data Rate
Greater than 100 Gbps segment held the top position in the Ethernet PHY Chip Market accounting for the largest revenue share of approximately 48.10%, and is anticipated to grow with the fastest CAGR during the forecast period of 2026-2035 of around 9.08%. The figures also point out this strong hold due to the growing demand for ultra-fast data rates for new hyperscale data centers, AI/ML computing, and top-tier telecom infrastructure. High-performance networking integrated circuits (ICs) from companies, such as Broadcom Inc. provide some of the latest PHY chips that are optimized for 400G and 800G Ethernet, ensuring massive data workloads are executed in cloud and high-performance computing environments.
By Device Type
Switches segment held the largest revenue contributing for about 35.10% of ethernet PHY chip market share in 2025. Such dominance is also the result of wide-deployment on enterprise network, data center and cloud infrastructure where stable and high-speed physical-layer connectivity is essential. Intel Corporation, the company that provides some of the key components, Ethernet switch PHY used in the transmission guardy to ensure very low-latency transmission and high reliability in a dense networking environment globally.
The IoT / Consumer Devices segment is expected to be the fastest-growing segment with a compound annual growth rate (CAGR) of about 11.47% during 2026-2035. Beneath the rapid growth of smart homes, wearables and other connected electronics lies an increasing need for compact and low-power PHY solutions. Market players constituting bandwidth dominance include integrated Ethernet Pioneers for consumer electronics, such as Realtek Semiconductor Corp. that offer effective connectivity in smart appliances, entertainment devices, and edge IoT applications.
By Integration Type
In 2025, Discrete PHY Chips segment led the Ethernet PHY Chip Market with maximum revenue share of 56.80%. Its dominance is attributed to its flexibility and adoption in stand-alone networking elements and its versatility in accommodating different Ethernet standards. White Papers Microchip Technology Inc. is a leading provider of discrete Ethernet PHY for industrial, automotive and communications end markets, and a world-renowned supplier of semiconductor solutions, enabling developers to customize their network solution to best meet application requirements.
The Integrated PHY in SoCs segment is anticipated to witness the fastest growth at a CAGR of approximately 9.73% during 2026-2035 due to its growing use in developing miniature SoCs. Increasing demand for miniaturized, cost-effective solutions for mobile, automotive, and IoT applications is driving adoption. At the other end of the spectrum, the PHY can be built into the silicon, as is the case for Qualcomm Technologies and its Snapdragon SoCs, which can offer solutions that are compact and energy-efficient while being suitable for edge devices, connected vehicles, and other ultra-compact electronic devices.
By End-User
In 2025, IT and Telecommunications segment generated the maximum revenue share holding over 32.70% revenue of overall Ethernet PHY Chip Market. This is fueled by continued development of telecom infrastructure, expansion of cloud services, and broad adoption of Ethernet PHY in base stations, data servers, and telecom routers. Cisco Systems Inc. uses PHY chips in its high-end networking hardware, which are fundamental to global data transport and internet backbone infrastructure.
The automotive segment is anticipated to witness the fastest CAGR of 10.12% over the forecast period of 2026-2035. Fuelled by the swift adoption of ethernet for ADAS, infotainment, and autonomous driving applications. This transformation is being spearheaded by NXP Semiconductors with automotive-grade Ethernet PHYs that can accommodate the stringent EMI and latency requirements of connected vehicles.
Ethernet PHY Chip Market Regional Overview:
In 2025, North America has the highest revenue share of around 37.50% on the Ethernet PHY Chip Market, and it will continue to achieve this revenue share during the forecast period. The advanced infrastructure data centers, early evolution of 5G and strong industrial automation trends are the key contributors to this leadership in the U.S. and Canada. In addition to this, the region benefits from the global chip manufacturing industry and regulatory guidance favoring digital transformation.

Get Customized Report as per Your Business Requirement - Enquiry Now
-
The U.S. dominates the North American Ethernet PHY Chip Market due to its advanced data center infrastructure, early 5G deployment, strong presence of key semiconductor companies, and significant investments in industrial automation and high-speed networking technologies.
Asia Pacific is projected to have the highest growth rate, with nearly 8.82% CAGR over 2026-2035. This growth is propelled by the faster digitization of emerging markets, the growing 5G rollout, and the growing demand for smart consumer electronics. The regional market for Ethernet PHY chips is also gaining from the key investments in semiconductor manufacturing hubs considering growing roles of China, Taiwan, and India.
-
China leads the Asia Pacific market owing to massive investments in semiconductor manufacturing, rapid 5G network expansion, strong demand for connected consumer electronics, and government-backed digital infrastructure initiatives supporting Ethernet-based solutions across telecom, automotive, and industrial sectors.
Europe holds substantial potential in the Ethernet PHY Chip Market, owing to the rising implementation of industrial automation, smart manufacturing, and high-speed connectivity at enterprise-level. The market growth can be ascribed to the Industry 4.0 initiatives adopted by countries such as Germany and France, coupled with investments in data centers and 5G rollout. So, key automotive OEMs also helps in increasing the integration of ethernet PHY in vehicles.
-
Germany dominates the European Ethernet PHY Chip industry due to its strong industrial automation sector, leadership in automotive manufacturing, and early adoption of Industry 4.0 technologies. High investments in smart factories and high-speed networking infrastructure further strengthen its market position.
UAE leads the Middle East & Africa Ethernet PHY Chip Market as the country investing heavily in smart city projects, the growth of data center, and 5G rollout. Brazil accounts for most of the share in Latin America, which can be attributed to the increasing broadband infrastructure, telecom upgrades, and a high demand for Ethernet solutions used in industrial and enterprise digital transformation initiatives.
Ethernet PHY Chip Market Companies are:
-
Broadcom Inc.
-
Marvell Technology, Inc.
-
Intel Corporation
-
Texas Instruments Incorporated
-
Microchip Technology Inc.
-
NXP Semiconductors N.V.
-
STMicroelectronics N.V.
-
Analog Devices, Inc.
-
Qualcomm Technologies, Inc.
-
Realtek Semiconductor Corp.
-
Renesas Electronics Corporation
-
Silicon Labs
-
MediaTek Inc.
-
Onsemi (ON Semiconductor)
-
Maxim Integrated
-
Infineon Technologies AG
-
Lattice Semiconductor Corporation
-
Cirrus Logic, Inc.
-
MACOM Technology Solutions
-
Microsemi Corporation
competitive landscape for the Ethernet PHY Chip Market:
Broadcom Inc.
Broadcom Inc. is a U.S.-based semiconductor leader, specializing in Ethernet PHY chips, networking solutions, and broadband connectivity. The company designs, develops, and supplies high-performance chips for data centers, enterprise networking, and broadband applications. Broadcom operates globally, providing end-to-end solutions across hardware and software layers, enabling high-speed, reliable, and energy-efficient networking infrastructures. Its role in the Ethernet PHY chip market is vital, as it delivers scalable and robust solutions for cloud service providers, telecom operators, and enterprise networks, driving high-speed data transfer and connectivity efficiency.
-
In 2025, Broadcom introduced its next-generation 25G/50G Ethernet PHY chips, featuring low-latency architecture, energy-efficient design, and broad interoperability across enterprise and hyperscale data center platforms.
Marvell Technology, Inc.
Marvell Technology, Inc. is a U.S.-headquartered semiconductor company focused on networking, storage, and Ethernet solutions. It develops high-performance PHY chips, switches, and controllers optimized for cloud, 5G, and enterprise networking applications. Marvell’s product portfolio emphasizes integration, power efficiency, and scalability, supporting the evolving needs of modern networks. Its role in the Ethernet PHY chip market is significant, providing innovative solutions that enhance bandwidth, reliability, and network intelligence across multiple segments.
-
In 2025, Marvell launched a family of 400G Ethernet PHY solutions for hyperscale and enterprise data centers, combining advanced SerDes technology with integrated security features to support next-generation high-speed networking.
Intel Corporation
Intel Corporation is a U.S.-based technology giant, offering a wide range of computing, networking, and Ethernet solutions. The company designs and manufactures Ethernet PHY chips that support data center, cloud, and enterprise networking applications. Intel focuses on performance, interoperability, and energy efficiency in its PHY solutions, enabling high-speed connectivity and intelligent network management. Its role in the Ethernet PHY chip market is crucial, as it provides reliable and scalable solutions that meet growing demand for bandwidth and connectivity in modern IT infrastructures.
-
In 2025, Intel expanded its Ethernet PHY lineup with 200G and 400G solutions optimized for AI workloads and cloud networking, providing enhanced throughput, low latency, and flexible deployment options.
Texas Instruments Incorporated
Texas Instruments Incorporated (TI) is a U.S.-based semiconductor company specializing in analog, embedded processing, and networking solutions. The company develops Ethernet PHY chips for industrial, automotive, and enterprise networking applications. TI’s PHY solutions emphasize robustness, reliability, and precision, supporting both high-speed data transfer and harsh environmental conditions. Its role in the Ethernet PHY chip market is vital, delivering energy-efficient and cost-effective solutions that enable secure, scalable, and long-life network deployments.
-
In 2025, Texas Instruments launched a new series of industrial Ethernet PHY chips featuring extended temperature ranges, enhanced EMI immunity, and integrated diagnostics for smart manufacturing and automotive networking systems.
| Report Attributes | Details |
|---|---|
| Market Size in 2025 | USD 11.76 Billion |
| Market Size by 2035 | USD 27.62 Billion |
| CAGR | CAGR of 8.91% From 2026 to 2035 |
| Base Year | 2025 |
| Forecast Period | 2026-2035 |
| Historical Data | 2022-2024 |
| Report Scope & Coverage | Market Size, Segments Analysis, Competitive Landscape, Regional Analysis, DROC & SWOT Analysis, Forecast Outlook |
| Key Segments | • By Data Rate (10-100Mbps, 100-1000Mbps and Greater than 100 Gaps) • By Device Type (Switches, Automotive, Telecom Equipment, IoT / Consumer Devices, Industrial Automation Hardware and Servers / NICs) • By Integration type (Discrete PHY Chips, Integrated PHY in SoCs and Integrated in ASICs / FPGAs) • By End-User (Automotive, IT and Telecommunications, Consumer Electronics, Industrial and Others) |
| Regional Analysis/Coverage | North America (US, Canada, Mexico), Europe (Germany, France, UK, Italy, Spain, Poland, Turkey, Rest of Europe), Asia Pacific (China, India, Japan, South Korea, Singapore, Australia,Taiwan, Rest of Asia Pacific), Middle East & Africa (UAE, Saudi Arabia, Qatar, South Africa, Rest of Middle East & Africa), Latin America (Brazil, Argentina, Rest of Latin America) |
| Company Profiles | Broadcom Inc., Marvell Technology, Inc., Intel Corporation, Texas Instruments Incorporated, Microchip Technology Inc., NXP Semiconductors N.V., STMicroelectronics N.V., Analog Devices, Inc., Qualcomm Technologies, Inc., Realtek Semiconductor Corp., Renesas Electronics Corporation, Silicon Labs, MediaTek Inc., Onsemi (ON Semiconductor), Maxim Integrated, Infineon Technologies AG, Lattice Semiconductor Corporation, Cirrus Logic, Inc., MACOM Technology Solutions and Microsemi Corporation. |
Get in Touch
