image

Urban Air Mobility Market Report Scope & Overview:

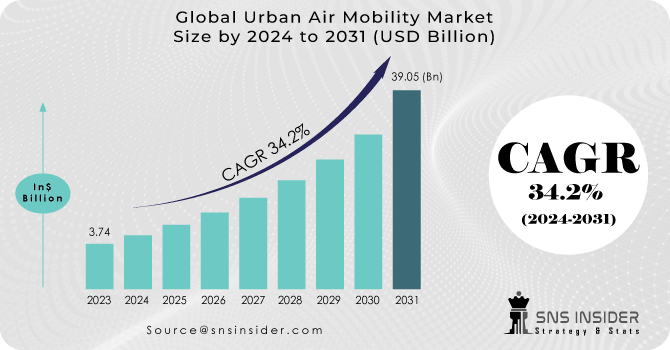
The Urban Air Mobility Market size was valued at USD 3.74 Billion in 2023 and is projected to reach USD 39.05 billion by 2031 with a growing CAGR of 34.2% Over the Forecast Period of 2024-2031.

Urban air mobility, also known as advanced air mobility, is a novel concept that envisions an accessible, safe, cost-effective, and crises, long-term air transportation system for delivering freight and moving people within urban regions. UAM is a component of a larger on-demand mobility ecosystem in which consumers can dispatch or use urban aviation services, shared automated vehicles, courier services, public transportation, shared mobility, and other cutting-edge and emerging transportation technologies to access mobility and goods delivery services on demand. This might help alleviate the strain on many constantly overloaded infrastructures, such as those in fast-increasing cities.

Urban Air Mobility Market Revenue Analysis

To get more information on Urban Air Mobility Market - Request Free Sample Report

Without question, traffic congestion wastes a substantial amount of time every day throughout the world. People become stuck in traffic on their way to work or home, wasting fuel and decreasing productivity. This also has an influence on the urban economy. If we do not pick new sustainable solutions, we will not be able to regulate traffic congestion and its disastrous consequences. Transportation by air in cities can assist in alleviating traffic congestion. Today, leading transport companies are using new technologies and planning to construct intelligent aerial vehicles for urban air mobility.

Flying taxi services, drones, and electric aircraft will increase transportation efficacy and efficiency. These factors are expected to boost demand for urban air mobility (UAM) in the future years. However, the greater initial investment required for R&D and infrastructure development for urban air mobility is expected to stifle the growth of the Urban Air Mobility (UAM) Market.

The industry is devoting significant resources to the study and development of innovative and distinctive methods for sustainable transportation networks. Product launches, mergers and acquisitions, collaborations, partnerships, and the refurbishment of existing technology are examples of these tactics. In 2021, Hyundai Motor and Uber announced a collaboration to build new Uber Air taxis for future urban mobility called the SA-1, which is an electric-powered vertical takeoff and landing vehicle. In 2022, for example, Volocopter, the pioneer in urban air mobility, announced a collaboration with Microsoft to offer and build a cloud-based computer system for the company's autonomous flying vehicles urban air mobility vehicles, and eVotel.

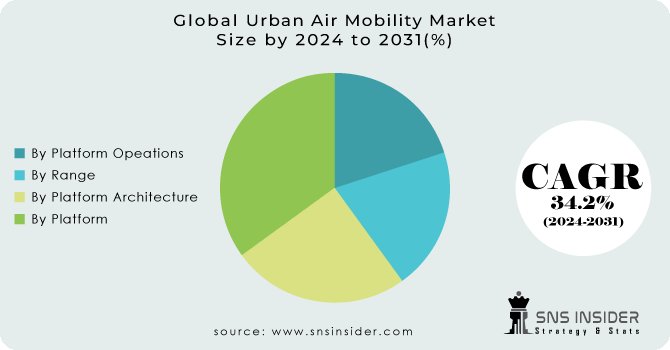
The worldwide urban air mobility market is divided into platform, platform operations, range, platform architecture, and region segments. The market is divided into platforms such as air shuttles and air metro, air taxis, personal air vehicles, air ambulances and medical emergency vehicles, freight air vehicles, and last-mile delivery vehicles. The market is divided into two ranges: intercity and intracity. The market is divided into two categories based on platform operations: piloted and autonomous. The market is divided into two segments based on platform architecture: rotary wings and fixed-wing hybrids. The market is divided into four regions: Asia-Pacific, Europe, North America, and Latin America and the Caribbean.

MARKET DYNAMICS

DRIVERS:

  • UAM aims to provide efficient transportation solutions, allowing people to move quickly between urban centers and suburban areas.

  • Technological Innovation is the driver of the Urban Air Mobility Market.

Advances in electric propulsion, battery technology, lightweight materials, and autonomous systems have made it possible to design and manufacture electric Vertical Takeoff and Landing (eVTOL) aircraft, which are the foundation of UAM. These technologies enable quieter, more efficient, and environmentally friendly modes of transportation within urban areas.

RESTRAIN:

  • UAM requires a network of vertiports or landing pads for takeoff and landing within urban areas.

  • Noise Pollution is the restraint of the Urban Air Mobility Market.

While electric aircraft are generally quieter than traditional combustion-engine vehicles, the noise generated during takeoff and landing can still be a concern for densely populated urban areas. Striking a balance between efficient operations and minimizing noise pollution is essential for public acceptance.

OPPORTUNITY:

  • A flourishing UAM market can drive economic growth by spurring investments in research, development, manufacturing, and infrastructure.

  • Tourism and Mobility Services are an opportunity for the Urban Air Mobility Market.

UAM can enhance tourism experiences by offering scenic aerial tours of cities and landmarks. Additionally, it can enable new types of mobility services, such as on-demand air taxis and ridesharing in urban and suburban areas.

CHALLENGES:

  • Establishing a network of vertiports, helipads, and charging stations in urban and suburban areas is a major challenge.

  • Regulatory Framework are the challenges of the Urban Air Mobility Market.

Developing and implementing regulations that ensure the safe integration of autonomous and semi-autonomous UAM vehicles into urban airspace is a complex task. Striking the right balance between innovation and safety while accommodating the needs of different stakeholders is a challenge.

IMPACT OF RUSSIAN UKRAINE WAR

Civil aviation operations in Ukraine halted with the outbreak of the conflict in 2022 when the government closed its airspace. Because they were unable to flee by air, Ukrainians seeking refuge from the war trekked by land to airports in surrounding nations. Flight bookings in Hungary, Poland, and Romania surged by 10-20% in the first month of the conflict, with a dramatic rise in outbound reservations reaching a maximum of more than 60% as considerably more one-way tickets were booked than normal.

In Ukraine, the government announced that as of 2022, 12 of the country's 19 civilian airports had been damaged, including airports that had just completed infrastructural renovations, such as Dnipro and Odesa. In the same month, Ukraine reported estimates of USD 96 billion in infrastructure losses, including USD 6 billion for airports and air navigation systems, during the Ukraine Recovery Conference in Lugano, Switzerland. The majority of these losses (USD 4.38 billion) were incurred by Ukraine's airlines as a result of zero passenger activity. Airports (USD 470 million), Ukraine's governmental air traffic service (Ukraerorukh, USD 260 million), and other commercial airport activities accounted for the balance.

IMPACT OF ONGOING RECESSION

When compared to other businesses such as software, retail, finance, and e-commerce, the aerospace industry usually has a considerably longer business cycle. In reality, the aircraft sector has just recently emerged from a slump caused by the epidemic. It is now on an upward trend and is projected to remain so for some time. The aerospace sector, which includes research, development, and production of systems, electronics, and equipment for both civil and defence markets, is now experiencing a global boom and is unlikely to see any worrisome symptoms of recession. Eaton, Aerospace Group, Asia Pacific, a Dublin-based intelligent power management firm with a 2022 sales forecast of more than $22-23 billion. In this ongoing recession, the Urban Air Mobility Market is gaining profit by 2.2-2.6%.

KEY MARKET SEGMENTATION

By Platform

  • Air Shuttles and & Air Metro

  • Air Taxis, Cargo Air Vehicles

  • Personal Air Vehicles

  • Last-mile Delivery Vehicles

  • Air Ambulance & Medical Emergency Vehicles

By Platform Opeations

  • Autonomous

  • Piloted

By Range

  • Intracity

  • Intercity

By Platform Architecture

  • Fixed Wing Hybrid

  • Rotory Wing

Urban Air Mobility Market Segmentation Analysis

Need any customization research on Urban Air Mobility Market - Enquiry Now

REGIONAL COVERAGE:

North America

  • US

  • Canada

  • Mexico

Europe

  • Eastern Europe

    • Poland

    • Romania

    • Hungary

    • Turkey

    • Rest of Eastern Europe

  • Western Europe

    • Germany

    • France

    • UK

    • Italy

    • Spain

    • Netherlands

    • Switzerland

    • Austria

    • Rest of Western Europe

Asia Pacific

  • China

  • India

  • Japan

  • South Korea

  • Vietnam

  • Singapore

  • Australia

  • Rest of Asia Pacific

Middle East & Africa

  • Middle East

    • UAE

    • Egypt

    • Saudi Arabia

    • Qatar

    • Rest of Middle East

  • Africa

    • Nigeria

    • South Africa

    • Rest of Africa

Latin America

  • Brazil

  • Argentina

  • Colombia

  • Rest of Latin America

REGIONAL ANALYSIS

North America: In terms of market size, North America held the greatest share in 2021. In comparison to other places, the region dominates this market. The presence of the Boeing Company has also contributed to the creation of a favourable environment for the industry since the company is significantly investing in the production of prototypes for assessment. In terms of embracing this contemporary means of transportation, the United States is leading the way in North America. Many American start-ups are partnering on a local level to develop and implement these technologies. Over the following 5-6 years, a plan for bringing the UAM into commercial use will be developed. The increased use of air taxis and airport shuttle services among inhabitants of major North American cities is fuelling their popularity.

Asia Pacific: In 2021, Asia-Pacific led the worldwide market and is expected to remain the fastest-growing sub-segment during the forecast period. In recent years, the Asia-Pacific market for urban air mobility has grown at an exponential rate due to urban traffic congestion and the necessity for fast travel. Over the next few years, the Asia-Pacific urban air mobility market is expected to be driven by increased R&D expenditure as well as a growing focus on enhancing air mobility. For example, in June 2022, Ehang Holdings Limited, the world's leading autonomous vehicle technology platform company, and Tianxingjian Cultural Tourism Investment and Development LLC, a Hunan province government enterprise in China, signed a contract for 25 units of EH216 urban air mobility vehicles to promote aerial tourism.

Key Players

Some major key players in the Urban Air Mobility Market are Volocopter GmbH, Neva Aerospace, Kitty Hawk, Pipistrel Group, EHang, Lilium, Airbus, Workhorse Group Inc., Opener, The Boeing Company and other players.

Volocopter GmbH-Company Financial Analysis

Company Landscape Analysis

RECENT DEVELOPMENTS:

In 2023: Geely Aerofugia, a subsidiary of Chinese manufacturer Geely, announced the completion of a test flight of its prototype flying car AE200, bringing it one step closer to delivering electric vertical take-off and landing (eVTOL) cars to market. In 2022, this business displayed a full-scale prototype for the TF-2 five-seater eVTOL.

In 2022: Eve UAM LLC joined forces with SkyportsPte Ltd to create a new Concept of Operations for Advanced Air Mobility for the Japan Civil Aviation Bureau. The initiative's goal is to present a vision of operation, infrastructure, and airspace design that will allow AAM operations in Japan. Partners in the partnership include Kanematsu Corporation and Japan Airlines.

Urban Air Mobility Market Report Scope:

Report Attributes Details
Market Size in 2023  US$ 3.74 Bn
Market Size by 2031  US$ 39.05 Bn
CAGR   CAGR of 34.2% From 2024 to 2031
Base Year  2023
Forecast Period  2024-2031
Historical Data  2020-2022
Report Scope & Coverage Market Size, Segments Analysis, Competitive  Landscape, Regional Analysis, DROC & SWOT Analysis, Forecast Outlook
Key Segments • By Platform (Air Shuttles and & Air Metro, Air Taxis, Cargo Air Vehicles, Personal Air Vehicles, Last-mile Delivery Vehicles, Air Ambulance & Medical Emergency Vehicles)
• By Platform Opeations (Autonomous, Piloted)
• By Range (Intracity, Intercity)
• By Platform Architecture (Fixed Wing Hybrid, Rotory Wing)
Regional Analysis/Coverage North America (US, Canada, Mexico), Europe (Eastern Europe [Poland, Romania, Hungary, Turkey, Rest of Eastern Europe] Western Europe] Germany, France, UK, Italy, Spain, Netherlands, Switzerland, Austria, Rest of Western Europe]), Asia Pacific (China, India, Japan, South Korea, Vietnam, Singapore, Australia, Rest of Asia Pacific), Middle East & Africa (Middle East [UAE, Egypt, Saudi Arabia, Qatar, Rest of Middle East], Africa [Nigeria, South Africa, Rest of Africa], Latin America (Brazil, Argentina, Colombia Rest of Latin America)
Company Profiles Volocopter GmbH, Neva Aerospace, Kitty Hawk, Pipistrel Group, EHang, Lilium, Airbus, Workhorse Group Inc., Opener, The Boeing Company 
Key Drivers • UAM aims to provide efficient transportation solutions, allowing people to move quickly between urban centers and suburban areas.
• Technological Innovation is the driver of the Urban Air Mobility Market.
Market Challenges • Establishing a network of vertiports, helipads, and charging stations in urban and suburban areas is a major challenge.
• Regulatory Framework are the challenges of the Urban Air Mobility Market.


Frequently Asked Questions

Ans. The Compound Annual Growth rate for the Urban Air Mobility Market over the forecast period is 34.2%

Ans. Urban Air Mobility Market size is projected to reach USD 39.05 Billion by 2031.

Ans. The Urban Air Mobility Market is anticipated to reach USD 3.74 Billion by 2023.

Ans. The market's dominant sector is the air ambulance vehicle type segment.

Ans. In terms of market share, North America led the industry in 2022.

Table of Contents

1. Introduction
1.1 Market Definition
1.2 Scope
1.3 Research Assumptions

2. Research Methodology

3. Market Dynamics
3.1 Drivers
3.2 Restraints
3.3 Opportunities
3.4 Challenges

4. Impact Analysis
4.1 Impact of Russia-Ukraine War
4.2 Impact of Ongoing Recession
4.2.1 Introduction
4.2.2 Impact on major economies
4.2.2.1 US
4.2.2.2 Canada
4.2.2.3 Germany
4.2.2.4 France
4.2.2.5 United Kingdom
4.2.2.6 China
4.2.2.7 Japan
4.2.2.8 South Korea
4.2.2.9 Rest of the World

5. Value Chain Analysis

6. Porter’s 5 forces model

7. PEST Analysis

8. Urban Air Mobility Market Segmentation, By Platform
8.1 Air Shuttles and & Air Metro
8.2 Air Taxis, Cargo Air Vehicles
8.3 Personal Air Vehicles
8.4 Last-mile Delivery Vehicles
8.5 Air Ambulance & Medical Emergency Vehicles

9. Urban Air Mobility Market Segmentation, By Platform Opeations
9.1 Autonomous
9.2 Piloted

10. Urban Air Mobility Market Segmentation, By Range
10.1 Intracity
10.2 Intercity

11. Urban Air Mobility Market Segmentation, By Platform Architecture
11.1 Fixed Wing Hybrid
11.2 Rotory Wing

12. Regional Analysis
12.1 Introduction
12.2 North America
12.2.1 North America Urban Air Mobility Market by Country
12.2.2 North America Urban Air Mobility Market by Platform
12.2.3 North America Urban Air Mobility Market by Platform Opeations
12.2.4 North America Urban Air Mobility Market by Range
12.2.5 North America Urban Air Mobility Market by Platform Architecture
12.2.6 USA
12.2.6.1 USA Urban Air Mobility Market by Platform
12.2.6.2 USA Urban Air Mobility Market by Platform Opeations
12.2.6.3 USA Urban Air Mobility Market by Range
12.2.6.4 USA Urban Air Mobility Market by Platform Architecture
12.2.7 Canada
12.2.7.1 Canada Urban Air Mobility Market by Platform
12.2.7.2 Canada Urban Air Mobility Market by Platform Opeations
12.2.7.3 Canada Urban Air Mobility Market by Range
12.2.7.4 Canada Urban Air Mobility Market by Platform Architecture
12.2.8 Mexico
12.2.8.1 Mexico Urban Air Mobility Market by Platform
12.2.8.2 Mexico Urban Air Mobility Market by Platform Opeations
12.2.8.3 Mexico Urban Air Mobility Market by Range
12.2.8.4 Mexico Urban Air Mobility Market by Platform Architecture
12.3 Europe
12.3.1 Eastern Europe
12.3.1.1 Eastern Europe Urban Air Mobility Market by Country
12.3.1.2 Eastern Europe Urban Air Mobility Market by Platform
12.3.1.3 Eastern Europe Urban Air Mobility Market by Platform Opeations
12.3.1.4 Eastern Europe Urban Air Mobility Market by Range
12.3.1.5 Eastern Europe Urban Air Mobility Market by Platform Architecture
12.3.1.6 Poland
12.3.1.6.1 Poland Urban Air Mobility Market by Platform
12.3.1.6.2 Poland Urban Air Mobility Market by Platform Opeations
12.3.1.6.3 Poland Urban Air Mobility Market by Range
12.3.1.6.4 Poland Urban Air Mobility Market by Platform Architecture
12.3.1.7 Romania
12.3.1.7.1 Romania Urban Air Mobility Market by Platform
12.3.1.7.2 Romania Urban Air Mobility Market by Platform Opeations
12.3.1.7.3 Romania Urban Air Mobility Market by Range
12.3.1.7.4 Romania Urban Air Mobility Market by Platform Architecture
12.3.1.8 Hungary
12.3.1.8.1 Hungary Urban Air Mobility Market by Platform
12.3.1.8.2 Hungary Urban Air Mobility Market by Platform Opeations
12.3.1.8.3 Hungary Urban Air Mobility Market by Range
12.3.1.8.4 Hungary Urban Air Mobility Market by Platform Architecture
12.3.1.9 Turkey
12.3.1.9.1 Turkey Urban Air Mobility Market by Platform
12.3.1.9.2 Turkey Urban Air Mobility Market by Platform Opeations
12.3.1.9.3 Turkey Urban Air Mobility Market by Range
12.3.1.9.4 Turkey Urban Air Mobility Market by Platform Architecture
12.3.1.10 Rest of Eastern Europe
12.3.1.10.1 Rest of Eastern Europe Urban Air Mobility Market by Platform
12.3.1.10.2 Rest of Eastern Europe Urban Air Mobility Market by Platform Opeations
12.3.1.10.3 Rest of Eastern Europe Urban Air Mobility Market by Range
12.3.1.10.4 Rest of Eastern Europe Urban Air Mobility Market by Platform Architecture
12.3.2 Western Europe
12.3.2.1 Western Europe Urban Air Mobility Market by Country
12.3.2.2 Western Europe Urban Air Mobility Market by Platform
12.3.2.3 Western Europe Urban Air Mobility Market by Platform Opeations
12.3.2.4 Western Europe Urban Air Mobility Market by Range
12.3.2.5 Western Europe Urban Air Mobility Market by Platform Architecture
12.3.2.6 Germany
12.3.2.6.1 Germany Urban Air Mobility Market by Platform
12.3.2.6.2 Germany Urban Air Mobility Market by Platform Opeations
12.3.2.6.3 Germany Urban Air Mobility Market by Range
12.3.2.6.4 Germany Urban Air Mobility Market by Platform Architecture
12.3.2.7 France
12.3.2.7.1 France Urban Air Mobility Market by Platform
12.3.2.7.2 France Urban Air Mobility Market by Platform Opeations
12.3.2.7.3 France Urban Air Mobility Market by Range
12.3.2.7.4 France Urban Air Mobility Market by Platform Architecture
12.3.2.8 UK
12.3.2.8.1 UK Urban Air Mobility Market by Platform
12.3.2.8.2 UK Urban Air Mobility Market by Platform Opeations
12.3.2.8.3 UK Urban Air Mobility Market by Range
12.3.2.8.4 UK Urban Air Mobility Market by Platform Architecture
12.3.2.9 Italy
12.3.2.9.1 Italy Urban Air Mobility Market by Platform
12.3.2.9.2 Italy Urban Air Mobility Market by Platform Opeations
12.3.2.9.3 Italy Urban Air Mobility Market by Range
12.3.2.9.4 Italy Urban Air Mobility Market by Platform Architecture
12.3.2.10 Spain
12.3.2.10.1 Spain Urban Air Mobility Market by Platform
12.3.2.10.2 Spain Urban Air Mobility Market by Platform Opeations
12.3.2.10.3 Spain Urban Air Mobility Market by Range
12.3.2.10.4 Spain Urban Air Mobility Market by Platform Architecture
12.3.2.11 Netherlands
12.3.2.11.1 Netherlands Urban Air Mobility Market by Platform
12.3.2.11.2 Netherlands Urban Air Mobility Market by Platform Opeations
12.3.2.11.3 Netherlands Urban Air Mobility Market by Range
12.3.2.11.4 Netherlands Urban Air Mobility Market by Platform Architecture
12.3.2.12 Switzerland
12.3.2.12.1 Switzerland Urban Air Mobility Market by Platform
12.3.2.12.2 Switzerland Urban Air Mobility Market by Platform Opeations
12.3.2.12.3 Switzerland Urban Air Mobility Market by Range
12.3.2.12.4 Switzerland Urban Air Mobility Market by Platform Architecture
12.3.2.13 Austria
12.3.2.13.1 Austria Urban Air Mobility Market by Platform
12.3.2.13.2 Austria Urban Air Mobility Market by Platform Opeations
12.3.2.13.3 Austria Urban Air Mobility Market by Range
12.3.2.13.4 Austria Urban Air Mobility Market by Platform Architecture
12.3.2.14 Rest of Western Europe
12.3.2.14.1 Rest of Western Europe Urban Air Mobility Market by Platform
12.3.2.14.2 Rest of Western Europe Urban Air Mobility Market by Platform Opeations
12.3.2.14.3 Rest of Western Europe Urban Air Mobility Market by Range
12.3.2.14.4 Rest of Western Europe Urban Air Mobility Market by Platform Architecture
12.4 Asia-Pacific
12.4.1 Asia Pacific Urban Air Mobility Market by Country
12.4.2 Asia Pacific Urban Air Mobility Market by Platform
12.4.3 Asia Pacific Urban Air Mobility Market by Platform Opeations
12.4.4 Asia Pacific Urban Air Mobility Market by Range
12.4.5 Asia Pacific Urban Air Mobility Market by Platform Architecture
12.4.6 China
12.4.6.1 China Urban Air Mobility Market by Platform
12.4.6.2 China Urban Air Mobility Market by Platform Opeations
12.4.6.3 China Urban Air Mobility Market by Range
12.4.6.4 China Urban Air Mobility Market by Platform Architecture
12.4.7 India
12.4.7.1 India Urban Air Mobility Market by Platform
12.4.7.2 India Urban Air Mobility Market by Platform Opeations
12.4.7.3 India Urban Air Mobility Market by Range
12.4.7.4 India Urban Air Mobility Market by Platform Architecture
12.4.8 Japan
12.4.8.1 Japan Urban Air Mobility Market by Platform
12.4.8.2 Japan Urban Air Mobility Market by Platform Opeations
12.4.8.3 Japan Urban Air Mobility Market by Range
12.4.8.4 Japan Urban Air Mobility Market by Platform Architecture
12.4.9 South Korea
12.4.9.1 South Korea Urban Air Mobility Market by Platform
12.4.9.2 South Korea Urban Air Mobility Market by Platform Opeations
12.4.9.3 South Korea Urban Air Mobility Market by Range
12.4.9.4 South Korea Urban Air Mobility Market by Platform Architecture
12.4.10 Vietnam
12.4.10.1 Vietnam Urban Air Mobility Market by Platform
12.4.10.2 Vietnam Urban Air Mobility Market by Platform Opeations
12.4.10.3 Vietnam Urban Air Mobility Market by Range
12.4.10.4 Vietnam Urban Air Mobility Market by Platform Architecture
12.4.11 Singapore
12.4.11.1 Singapore Urban Air Mobility Market by Platform
12.4.11.2 Singapore Urban Air Mobility Market by Platform Opeations
12.4.11.3 Singapore Urban Air Mobility Market by Range
12.4.11.4 Singapore Urban Air Mobility Market by Platform Architecture
12.4.12 Australia
12.4.12.1 Australia Urban Air Mobility Market by Platform
12.4.12.2 Australia Urban Air Mobility Market by Platform Opeations
12.4.12.3 Australia Urban Air Mobility Market by Range
12.4.12.4 Australia Urban Air Mobility Market by Platform Architecture
12.4.13 Rest of Asia-Pacific
12.4.13.1 Rest of Asia-Pacific Urban Air Mobility Market by Platform
12.4.13.2 Rest of Asia-Pacific Urban Air Mobility Market by Platform Opeations
12.4.13.3 Rest of Asia-Pacific Urban Air Mobility Market by Range
12.4.13.4 Rest of Asia-Pacific Urban Air Mobility Market by Platform Architecture
12.5 Middle East & Africa
12.5.1 Middle East
12.5.1.1 Middle East Urban Air Mobility Market by Country
12.5.1.2 Middle East Urban Air Mobility Market by Platform
12.5.1.3 Middle East Urban Air Mobility Market by Platform Opeations
12.5.1.4 Middle East Urban Air Mobility Market by Range
12.5.1.5 Middle East Urban Air Mobility Market by Platform Architecture
12.5.1.6 UAE
12.5.1.6.1 UAE Urban Air Mobility Market by Platform
12.5.1.6.2 UAE Urban Air Mobility Market by Platform Opeations
12.5.1.6.3 UAE Urban Air Mobility Market by Range
12.5.1.6.4 UAE Urban Air Mobility Market by Platform Architecture
12.5.1.7 Egypt
12.5.1.7.1 Egypt Urban Air Mobility Market by Platform
12.5.1.7.2 Egypt Urban Air Mobility Market by Platform Opeations
12.5.1.7.3 Egypt Urban Air Mobility Market by Range
12.5.1.7.4 Egypt Urban Air Mobility Market by Platform Architecture
12.5.1.8 Saudi Arabia
12.5.1.8.1 Saudi Arabia Urban Air Mobility Market by Platform
12.5.1.8.2 Saudi Arabia Urban Air Mobility Market by Platform Opeations
12.5.1.8.3 Saudi Arabia Urban Air Mobility Market by Range
12.5.1.8.4 Saudi Arabia Urban Air Mobility Market by Platform Architecture
12.5.1.9 Qatar
12.5.1.9.1 Qatar Urban Air Mobility Market by Platform
12.5.1.9.2 Qatar Urban Air Mobility Market by Platform Opeations
12.5.1.9.3 Qatar Urban Air Mobility Market by Range
12.5.1.9.4 Qatar Urban Air Mobility Market by Platform Architecture
12.5.1.10 Rest of Middle East
12.5.1.10.1 Rest of Middle East Urban Air Mobility Market by Platform
12.5.1.10.2 Rest of Middle East Urban Air Mobility Market by Platform Opeations
12.5.1.10.3 Rest of Middle East Urban Air Mobility Market by Range
12.5.1.10.4 Rest of Middle East Urban Air Mobility Market by Platform Architecture
12.5.2. Africa
12.5.2.1 Africa Urban Air Mobility Market by Country
12.5.2.2 Africa Urban Air Mobility Market by Platform
12.5.2.3 Africa Urban Air Mobility Market by Platform Opeations
12.5.2.4 Africa Urban Air Mobility Market by Range
12.5.2.5 Africa Urban Air Mobility Market by Platform Architecture
12.5.2.6 Nigeria
12.5.2.6.1 Nigeria Urban Air Mobility Market by Platform
12.5.2.6.2 Nigeria Urban Air Mobility Market by Platform Opeations
12.5.2.6.3 Nigeria Urban Air Mobility Market by Range
12.5.2.6.4 Nigeria Urban Air Mobility Market by Platform Architecture
12.5.2.7 South Africa
12.5.2.7.1 South Africa Urban Air Mobility Market by Platform
12.5.2.7.2 South Africa Urban Air Mobility Market by Platform Opeations
12.5.2.7.3 South Africa Urban Air Mobility Market by Range
12.5.2.7.4 South Africa Urban Air Mobility Market by Platform Architecture
12.5.2.8 Rest of Africa
12.5.2.8.1 Rest of Africa Urban Air Mobility Market by Platform
12.5.2.8.2 Rest of Africa Urban Air Mobility Market by Platform Opeations
12.5.2.8.3 Rest of Africa Urban Air Mobility Market by Range
12.5.2.8.4 Rest of Africa Urban Air Mobility Market by Platform Architecture
12.6. Latin America
12.6.1 Latin America Urban Air Mobility Market by Country
12.6.2 Latin America Urban Air Mobility Market by Platform
12.6.3 Latin America Urban Air Mobility Market by Platform Opeations
12.6.4 Latin America Urban Air Mobility Market by Range
12.6.5 Latin America Urban Air Mobility Market by Platform Architecture
12.6.6 Brazil
12.6.6.1 Brazil Urban Air Mobility Market by Platform
12.6.6.2 Brazil Urban Air Mobility Market by Platform Opeations
12.6.6.3 Brazil Urban Air Mobility Market by Range
12.6.6.4 Brazil Urban Air Mobility Market by Platform Architecture
12.6.7 Argentina
12.6.7.1 Argentina Urban Air Mobility Market by Platform
12.6.7.2 Argentina Urban Air Mobility Market by Platform Opeations
12.6.7.3 Argentina Urban Air Mobility Market by Range
12.6.7.4 Argentina Urban Air Mobility Market by Platform Architecture
12.6.8 Colombia
12.6.8.1 Colombia Urban Air Mobility Market by Platform
12.6.8.2 Colombia Urban Air Mobility Market by Platform Opeations
12.6.8.3 Colombia Urban Air Mobility Market by Range
12.6.8.4 Colombia Urban Air Mobility Market by Platform Architecture
12.6.9 Rest of Latin America
12.6.9.1 Rest of Latin America Urban Air Mobility Market by Platform
12.6.9.2 Rest of Latin America Urban Air Mobility Market by Platform Opeations
12.6.9.3 Rest of Latin America Urban Air Mobility Market by Range
12.6.9.4 Rest of Latin America Urban Air Mobility Market by Platform Architecture

13 Company Profile
13.1 Volocopter GmbH
13.1.1 Company Overview
13.1.2 Financials
13.1.3 Product/Services Offered
13.1.4 SWOT Analysis
13.1.5 The SNS View
13.2 Neva Aerospace
13.2.1 Company Overview
13.2.2 Financials
13.2.3 Product/Services Offered
13.2.4 SWOT Analysis
13.2.5 The SNS View
13.3 Kitty Hawk
13.3.1 Company Overview
13.3.2 Financials
13.3.3 Product/Services Offered
13.3.4 SWOT Analysis
13.3.5 The SNS View
13.4 Pipistrel Group
13.4 Company Overview
13.4.2 Financials
13.4.3 Product/Services Offered
13.4.4 SWOT Analysis
13.4.5 The SNS View
13.5 EHang
13.5.1 Company Overview
13.5.2 Financials
13.5.3 Product/Services Offered
13.5.4 SWOT Analysis
13.5.5 The SNS View
13.6 Lilium
13.6.1 Company Overview
13.6.2 Financials
13.6.3 Product/Services Offered
13.6.4 SWOT Analysis
13.6.5 The SNS View
13.7 Airbus
13.7.1 Company Overview
13.7.2 Financials
13.7.3 Product/Services Offered
13.7.4 SWOT Analysis
13.7.5 The SNS View
13.8 Workhorse Group Inc.
13.8.1 Company Overview
13.8.2 Financials
13.8.3 Product/Services Offered
13.8.4 SWOT Analysis
13.8.5 The SNS View
13.9 Opener
13.9.1 Company Overview
13.9.2 Financials
13.9.3 Product/Services Offered
13.9.4 SWOT Analysis
13.9.5 The SNS View
13.10 The Boeing Company
13.10.1 Company Overview
13.10.2 Financials
13.10.3 Product/Services Offered
13.10.4 SWOT Analysis
13.10.5 The SNS View

14. Competitive Landscape
14.1 Competitive Benchmarking
14.2 Market Share Analysis
14.3 Recent Developments
14.3.1 Industry News
14.3.2 Company News
14.3.3 Mergers & Acquisitions

15. USE Cases and Best Practices

16. Conclusion

An accurate research report requires proper strategizing as well as implementation. There are multiple factors involved in the completion of good and accurate research report and selecting the best methodology to compete the research is the toughest part. Since the research reports we provide play a crucial role in any company’s decision-making process, therefore we at SNS Insider always believe that we should choose the best method which gives us results closer to reality. This allows us to reach at a stage wherein we can provide our clients best and accurate investment to output ratio.

Each report that we prepare takes a timeframe of 350-400 business hours for production. Starting from the selection of titles through a couple of in-depth brain storming session to the final QC process before uploading our titles on our website we dedicate around 350 working hours. The titles are selected based on their current market cap and the foreseen CAGR and growth.


The 5 steps process:

Step 1: Secondary Research:

Secondary Research or Desk Research is as the name suggests is a research process wherein, we collect data through the readily available information. In this process we use various paid and unpaid databases which our team has access to and gather data through the same. This includes examining of listed companies’ annual reports, Journals, SEC filling etc. Apart from this our team has access to various associations across the globe across different industries. Lastly, we have exchange relationships with various university as well as individual libraries.

Secondary Research

Step 2: Primary Research

When we talk about primary research, it is a type of study in which the researchers collect relevant data samples directly, rather than relying on previously collected data.  This type of research is focused on gaining content specific facts that can be sued to solve specific problems. Since the collected data is fresh and first hand therefore it makes the study more accurate and genuine.

We at SNS Insider have divided Primary Research into 2 parts.

Part 1 wherein we interview the KOLs of major players as well as the upcoming ones across various geographic regions. This allows us to have their view over the market scenario and acts as an important tool to come closer to the accurate market numbers. As many as 45 paid and unpaid primary interviews are taken from both the demand and supply side of the industry to make sure we land at an accurate judgement and analysis of the market.

This step involves the triangulation of data wherein our team analyses the interview transcripts, online survey responses and observation of on filed participants. The below mentioned chart should give a better understanding of the part 1 of the primary interview.

Primary Research

Part 2: In this part of primary research the data collected via secondary research and the part 1 of the primary research is validated with the interviews from individual consultants and subject matter experts.

Consultants are those set of people who have at least 12 years of experience and expertise within the industry whereas Subject Matter Experts are those with at least 15 years of experience behind their back within the same space. The data with the help of two main processes i.e., FGDs (Focused Group Discussions) and IDs (Individual Discussions). This gives us a 3rd party nonbiased primary view of the market scenario making it a more dependable one while collation of the data pointers.

Step 3: Data Bank Validation

Once all the information is collected via primary and secondary sources, we run that information for data validation. At our intelligence centre our research heads track a lot of information related to the market which includes the quarterly reports, the daily stock prices, and other relevant information. Our data bank server gets updated every fortnight and that is how the information which we collected using our primary and secondary information is revalidated in real time.

Data Bank Validation

Step 4: QA/QC Process

After all the data collection and validation our team does a final level of quality check and quality assurance to get rid of any unwanted or undesired mistakes. This might include but not limited to getting rid of the any typos, duplication of numbers or missing of any important information. The people involved in this process include technical content writers, research heads and graphics people. Once this process is completed the title gets uploader on our platform for our clients to read it.

Step 5: Final QC/QA Process:

This is the last process and comes when the client has ordered the study. In this process a final QA/QC is done before the study is emailed to the client. Since we believe in giving our clients a good experience of our research studies, therefore, to make sure that we do not lack at our end in any way humanly possible we do a final round of quality check and then dispatch the study to the client.

Start a Conversation

Hi! Click one of our member below to chat on Phone