image

Vertiports Market Report Scope & Overview:
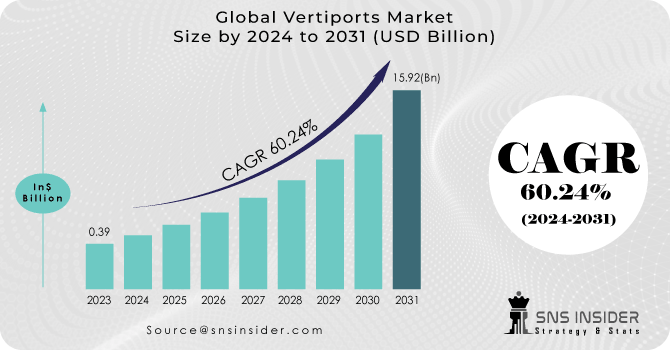
The Vertiports Market size was valued at USD 0.39 Billion in 2023. It is projected to reach USD 15.92 Billion by 2031 and increase at a compound annual growth rate of 60.24% between 2024 and 2031.

The concept of urban air mobility has gained significant attention due to the increasing congestion in urban areas, the need for efficient transportation solutions, and advancements in electric aviation technology. VTOL vehicles promise to provide faster, more convenient, and less congested transportation options, especially for short to medium distances within urban environments. Vertiports play a crucial role in making this vision a reality by providing the necessary infrastructure.

Vertiports Market Revenue Analysis

To get more information on Vertiports Market - Request Free Sample Report

A vertiport is simply a landing and take-off infrastructure for VTOL aircraft such as air taxis, freight aerial vehicles, passenger aerial vehicles, and air ambulances. The name vertiport is formed from the terms vertical & airport, and it refers to a specified area constructed expressly to handle the unique demands of VTOL aircraft. Sustainability is a primary priority in the UAM business, with electric propulsion and the usage of renewable energy sources being prioritised to reduce environmental effects. Collaboration and partnerships are being developed between firms and organisations in the UAM sector to advance technology and bring goods to market.

The idea behind vertiports is to construct dedicated spaces in urban areas where VTOL (vertical take-off & landing aircraft) vehicles may safely take off and land. They are intended to facilitate the integration of air taxis and eVTOLs into existing transportation networks, allowing urban commuters to transfer smoothly from ground-based transportation to air travel. The next generation of VTOLs will need specialised transportation hubs that are linked to traditional forms of transit like trains, buses, and existing airports.  

A slew of firms across the world, many of which are backed by major airlines, are competing to be the first to build an eVTOL (electrical vertical take-off & landing) vehicle suitable for passenger flights. Flying taxi services might be available as early as 2024 or 2025 when the first eVTOLs are planned to be certified safe for operation. Looking ahead to the future of urban transit, it is clear that the design and development of vertiports will be crucial in the construction of tomorrow's cities. Finally, the development of vertiports represents a significant stride forward in the evolution of urban mobility.

MARKET DYNAMICS

DRIVERS:

  • The development of electric propulsion systems has opened up new possibilities for vertical takeoff and landing (VTOL) vehicles.

  • Urban Congestion and Traffic Woes is the driver of the Vertiports Market.

Increasing urbanization has led to severe traffic congestion in many cities, causing significant time wastage and environmental pollution. Vertiports and urban air mobility (UAM) solutions offered a potential way to alleviate congestion by providing an additional mode of transportation for short to medium distances.

RESTRAIN:

  • Building vertiports and the associated infrastructure requires substantial investments.

  • Regulatory Hurdles are the restraint of the Vertiports Market.

Integrating urban air mobility (UAM) vehicles into existing airspace and establishing safety regulations for VTOL operations posed a significant challenge. Regulators are needed to ensure the safety of these vehicles in densely populated urban environments.

OPPORTUNITY:

  • The vertiports market drives innovation in various technologies, including electric propulsion systems.

  • Urban Air Mobility (UAM) Ecosystem Development is an opportunity for the Vertiports Market.

Vertiports are a critical component of the UAM ecosystem, which aims to revolutionize urban transportation. Creating a network of vertiports could enable efficient and seamless point-to-point travel within urban areas.

CHALLENGES:

  • Designing, building, and maintaining vertiport infrastructure required substantial investment and careful planning.

  • Regulatory and Legal Hurdles are the challenges of the Vertiports Market.

Integrating urban air mobility (UAM) vehicles and vertiports into existing airspace regulations presented a complex challenge. Establishing safety standards, and air traffic management protocols, and securing necessary regulatory approvals were critical but intricate tasks.

IMPACT OF RUSSIAN UKRAINE WAR

Prices for a variety of goods, and food, including fertilisers, oil and gas, rose as a result of the Russia-Ukraine conflict. Supply chain interruptions have raised freight rates, caused container shortages, and reduced warehouse space available. Several ports have been shuttered, and orders are being rescinded due to cargo delays and congestion. The Russia-Ukraine war has had a wide-ranging impact on the global logistics business. When the Russia-Ukraine war began to damage the sector, the impacts of the epidemic on storage capacity and container availability had only recently begun to fade. The conflict slowed the movement of products, fuelled price hikes and product shortages, and caused global food shortages. Natural gas prices in Europe have risen by roughly 120-130% in the six months since the start of the war, while coal prices have risen by 95-97% during the same period. Since the assault, the prices of soybeans, maize and crude oil, of which Russia is the top producer, have risen. In this Russian-Ukraine war, the Vertiports Market is increasing their product & services prices up to 4.21-5.10%.

IMPACT OF ONGOING RECESSION

The summer of 2022 has been distinguished by a revival in travel for the travel and hospitality sector. However, a continued travel rebound until 2023 may not go as planned. Everyone has grown aware of the recent impact of inflation. However, experts believe that a rare condition known as stagflation is on the horizon. However, the travel industry does not need to be concerned just yet because inflation has not hindered tourism. In fact, despite cost rises of up to 42%, customers are returning to foreign summer holidays in addition to completing local flights. Unfortunately, there are growing fears that demand may drop, with some economists and financial experts anticipating a recession as early as 2023. There is also rising concern that a recession, defined as two or more quarters of negative GDP growth, may occur. This result, together with inflation, would produce a stagflation climate in the United States. In this recession the Vertiports Market grain profit up to 2.2-3.12%.

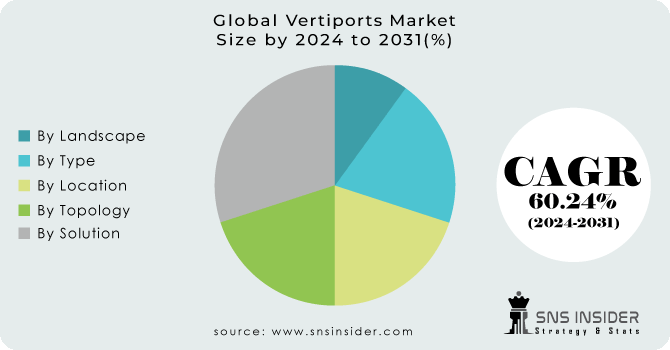
KEY MARKET SEGMENTATION

By Type

  • Vertibases

  • Vertihubs

  • Vertipads

By Solution

By Location

  • Ground-based

  • Floating

  • Rooftop / Elevated

By Landscape

  • Regional Vertiports

  • Urban Vertiports

By Topology

  • Single

  • Satellite

  • Linear

  • Pier

Vertiports Market Segmentation Analysis

Need any customization research on Vertiports Market - Enquiry Now

REGIONAL COVERAGE:

North America

  • US

  • Canada

  • Mexico

Europe

  • Eastern Europe

    • Poland

    • Romania

    • Hungary

    • Turkey

    • Rest of Eastern Europe

  • Western Europe

    • Germany

    • France

    • UK

    • Italy

    • Spain

    • Netherlands

    • Switzerland

    • Austria

    • Rest of Western Europe

Asia Pacific

  • China

  • India

  • Japan

  • South Korea

  • Vietnam

  • Singapore

  • Australia

  • Rest of Asia Pacific

Middle East & Africa

  • Middle East

    • UAE

    • Egypt

    • Saudi Arabia

    • Qatar

    • Rest of Middle East

  • Africa

    • Nigeria

    • South Africa

    • Rest of Africa

Latin America

  • Brazil

  • Argentina

  • Colombia

  • Rest of Latin America

REGIONAL ANALYSIS

North America: North America is expected to have the highest CAGR throughout the anticipated timeframe. The increased demand for sophisticated air mobility solutions, driven by traffic congestion and the necessity for speedier transit choices, is expected to drive market expansion in this area. Improvements in electric vertical takeoff and landing (VTOL) technology have facilitated the development of vertiport infrastructure, making it more financially and ecologically viable. The growth of vertiports in North America is also aided by favourable legal frameworks and public and private sector investments.

Asia Pacific: Vertiport is finding a profitable market in Asia Pacific, with Japan becoming as the world's biggest provider of this medicine. Vertiport manufacturing in India is also rising rapidly, benefiting the Asia Pacific Vertiport market. Leading manufacturers are aggressively expanding their activities in this region, which is projected to increase its worldwide market significance.

Key Players

The Major Players are Altaport Inc., Aeroauto, Anra Technologies, Siemens, Airbus, Sita, Bayards Vertiports, Skyports Infrastructure Limited, Ferrovial, Volocopter GmBH, Lilium Aviation GmBH, Skyways, Urban V S.P.A, Skyscape Inc., Skyportz and Other Players

Altaport Inc-Company Financial Analysis

Company Landscape Analysis

RECENT DEVELOPMENT

In 2023: Groupe ADP has inked an agreement with AutoFlight to test Prosperity 1 VTOL flights at Pontoise Airport during the Paris Olympic Games 2024. Groupe ADP is driving the development of VTOL infrastructure in the Paris Region with five new vertiports.

In 2023: Urban S.p.A. and Lilium collaborated to enhance infrastructure for Advanced Air Mobility (AAM). The companies' collaboration to build vertiport infrastructure would enable VTOL networks for Lilium aircraft and clients, with an initial focus on Italy and the French Riviera, where Urban would begin operations, and the prospect of expanding into other regions.

In 2023: Lilium and Urban S.p.A have collaborated to enhance infrastructure for Advanced Air Mobility (AAM). The companies' collaboration to build vertiport infrastructure would enable VTOL networks for Lilium aircraft and clients, with an initial focus on Italy and the French Riviera, where Urban would begin operations, and the prospect of expanding into other regions.

Vertiports Market Report Scope:

Report Attributes Details
Market Size in 2023  US$  0.39 Bn
Market Size by 2031  US$ 15.92 Bn
CAGR   CAGR of 60.24% From 2024 to 2031
Base Year  2023
Forecast Period  2024-2031
Historical Data  2020-2022
Report Scope & Coverage Market Size, Segments Analysis, Competitive  Landscape, Regional Analysis, DROC & SWOT Analysis, Forecast Outlook
Key Segments • By Type (Vertibases, Vertihubs, Vertipads)
• By Solution (Terminal Gates, Landing Pads, Charging Stations, Ground Control Stations, Ground Support Equipment, Others)
• By Location (Ground-based, Floating, Rooftop / Elevated)
• By Landscape (Regional Vertiports, Urban Vertiports)
• By Topology (Single, Satellite, Linear, Pier)
Regional Analysis/Coverage North America (US, Canada, Mexico), Europe (Eastern Europe [Poland, Romania, Hungary, Turkey, Rest of Eastern Europe] Western Europe] Germany, France, UK, Italy, Spain, Netherlands, Switzerland, Austria, Rest of Western Europe]), Asia Pacific (China, India, Japan, South Korea, Vietnam, Singapore, Australia, Rest of Asia Pacific), Middle East & Africa (Middle East [UAE, Egypt, Saudi Arabia, Qatar, Rest of Middle East], Africa [Nigeria, South Africa, Rest of Africa], Latin America (Brazil, Argentina, Colombia Rest of Latin America)
Company Profiles Altaport Inc., Aeroauto, Anra Technologies, Siemens, Airbus, Sita, Bayards Vertiports, Skyports Infrastructure Limited, Ferrovial, Volocopter GmBH, Lilium Aviation GmBH, Skyways, Urban V S.P.A, Skyscape Inc., Skyportz 
Key Drivers • The development of electric propulsion systems has opened up new possibilities for vertical takeoff and landing (VTOL) vehicles.
• Urban Congestion and Traffic Woes is the driver of the Vertiports Market.
Market Restraints • Building vertiports and the associated infrastructure requires substantial investments.
• Regulatory Hurdles are the restraint of the Vertiports Market.


Frequently Asked Questions

Ans. The Vertiports Market is growing at a CAGR of 60.24% From 2024 to 2031.

Ans. The Vertiports Market size is projected to reach USD 15.92 Billion by 2031.

Ans. The Vertiports Market size was valued at USD 0.39 Billion in 2023.

Ans. A few potentials for the vertiports sector include intermodal integration for efficient travel and increased opportunity for infrastructure suppliers.

Ans. Some of the technological breakthroughs in the vertiports industry are Vertiport Management Systems, Automated Ground Handling, and Remote maintenance and monitoring systems.

Table of Contents

1. Introduction
1.1 Market Definition
1.2 Scope
1.3 Research Assumptions

2. Research Methodology

3. Market Dynamics
3.1 Drivers
3.2 Restraints
3.3 Opportunities
3.4 Challenges

4. Impact Analysis
4.1 Impact of Russia-Ukraine War
4.2 Impact of Ongoing Recession
4.2.1 Introduction
4.2.2 Impact on major economies
4.2.2.1 US
4.2.2.2 Canada
4.2.2.3 Germany
4.2.2.4 France
4.2.2.5 United Kingdom
4.2.2.6 China
4.2.2.7 Japan
4.2.2.8 South Korea
4.2.2.9 Rest of the World

5. Value Chain Analysis

6. Porter’s 5 forces model

7. PEST Analysis

8. Vertiports Market Segmentation, By Type
8.1 Vertibases
8.2 Vertihubs
8.3 Vertipads

9. Vertiports Market Segmentation, By Solution
9.1 Terminal Gates
9.2 Landing Pads
9.3 Charging Stations
9.4 Ground Control Stations
9.5 Ground Support Equipment
9.6 Others

10. Vertiports Market Segmentation, By Location
10.1 Ground-based
10.2 Floating
10.3 Rooftop / Elevated

11. Vertiports Market Segmentation, By Landscape
11.1 Regional Vertiports
11.2 Urban Vertiports

12. Vertiports Market Segmentation, By Topology
12.1 Single
12.2 Satellite
12.3 Linear
12.4 Pier

13. Regional Analysis
13.1 Introduction
13.2 North America
13.2.1 North America Vertiports Market by Country
13.2.2 North America Vertiports Market by Type
13.2.3 North America Vertiports Market by Solution
13.2.4 North America Vertiports Market by Location
13.2.5 North America Vertiports Market by Landscape
13.2.6 North America Vertiports Market by Topology
13.2.7 USA
13.2.7.1 USA Vertiports Market by Type
13.2.7.2 USA Vertiports Market by Solution
13.2.7.3 USA Vertiports Market by Location
13.2.7.4 USA Vertiports Market by Landscape
13.2.7.5 USA Vertiports Market by Topology
13.2.8 Canada
13.2.8.1 Canada Vertiports Market by Type
13.2.8.2 Canada Vertiports Market by Solution
13.2.8.3 Canada Vertiports Market by Location
13.2.8.4 Canada Vertiports Market by Landscape
13.2.8.5 Canada Vertiports Market by Topology
13.2.9 Mexico
13.2.9.1 Mexico Vertiports Market by Type
13.2.9.2 Mexico Vertiports Market by Solution
13.2.9.3 Mexico Vertiports Market by Location
13.2.9.4 Mexico Vertiports Market by Landscape
13.2.9.5 Mexico Vertiports Market by Topology
13.3 Europe
13.3.1 Eastern Europe
13.3.1.1 Eastern Europe Vertiports Market by Country
13.3.1.2 Eastern Europe Vertiports Market by Type
13.3.1.3 Eastern Europe Vertiports Market by Solution
13.3.1.4 Eastern Europe Vertiports Market by Location
13.3.1.5 Eastern Europe Vertiports Market by Landscape
13.3.1.6 Eastern Europe Vertiports Market by Topology
13.3.1.7 Poland
13.3.1.7.1 Poland Vertiports Market by Type
13.3.1.7.2 Poland Vertiports Market by Solution
13.3.1.7.3 Poland Vertiports Market by Location
13.3.1.7.4 Poland Vertiports Market by Landscape
13.3.1.7.5 Poland Vertiports Market by Topology
13.3.1.8 Romania
13.3.1.8.1 Romania Vertiports Market by Type
13.3.1.8.2 Romania Vertiports Market by Solution
13.3.1.8.3 Romania Vertiports Market by Location
13.3.1.8.4 Romania Vertiports Market by Landscape
13.3.1.8.5 Romania Vertiports Market by Topology
13.3.1.9 Hungary
13.3.1.9.1 Hungary Vertiports Market by Type
13.3.1.9.2 Hungary Vertiports Market by Solution
13.3.1.9.3 Hungary Vertiports Market by Location
13.3.1.9.4 Hungary Vertiports Market by Landscape
13.3.1.9.5 Hungary Vertiports Market by Topology
13.3.1.10 Turkey
13.3.1.10.1 Turkey Vertiports Market by Type
13.3.1.10.2 Turkey Vertiports Market by Solution
13.3.1.10.3 Turkey Vertiports Market by Location
13.3.1.10.4 Turkey Vertiports Market by Landscape
13.3.1.10.5 Turkey Vertiports Market by Topology
13.3.1.11 Rest of Eastern Europe
13.3.1.11.1 Rest of Eastern Europe Vertiports Market by Type
13.3.1.11.2 Rest of Eastern Europe Vertiports Market by Solution
13.3.1.11.3 Rest of Eastern Europe Vertiports Market by Location
13.3.1.11.4 Rest of Eastern Europe Vertiports Market by Landscape
13.3.1.11.5 Rest of Eastern Europe Vertiports Market by Topology
13.3.2 Western Europe
13.3.2.1 Western Europe Vertiports Market by Country
13.3.2.2 Western Europe Vertiports Market by Type
13.3.2.3 Western Europe Vertiports Market by Solution
13.3.2.4 Western Europe Vertiports Market by Location
13.3.2.5 Western Europe Vertiports Market by Landscape
13.3.2.6 Western Europe Vertiports Market by Topology
13.3.2.7 Germany
13.3.2.7.1 Germany Vertiports Market by Type
13.3.2.7.2 Germany Vertiports Market by Solution
13.3.2.7.3 Germany Vertiports Market by Location
13.3.2.7.4 Germany Vertiports Market by Landscape
13.3.2.7.5 Germany Vertiports Market by Topology
13.3.2.8 France
13.3.2.8.1 France Vertiports Market by Type
13.3.2.8.2 France Vertiports Market by Solution
13.3.2.8.3 France Vertiports Market by Location
13.3.2.8.4 France Vertiports Market by Landscape
13.3.2.8.5 France Vertiports Market by Topology
13.3.2.9 UK
13.3.2.9.1 UK Vertiports Market by Type
13.3.2.9.2 UK Vertiports Market by Solution
13.3.2.9.3 UK Vertiports Market by Location
13.3.2.9.4 UK Vertiports Market by Landscape
13.3.2.9.5 UK Vertiports Market by Topology
13.3.2.10 Italy
13.3.2.10.1 Italy Vertiports Market by Type
13.3.2.10.2 Italy Vertiports Market by Solution
13.3.2.10.3 Italy Vertiports Market by Location
13.3.2.10.4 Italy Vertiports Market by Landscape
13.3.2.10.5 Italy Vertiports Market by Topology
13.3.2.11 Spain
13.3.2.11.1 Spain Vertiports Market by Type
13.3.2.11.2 Spain Vertiports Market by Solution
13.3.2.11.3 Spain Vertiports Market by Location
13.3.2.11.4 Spain Vertiports Market by Landscape
13.3.2.11.5 Spain Vertiports Market by Topology
13.3.2.12 The Netherlands
13.3.2.12.1 Netherlands Vertiports Market by Type
13.3.2.12.2 Netherlands Vertiports Market by Solution
13.3.2.12.3 Netherlands Vertiports Market by Location
13.3.2.12.4 Netherlands Vertiports Market by Landscape
13.3.2.12.5 Netherlands Vertiports Market by Topology
13.3.2.13 Switzerland
13.3.2.13.1 Switzerland Vertiports Market by Type
13.3.2.13.2 Switzerland Vertiports Market by Solution
13.3.2.13.3 Switzerland Vertiports Market by Location
13.3.2.13.4 Switzerland Vertiports Market by Landscape
13.3.2.13.5 Switzerland Vertiports Market by Topology
13.3.2.14 Austria
13.3.2.14.1 Austria Vertiports Market by Type
13.3.2.14.2 Austria Vertiports Market by Solution
13.3.2.14.3 Austria Vertiports Market by Location
13.3.2.14.4 Austria Vertiports Market by Landscape
13.3.2.14.5 Austria Vertiports Market by Topology
13.3.2.15 Rest of Western Europe
13.3.2.15.1 Rest of Western Europe Vertiports Market by Type
13.3.2.15.2 Rest of Western Europe Vertiports Market by Solution
13.3.2.15.3 Rest of Western Europe Vertiports Market by Location
13.3.2.15.4 Rest of Western Europe Vertiports Market by Landscape
13.3.2.15.5 Rest of Western Europe Vertiports Market by Topology
13.4 Asia-Pacific
13.4.1 Asia Pacific Vertiports Market by Country
13.4.2 Asia Pacific Vertiports Market by Type
13.4.3 Asia Pacific Vertiports Market by Solution
13.4.4 Asia Pacific Vertiports Market by Location
13.4.5 Asia Pacific Vertiports Market by Landscape
13.4.6 Asia Pacific Vertiports Market by Topology
13.4.7 China
13.4.7.1 China Vertiports Market by Type
13.4.7.2 China Vertiports Market by Solution
13.4.7.3 China Vertiports Market by Location
13.4.7.4 China Vertiports Market by Landscape
13.4.7.5 China Vertiports Market by Topology
13.4.8 India
13.4.8.1 India Vertiports Market by Type
13.4.8.2 India Vertiports Market by Solution
13.4.8.3 India Vertiports Market by Location
13.4.8.4 India Vertiports Market by Landscape
13.4.8.5 India Vertiports Market by Topology
13.4.9 Japan
13.4.9.1 Japan Vertiports Market by Type
13.4.9.2 Japan Vertiports Market by Solution
13.4.9.3 Japan Vertiports Market by Location
13.4.9.4 Japan Vertiports Market by Landscape
13.4.9.5 Japan Vertiports Market by Topology
13.4.10 South Korea
13.4.10.1 South Korea Vertiports Market by Type
13.4.10.2 South Korea Vertiports Market by Solution
13.4.10.3 South Korea Vertiports Market by Location
13.4.10.4 South Korea Vertiports Market by Landscape
13.4.10.5 South Korea Vertiports Market by Topology
13.4.11 Vietnam
13.4.11.1 Vietnam Vertiports Market by Type
13.4.11.2 Vietnam Vertiports Market by Solution
13.4.11.3 Vietnam Vertiports Market by Location
13.4.11.4 Vietnam Vertiports Market by Landscape
13.4.11.5 Vietnam Vertiports Market by Topology
13.4.12 Singapore
13.4.12.1 Singapore Vertiports Market by Type
13.4.12.2 Singapore Vertiports Market by Solution
13.4.12.3 Singapore Vertiports Market by Location
13.4.12.4 Singapore Vertiports Market by Landscape
13.4.12.5 Singapore Vertiports Market by Topology
13.4.13 Australia
13.4.13.1 Australia Vertiports Market by Type
13.4.13.2 Australia Vertiports Market by Solution
13.4.13.3 Australia Vertiports Market by Location
13.4.13.4 Australia Vertiports Market by Landscape
13.4.13.5 Australia Vertiports Market by Topology
13.4.14 Rest of Asia-Pacific
13.4.14.1 APAC Vertiports Market by Type
13.4.14.2 APAC Vertiports Market by Solution
13.4.14.3 APAC Vertiports Market by Location
13.4.14.4 APAC Vertiports Market by Landscape
13.4.14.5 APAC Vertiports Market by Topology
13.5 The Middle East & Africa
13.5.1 Middle East
13.5.1.1 Middle East Vertiports Market by Country
13.5.1.2 Middle East Vertiports Market by Type
13.5.1.3 Middle East Vertiports Market by Solution
13.5.1.4 Middle East Vertiports Market by Location
13.5.1.5 Middle East Vertiports Market by Landscape
13.5.1.6 Middle East Vertiports Market by Topology
13.5.1.7 UAE
13.5.1.7.1 UAE Vertiports Market by Type
13.5.1.7.2 UAE Vertiports Market by Solution
13.5.1.7.3 UAE Vertiports Market by Location
13.5.1.7.4 UAE Vertiports Market by Landscape
13.5.1.7.5 UAE Vertiports Market by Topology
13.5.1.8 Egypt
13.5.1.8.1 Egypt Vertiports Market by Type
13.5.1.8.2 Egypt Vertiports Market by Solution
13.5.1.8.3 Egypt Vertiports Market by Location
13.5.1.8.4 Egypt Vertiports Market by Landscape
13.5.1.8.5 Egypt Vertiports Market by Topology
13.5.1.9 Saudi Arabia
13.5.1.9.1 Saudi Arabia Vertiports Market by Type
13.5.1.9.2 Saudi Arabia Vertiports Market by Solution
13.5.1.9.3 Saudi Arabia Vertiports Market by Location
13.5.1.9.4 Saudi Arabia Vertiports Market by Landscape
13.5.1.9.5 Saudi Arabia Vertiports Market by Topology
13.5.1.10 Qatar
13.5.1.10.1 Qatar Vertiports Market by Type
13.5.1.10.2 Qatar Vertiports Market by Solution
13.5.1.10.3 Qatar Vertiports Market by Location
13.5.1.10.4 Qatar Vertiports Market by Landscape
13.5.1.10.5 Qatar Vertiports Market by Topology
13.5.1.11 Rest of Middle East
13.5.1.11.1 Rest of Middle East Vertiports Market by Type
13.5.1.11.2 Rest of Middle East Vertiports Market by Solution
13.5.1.11.3 Rest of Middle East Vertiports Market by Location
13.5.1.11.4 Rest of Middle East Vertiports Market by Landscape
13.5.1.11.5 Rest of Middle East Vertiports Market by Topology
13.5.2 Africa
13.5.2.1 Africa Vertiports Market by Country
13.5.2.2 Africa Vertiports Market by Type
13.5.2.3 Africa Vertiports Market by Solution
13.5.2.4 Africa Vertiports Market by Location
13.5.2.5 Africa Vertiports Market by Landscape
13.5.2.6 Africa Vertiports Market by Topology
13.5.2.7 Nigeria
13.5.2.7.1 Nigeria Vertiports Market by Type
13.5.2.7.2 Nigeria Vertiports Market by Solution
13.5.2.7.3 Nigeria Vertiports Market by Location
13.5.2.7.4 Nigeria Vertiports Market by Landscape
13.5.2.7.5 Nigeria Vertiports Market by Topology
13.5.2.8 South Africa
13.5.2.8.1 South Africa Vertiports Market by Type
13.5.2.8.2 South Africa Vertiports Market by Solution
13.5.2.8.3 South Africa Vertiports Market by Location
13.5.2.8.4 South Africa Vertiports Market by Landscape
13.5.2.8.5 South Africa Vertiports Market by Topology
13.5.2.9 Rest of Africa
13.5.2.9.1 Rest of Africa Vertiports Market by Type
13.5.2.9.2 Rest of Africa Vertiports Market by Solution
13.5.2.9.3 Rest of Africa Vertiports Market by Location
13.5.2.9.4 Rest of Africa Vertiports Market by Landscape
13.5.2.9.5 Rest of Africa Vertiports Market by Topology
13.6 Latin America
13.6.1 Latin America Vertiports Market by Country
13.6.2 Latin America Vertiports Market by Type
13.6.3 Latin America Vertiports Market by Solution
13.6.4 Latin America Vertiports Market by Location
13.6.5 Latin America Vertiports Market by Landscape
13.6.6 Latin America Vertiports Market by Topology
13.6.7 Brazil
13.6.7.1 Brazil Vertiports Market by Type
13.6.7.2 Brazil Africa Vertiports Market by Solution
13.6.7.3 Brazil Vertiports Market by Location
13.6.7.4 Brazil Vertiports Market by Landscape
13.6.7.5 Brazil Vertiports Market by Topology
13.6.8 Argentina
13.6.8.1 Argentina Vertiports Market by Type
13.6.8.2 Argentina Vertiports Market by Solution
13.6.8.3 Argentina Vertiports Market by Location
13.6.8.4 Argentina Vertiports Market by Landscape
13.6.8.5 Argentina Vertiports Market by Topology
13.6.9 Colombia
13.6.9.1 Colombia Vertiports Market by Type
13.6.9.2 Colombia Vertiports Market by Solution
13.6.9.3 Colombia Vertiports Market by Location
13.6.9.4 Colombia Vertiports Market by Landscape
13.6.9.5 Colombia Vertiports Market by Topology
13.6.10 Rest of Latin America
13.6.10.1 Rest of Latin America Vertiports Market by Type
13.6.10.2 Rest of Latin America Vertiports Market by Solution
13.6.10.3 Rest of Latin America Vertiports Market by Location
13.6.10.4 Rest of Latin America Vertiports Market by Landscape
13.6.10.5 Rest of Latin America Vertiports Market by Topology

14 Company Profile
14.1 Altaport Inc.
14.1.1 Company Overview
14.1.2 Financials
14.1.3 Product/Services Offered
14.1.4 SWOT Analysis
14.1.5 The SNS View
14.2 Aeroauto
14.2.1 Company Overview
14.2.2 Financials
14.2.3 Product/Services Offered
14.2.4 SWOT Analysis
14.2.5 The SNS View
14.3 ANRA TECHNOLOGIES
14.3.1 Company Overview
14.3.2 Financials
14.3.3 Product/Services Offered
14.3.4 SWOT Analysis
14.3.5 The SNS View
14.4 Siemens
14.4.1 Company Overview
14.4.2 Financials
14.4.3 Product/Services Offered
14.4.4 SWOT Analysis
14.4.5 The SNS View
14.5 AIRBUS
14.5.1 Company Overview
14.5.2 Financials
14.5.3 Product/Services Offered
14.5.4 SWOT Analysis
14.5.5 The SNS View
14.6 SITA
14.6.1 Company Overview
14.6.2 Financials
14.6.3 Product/Services Offered
14.6.4 SWOT Analysis
14.6.5 The SNS View
14.7 BAYARDS VERTIPORTS
14.7.1 Company Overview
14.7.2 Financials
14.7.3 Product/Services Offered
14.7.4 SWOT Analysis
14.7.5 The SNS View
14.8 SKYPORTS INFRASTRUCTURE LIMITED
14.8.1 Company Overview
14.8.2 Financials
14.8.3 Product/Services Offered
14.8.4 SWOT Analysis
14.8.5 The SNS View
14.9 Ferrovial
14.9.1 Company Overview
14.9.2 Financials
14.9.3 Product/Services Offered
14.9.4 SWOT Analysis
14.9.5 The SNS View
14.10 Volocopter GmbH
14.10.1 Company Overview
14.10.2 Financials
14.10.3 Product/Services Offered
14.10.4 SWOT Analysis
14.10.5 The SNS View

14.11 Lilium Aviation GmBH
14.11.1 Company Overview
14.11.2 Financials
14.11.3 Product/Services Offered
14.11.4 SWOT Analysis
14.11.5 The SNS View

14.12 Skyways
14.12.1 Company Overview
14.12.2 Financials
14.12.3 Product/Services Offered
14.12.4 SWOT Analysis
14.12.5 The SNS View


14.13 Urban V S.P.A
14.13.1 Company Overview
14.13.2 Financials
14.13.3 Product/Services Offered
14.13.4 SWOT Analysis
14.13.5 The SNS View

14.14 Skyscape Inc.
14.14.1 Company Overview
14.14.2 Financials
14.14.3 Product/Services Offered
14.14.4 SWOT Analysis
14.14.5 The SNS View
 

15.15 Skyportz
15.15.1 Company Overview
15.15.2 Financials
15.15.3 Product/Services Offered
15.15.4 SWOT Analysis
15.15.5 The SNS View
 

15. Competitive Landscape
15.1 Competitive Benchmarking
15.2 Market Share Analysis
15.3 Recent Developments
15.3.1 Industry News
15.3.2 Company News
15.3.3 Mergers & Acquisitions

16. USE Cases and Best Practices

17. Conclusion

An accurate research report requires proper strategizing as well as implementation. There are multiple factors involved in the completion of good and accurate research report and selecting the best methodology to compete the research is the toughest part. Since the research reports we provide play a crucial role in any company’s decision-making process, therefore we at SNS Insider always believe that we should choose the best method which gives us results closer to reality. This allows us to reach at a stage wherein we can provide our clients best and accurate investment to output ratio.

Each report that we prepare takes a timeframe of 350-400 business hours for production. Starting from the selection of titles through a couple of in-depth brain storming session to the final QC process before uploading our titles on our website we dedicate around 350 working hours. The titles are selected based on their current market cap and the foreseen CAGR and growth.


The 5 steps process:

Step 1: Secondary Research:

Secondary Research or Desk Research is as the name suggests is a research process wherein, we collect data through the readily available information. In this process we use various paid and unpaid databases which our team has access to and gather data through the same. This includes examining of listed companies’ annual reports, Journals, SEC filling etc. Apart from this our team has access to various associations across the globe across different industries. Lastly, we have exchange relationships with various university as well as individual libraries.

Secondary Research

Step 2: Primary Research

When we talk about primary research, it is a type of study in which the researchers collect relevant data samples directly, rather than relying on previously collected data.  This type of research is focused on gaining content specific facts that can be sued to solve specific problems. Since the collected data is fresh and first hand therefore it makes the study more accurate and genuine.

We at SNS Insider have divided Primary Research into 2 parts.

Part 1 wherein we interview the KOLs of major players as well as the upcoming ones across various geographic regions. This allows us to have their view over the market scenario and acts as an important tool to come closer to the accurate market numbers. As many as 45 paid and unpaid primary interviews are taken from both the demand and supply side of the industry to make sure we land at an accurate judgement and analysis of the market.

This step involves the triangulation of data wherein our team analyses the interview transcripts, online survey responses and observation of on filed participants. The below mentioned chart should give a better understanding of the part 1 of the primary interview.

Primary Research

Part 2: In this part of primary research the data collected via secondary research and the part 1 of the primary research is validated with the interviews from individual consultants and subject matter experts.

Consultants are those set of people who have at least 12 years of experience and expertise within the industry whereas Subject Matter Experts are those with at least 15 years of experience behind their back within the same space. The data with the help of two main processes i.e., FGDs (Focused Group Discussions) and IDs (Individual Discussions). This gives us a 3rd party nonbiased primary view of the market scenario making it a more dependable one while collation of the data pointers.

Step 3: Data Bank Validation

Once all the information is collected via primary and secondary sources, we run that information for data validation. At our intelligence centre our research heads track a lot of information related to the market which includes the quarterly reports, the daily stock prices, and other relevant information. Our data bank server gets updated every fortnight and that is how the information which we collected using our primary and secondary information is revalidated in real time.

Data Bank Validation

Step 4: QA/QC Process

After all the data collection and validation our team does a final level of quality check and quality assurance to get rid of any unwanted or undesired mistakes. This might include but not limited to getting rid of the any typos, duplication of numbers or missing of any important information. The people involved in this process include technical content writers, research heads and graphics people. Once this process is completed the title gets uploader on our platform for our clients to read it.

Step 5: Final QC/QA Process:

This is the last process and comes when the client has ordered the study. In this process a final QA/QC is done before the study is emailed to the client. Since we believe in giving our clients a good experience of our research studies, therefore, to make sure that we do not lack at our end in any way humanly possible we do a final round of quality check and then dispatch the study to the client.

Start a Conversation

Hi! Click one of our member below to chat on Phone