Vector Database Market Report Scope & Overview:
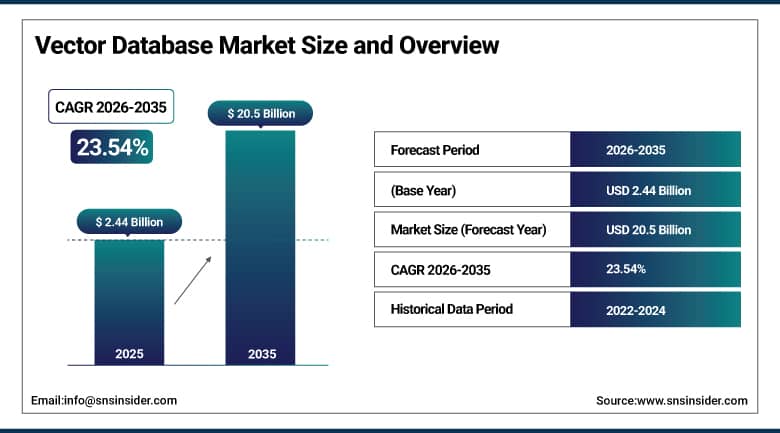
Vector Database Market was valued at USD 2.44 billion in 2025 and is expected to reach USD 20.5 billion by 2035, growing at a CAGR of 23.54% from 2026-2035.
The growth of the Vector Database Market is driven by rapid expansion of artificial intelligence, machine learning, and generative AI applications requiring efficient similarity search and unstructured data management. Increasing adoption of large language models, recommendation systems, and semantic search across industries is boosting demand. Enterprises are increasingly shifting toward real-time analytics and high-dimensional data processing capabilities. Additionally, rising cloud adoption, growing data volumes, and need for scalable, low-latency database solutions are further accelerating deployment of vector databases across technology-driven organizations globally.
Vector Database Market Size and Forecast
-
Market Size in 2025: USD 2.44 Billion
-
Market Size by 2035: USD 20.5 Billion
-
CAGR: 23.54% from 2026 to 2035
-
Base Year: 2025
-
Forecast Period: 2026-2035
-
Historical Data: 2022-2024
To Get More Information On Vector Database Market - Request Free Sample Report
Vector Database Market Trends
-
Rising demand for high-performance data retrieval in AI, machine learning, and generative AI applications is driving the vector database market.
-
Growing adoption in semantic search, recommendation systems, and natural language processing is boosting market growth.
-
Expansion of unstructured data from text, images, audio, and video sources is fueling deployment.
-
Increasing focus on real-time similarity search and contextual data understanding is shaping adoption trends.
-
Advancements in embedding models, indexing techniques, and distributed database architectures are enhancing speed and scalability.
-
Rising integration with cloud platforms and AI development frameworks is supporting market expansion.
-
Collaborations between database providers, AI companies, and cloud service vendors are accelerating innovation and global adoption.
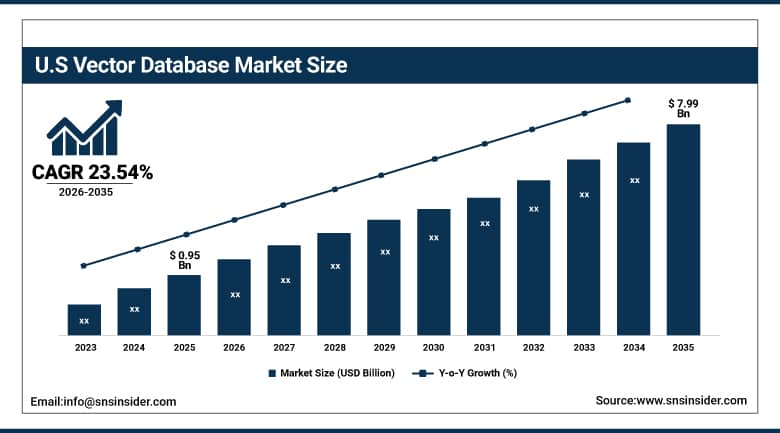
U.S. Vector Database Market was valued at USD 0.95 billion in 2025 and is expected to reach USD 7.99 billion by 2035, growing at a CAGR of 23.54% from 2026-2035.
The United States Vector Database Market is very well developed and growing at a fast pace due to its high-level implementation of artificial intelligence, machine learning, and generative AI. The presence of a strong cloud-based ecosystem, technology leaders, and high demand for real-time data analysis are boosting the growth of the market.
Pinecone raised USD 100 million at a USD 750 million valuation in 2023, reflecting investor confidence in dedicated vector database infrastructure as a commercially durable category alongside hyperscaler vector offerings.
Vector Database Market Segment Analysis
-
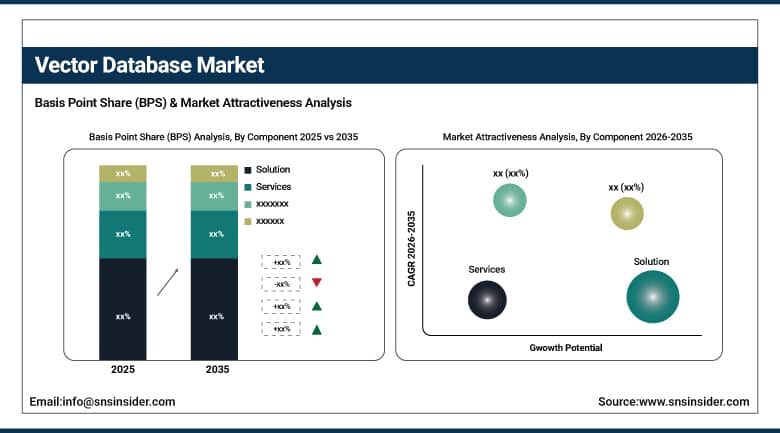
By Component, Solution segment dominated the Vector Database Market in 2025 with 72% share; Services segment fastest growing (CAGR).
-
By Technology, Recommendation Systems segment dominated the Vector Database Market in 2025 with 38% share; Natural Language Processing segment fastest growing (CAGR).
-
By Vertical, BFSI segment dominated the Vector Database Market in 2025 with 28% share; Healthcare & Life Sciences segment fastest growing (CAGR).
By Component, Solution segment dominates the Vector Database Market, Services segment expected to grow fastest.
Solution segment dominated the Vector Database Market in 2025 due to strong enterprise demand for ready-to-deploy infrastructure supporting similarity search, embeddings storage, and real-time analytics. Organizations prefer complete platforms over standalone tools to simplify AI integration and reduce development complexity. Growing adoption of large language models and generative AI further increased reliance on scalable, high-performance vector database solutions embedded within end-to-end AI and data management ecosystems across industries.
Services segment is growing at the fastest CAGR due to increasing demand for implementation support, customization, integration, and managed vector database operations. Enterprises lack in-house expertise to optimize vector search architectures and AI workflows, driving reliance on consulting and managed services. Rising complexity of AI deployments, cloud migration needs, and continuous model tuning requirements further accelerate service adoption, especially among mid-sized organizations scaling generative AI and intelligent search applications globally.
By Technology, Recommendation Systems segment dominates the Vector Database Market, Natural Language Processing (NLP) segment expected to grow fastest.
Recommendation Systems segment dominated the Vector Database Market in 2025 due to extensive use in e-commerce, streaming platforms, and digital advertising. Vector databases enable high-speed similarity search and personalized content delivery, improving user engagement and conversion rates. Large-scale platforms rely heavily on recommendation engines powered by embeddings for real-time decision-making. Continuous growth in online consumption and personalization-driven business models further strengthened dominance of recommendation-based applications across industries worldwide.
Natural Language Processing (NLP) segment is the fastest growing due to rapid expansion of generative AI, chatbots, and semantic search applications. Vector databases play a critical role in enabling contextual understanding, semantic similarity, and retrieval-augmented generation (RAG) systems. Increasing enterprise adoption of AI assistants and conversational platforms drives demand. Growth is further supported by multilingual data processing needs and rising investments in AI-driven customer engagement solutions across global markets.
By Vertical, BFSI segment dominates the Vector Database Market, Healthcare & Life Sciences segment expected to grow fastest.
BFSI segment dominated the Vector Database Market in 2025 due to strong demand for fraud detection, risk analysis, customer personalization, and real-time transaction monitoring. Financial institutions leverage vector databases to enhance anomaly detection and improve decision-making using unstructured and behavioral data. Strict regulatory requirements and the need for secure, scalable AI systems further drive adoption. High digital transformation investments across banking and insurance sectors reinforce BFSI leadership in this market.
Healthcare & Life Sciences segment is the fastest growing due to increasing adoption of AI-driven diagnostics, drug discovery, and patient data analysis. Vector databases enable efficient processing of complex medical records, research papers, and genomic data for faster insights. Growing demand for precision medicine and personalized healthcare solutions accelerates usage. Rising investments in digital health infrastructure and AI-powered clinical decision support systems further boost rapid expansion in this segment globally.
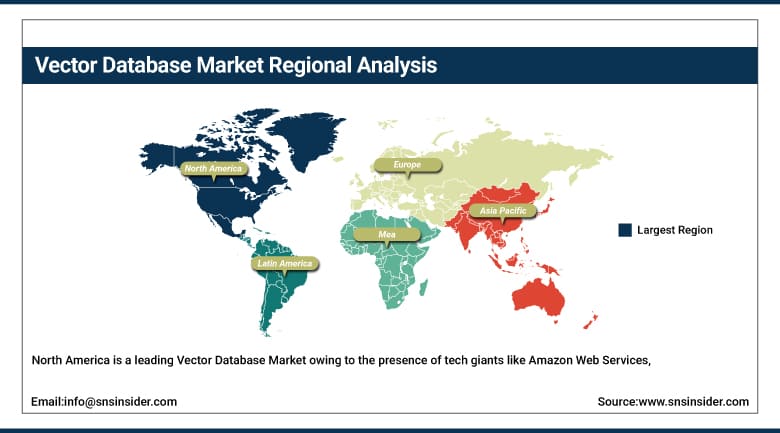
Vector Database Market Regional Analysis
|
Region |
Major Country |
Share within Region (%) |
|---|---|---|
|
North America |
United States |
88% |
|
Asia Pacific |
China |
45% |
|
Europe |
Germany |
24% |
|
Middle East & Africa |
Israel |
38% |
|
Latin America |
Brazil |
48% |
North America Vector Database Market Insights
North America is a leading Vector Database Market owing to the presence of tech giants like Amazon Web Services, Microsoft, and Google, who keep developing their AI and cloud computing technologies. Being the first adopter of generative AI technology, big language models, and analytics in various fields such as healthcare, finance, retail, and autonomy, North America enjoys a well-established cloud computing industry along with robust venture capital investment and an active startup community. This helps in fast adoption and implementation of vector database solutions. Moreover, high research & development spending, ample supply of AI talent, and full-scale digitization of enterprises provide scalability for adopting vector database solutions.
Get Customized Report as Per Your Business Requirement - Enquiry Now
Asia Pacific Vector Database Market Insights
Asia Pacific is the fastest-growing regional Vector Database Market, driven by rapid AI adoption in China, India, Japan, and South Korea, growing cloud infrastructure deployment, and government AI investment programs that are creating the AI application ecosystem that drives vector database demand. China's domestic AI industry including Baidu's Wenxin platform, Alibaba's Tongyi Qianwen, and ByteDance's AI research creates domestic demand for vector database infrastructure that Chinese cloud providers including Alibaba Cloud and Tencent Cloud are serving. India's growing AI application development community centered on Bangalore, Hyderabad, and Mumbai is creating both domestic vector database deployment and India-based development services that serve global markets.
Europe Vector Database Market Insights
Europe's Vector Database Market is growing steadily with a particular emphasis on privacy-compliant vector search architectures that satisfy GDPR requirements. The fundamental tension between vector database use and GDPR is real text embeddings can sometimes reconstruct personal information from the embedded content, raising data minimization concerns under GDPR Article 5. European vector database deployments are increasingly designed with differential privacy techniques, on-premises deployment options, and EU-sovereign cloud infrastructure that address these concerns while enabling AI application deployment. European AI companies and the continent's growing enterprise AI investment are sustaining vector database market growth.
Middle East & Africa and Latin America Vector Database Market Insights
Middle East & Africa and Latin America have the potential to be Vector Database Markets in the making, owing to the growing number of digital transformation projects and increasing cloud infrastructure being provided by companies such as Oracle. Governments in countries like UAE and Saudi Arabia have been adopting various AI projects and smart cities, creating demand for sophisticated databases. In Latin America, countries such as Brazil and Mexico have experienced an increase in the use of AI-based applications in finance, eCommerce, and customer analytics. Despite the existence of infrastructure and talent deficiencies, the development of the startup ecosystem, partnerships, and awareness among enterprises are facilitating the adoption of vector databases.
Vector Database Market Growth Drivers:
-
Generative AI deployment and RAG architecture adoption creating transformative vector database market growth globally
The vector database market's growth is fundamentally the infrastructure consequence of generative AI's commercial deployment. Every organization building a production AI application that needs to retrieve relevant information from a knowledge base a product catalog, a document repository, a customer interaction history, a regulatory reference library needs vector search to make that retrieval semantically meaningful rather than keyword-limited. The RAG architecture has become the enterprise AI deployment pattern of choice precisely because it provides LLMs with relevant context without the cost and complexity of fine-tuning the model itself. And RAG requires vector databases. This architectural dependency creates demand that grows with every enterprise AI application deployed, making vector database adoption a lagging but reliable indicator of AI deployment scale across the enterprise market.
Vector Database Market Restraints:
-
High operational complexity and hyperscaler competition creating adoption challenges for standalone vector database vendors
Vector database management at production scale involves operational complexity that general-purpose database administrators are not prepared for by their existing experience. Managing vector index configurations, monitoring recall quality as data distributions shift, optimizing memory-disk tradeoffs for cost management, and updating embeddings when the underlying model changes are all operationally demanding tasks specific to vector database systems. The rapid emergence of competitive vector database offerings from AWS, Google, and Azure built into platforms that organizations already use for their broader data infrastructure creates significant commercial pressure on standalone vector database vendors who must differentiate on performance, features, or support depth to justify separate procurement alongside an existing cloud platform relationship.
Vector Database Market Opportunities:
-
Multimodal AI search and real-time knowledge graph integration creating new vector database growth opportunities globally
Multimodal vector searches the ability to search across different data modalities (text, images, audio, video) using a unified vector representation represents the vector database market's most commercially compelling near-term technical frontier. GPT-4V, Gemini Multimodal, and Claude's vision capabilities all generate vector embeddings across modalities that must be stored, indexed, and searched with the same efficient approximate nearest neighbor algorithms that text embeddings use. E-commerce product search that combines a customer's text description with an uploaded photo, medical diagnosis support that searches a radiology image against a clinical text knowledge base, and security surveillance that matches video frames against identity records are all multimodal AI applications whose vector database requirements exceed what single-modality systems provide. Vendors who deliver reliable multimodal vector search at production scale will access application categories that single-modality databases cannot serve.
Recent Developments:
-
2026: Pinecone launched Pinecone Assistant, an enterprise RAG platform that combines vector database infrastructure with LLM orchestration and conversation management, enabling organizations to deploy production knowledge-grounded AI assistants without assembling separate vector database, LLM API, and application logic components compressing typical RAG deployment timelines from months to days for standard enterprise knowledge base use cases.
-
2025: Weaviate released Weaviate 1.25 with native multimodal vector storage supporting concurrent text, image, and structured data vector indexes within a single database instance, enabling e-commerce and media applications to execute cross-modal semantic search queries that retrieve results matching query intent across different content types from a unified search interface.
Vector Database Market Key Players
Some of the Vector Database Market Companies
-
Pinecone Systems Inc.
-
Weaviate B.V.
-
Zilliz Inc. (Milvus)
-
Qdrant Solutions GmbH
-
Chroma Inc.
-
LanceDB Inc.
-
Marqo Ltd.
-
Vespa.ai (Yahoo)
-
Redis Ltd. (Redis Vector)
-
MongoDB Inc. (Atlas Vector Search)
-
Elasticsearch B.V. (Elastic)
-
DataStax Inc.
-
SingleStore Inc.
-
Pgvector (Supabase)
-
Amazon Web Services Inc. (OpenSearch/Aurora)
-
Microsoft Corporation (Azure AI Search)
-
Google LLC (Vertex AI Vector Search)
-
Oracle Corporation (AI Vector Search)
-
Activeloop Inc.
-
KX Systems Inc.
|
Report Attributes |
Details |
|
Market Size in 2025 |
USD 2.44 Billion |
|
Market Size by 2035 |
USD 20.5 Billion |
|
CAGR |
CAGR of 23.38% From 2026 to 2035 |
|
Base Year |
2025 |
|
Forecast Period |
2026-2035 |
|
Historical Data |
2022-2024 |
|
Report Scope & Coverage |
Market Size, Segments Analysis, Competitive Landscape, Regional Analysis, DROC & SWOT Analysis, Forecast Outlook |
|
Key Segments |
• By Component (Solution, Services) |
|
Regional Analysis/Coverage |
North America (US, Canada), Europe (Germany, UK, France, Italy, Spain, Russia, Poland, Rest of Europe), Asia Pacific (China, India, Japan, South Korea, Australia, ASEAN Countries, Rest of Asia Pacific), Middle East & Africa (UAE, Saudi Arabia, Qatar, South Africa, Rest of Middle East & Africa), Latin America (Brazil, Argentina, Mexico, Colombia, Rest of Latin America). |
|
Company Profiles |
Pinecone Systems Inc., Weaviate B.V., Zilliz Inc. (Milvus), Qdrant Solutions GmbH, Chroma Inc., LanceDB Inc., Marqo Ltd., Vespa.ai (Yahoo), Redis Ltd. (Redis Vector), MongoDB Inc. (Atlas Vector Search), Elasticsearch B.V. (Elastic), DataStax Inc., SingleStore Inc., Pgvector (Supabase), Amazon Web Services Inc. (OpenSearch/Aurora), Microsoft Corporation (Azure AI Search), Google LLC (Vertex AI Vector Search), Oracle Corporation (AI Vector Search), Activeloop Inc., KX Systems Inc. |
Frequently Asked Questions
Ans- Storing and processing vast amounts of sensitive data in vector databases raises concerns about privacy, security, and regulatory compliance.
Ans- The increasing use of AI-driven applications, such as recommendation engines and fraud detection, is fueling the demand for vector databases.
Ans- Asia-Pacific is expected to register the fastest CAGR during the forecast period.
Ans: The Vector Database Market is expected to grow at a CAGR of 23.54% from 2026 to 2035.
Ans: The Vector Database Market was valued at USD 2.44 billion in 2025.
Get in Touch
