Virtual Care Market Size Analysis:
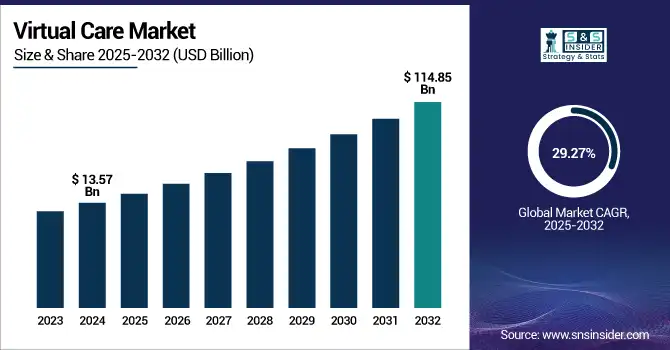
The Virtual Care Market size was valued at USD 13.57 billion in 2024 and is expected to reach USD 114.85 billion by 2032, growing at a CAGR of 29.27% over the forecast period of 2025-2032.
The global virtual care market is experiencing strong growth spurred by increasing demand for convenient and affordable healthcare solutions. The introduction of telehealth platforms, Artificial Intelligence, and the use of remote monitoring have all contributed to an ever-increasing variety of care being delivered across key areas from primary care to chronic disease management through to mental health.
To Get more information on Virtual Care Market - Request Free Sample Report
The U.S. virtual care market size was valued at USD 4.75 billion in 2024 and is expected to reach USD 39.18 billion by 2032, growing at a CAGR of 28.84% over the forecast period of 2025-2032. In North America, the U.S. accounts for the largest share of the virtual care market due to contemporary healthcare infrastructure, early adoption of digital health technologies, and enabling federal policies and reimbursement frameworks. The early adoption of telehealth solutions throughout hospitals, clinics, and pharmacies, combined with increased consumer acceptance and near-universal provider readiness, has made the country a virtual care delivery leader.
The Home as a Health Care Hub initiative from the August 2024 FDA expands several home environments to incorporate them into the integrated healthcare system to support health equity.
Virtual Care Market Dynamics:
Drivers
-
Market Growth is Propelled by Technological Advancements
Technological innovations are the biggest driver for virtual care growth. New technologies, such as artificial intelligence (AI), machine learning, and data analytics bring breakthroughs in smart healthcare services and open up new possibilities for virtual care platforms to provide personalized services. AI-based imaging tools, for instance, are employed to assess patient symptoms and medical history to help clinicians arrive at faster and more accurate decisions. The availability of cloud computing allows safe storage and sharing of patient information in real-time, supporting better coordination among care providers. Virtual care platforms also integrate mobile health apps and wearables to improve continuous monitoring and engagement with patients remotely. These innovations increase the efficiency, reliability, and attractiveness of virtual care for clinical providers and patients.
AI-enabled treatment planning with personalized care plans based on historical insights and Generative AI in 2025. This innovation increases the efficacy of remote patient monitoring, enabling personalized and efficient care.
AI-powered telemedicine solutions have quickly evolved in 2024, enabling remote patient monitoring, virtual health assistants, and predictive analytics. Such innovations are broadening the scale and improving the quality of virtual care services.
-
Market Growth is Radiated by Enhanced Internet and Smartphone Penetration
Improvements in high-speed internet availability and near-universal smartphone adoption are key drivers of virtual care implementation. With improved internet coverage, namely broadband and 4G/5G networks, patients and healthcare providers can have high-quality video consultations without interruptions and lags. Central for access via a smartphone, which is now always available with that person, so patients can link to their doctor, health apps, reminders, and share health data. Widespread smartphone ownership globally, in cities, and in the vast majority of rural areas, allows for greater access to virtual care. By eliminating much of the geographic and logistical reach, nearly anyone can connect to virtual healthcare for their timely, on-demand medical needs.
Restraint:
-
Market Growth is Restrained by Limited Internet Access and Digital Literacy
The digital divide between population strata is one of the biggest restraints to virtual care market growth. Reliable internet connectivity is still not available in large parts of the world, especially in underserved or rural regions. In more advanced regions, high-speed broadband mobile data facilities will not be constant or affordable for some sectors. Virtual care only works when patients can connect to it, but without reliable internet access, patients cannot join video consultations, cannot use our mobile health applications, cannot upload health data at home, and do not have access to the benefits of virtual care.
Virtual Care Market Segmentation Analysis:
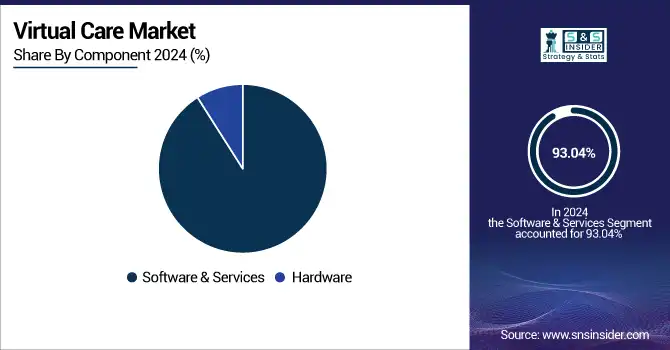
By Component
In 2024, the Software & Services segment led the virtual care market share of 93.04% due to its vital role in facilitating the consistent delivery of care. Within this category, there are telehealth platforms, mobile apps, EHR integration, and cloud-based services that provide the technological framework for virtual care. More healthcare providers are depending on these solutions to manage remote consultations, patient records, diagnostics, and scheduling. Post-pandemic, many digital tools adopted by patients and providers to ensure continuity of care have accelerated this demand for secure, intuitive, and interoperable platforms.
The software & services segment is anticipated to experience the fastest growth through the forecast period due to the rising technical innovation and investment in AI, machine learning, and data analytics as further motivation. They improve decision-making, personalized treatment, and patient engagement. Cloud-based solutions appeal to healthcare systems looking to expand access while controlling operational costs, as they offer scalability and flexibility as well. Long term, this segment will likely be the polymer of the virtual care market as it increasingly dovetails with wearables, mobile health platforms, and third-party digital health tools that drive demand for advanced software services.
By Consultation Type
The video consultation segment dominated the virtual care market with a 68.2% market share in 2024, as it closely simulates in-person interactions between patients and healthcare providers. Compared to traditional telephonic conversations, video consultations provide true real-time interaction, facilitating meaningful discussions, complete assessments, instant feedback, and familiarization between physician and a relationship between doctor and patient. Especially for specialties that benefit from visual inspection, including dermatology and mental health, this is the preferred format. The abundance of high-speed internet access and consumer-friendly video platforms helped boost adoption, making video consultations the most trusted and widely used type of virtual care.
The messaging segment is anticipated to grow at the fastest rate during the forecast period, owing to its convenience, flexibility, and asynchronous communication. Patients and providers can communicate via messages without having to coordinate schedules, perfect for quick follow-ups, prescription refills, or non-urgent consultations. The rapid proliferation of AI-based chatbots and secure messaging apps allows for greater responsiveness and patient engagement, while also relieving the strain on healthcare providers. Messaging is quickly emerging as an adjunct and scalable option for virtual care, given the increasing use of mobile devices across various patient demographics and demand for convenient and on-demand care.
By Application
The family medicine segment dominated the virtual care market in 2024, due to the entry of a large number of patients and the wide spectrum of common healthcare needs across the lifetime of all age groups. Family medicine providers are the first line of care for patients, treating acute illness, managing chronic disease, providing prevention, and health education. The ease of access to virtual care makes it a perfect solution for regular check–ups and continued care, especially for time-strapped families and people who cannot easily get around. The extensive use of and need for family medicine services explain their large market share.
The segment of dermatology is projected to witness the fastest growth during the forecast period with a 30.11% CAGR, owing to its strong applicability for virtual consultations. Face-to-face visual examination is critical in dermatology, but this can often be done with high-resolution images and a video consultation. Value of virtual dermatology services due to the rising burden of skin disorders, along with the developing patient inclination in the direction of remote treatment as a non-visit treatment choice, clinics are projected to pressure the market. Moreover, the combination of AI-driven diagnostic tools and mobile apps for skin monitoring is increasing virtual dermatology accuracy and convenience, resulting in a fast-growing adoption rate and market growth.
By End-User
In 2024, the hospitals & clinics segment dominated the virtual care market with a 76.13% market share, as these are the primary facilities for the delivery of comprehensive healthcare services and have been early adopters of virtual care technologies. Virtual care platforms used by hospitals and clinics help improve patient access while decreasing congestion and coordinating care, especially for follow-ups and chronic disease management.
The pharmacies segment is projected to show the fastest growth during the forecast period as pharmacies rapidly expand their services from merely dispensing medication to providing viable telehealth consultations and remote patient monitoring. As more consumers seek comfortable accessibility to healthcare, pharmacies continue to embrace virtual care solutions as virtual care for medication management, wellness information, and checking for minor ailments. These changes, along with the increasing collaboration between pharmacy and digital health companies, establish pharmacies as one of the fastest-growing channels for virtual care access, particularly in rural or underserved areas.
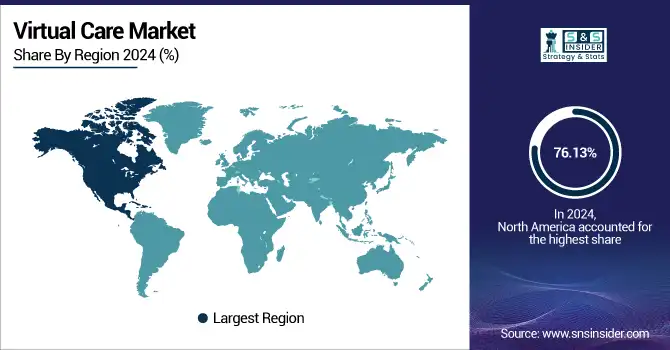
Regional Insights:
North America dominated the virtual care market in 2024 with a 76.13% market share in terms of healthcare infrastructure, high digital literacy, and strong support from federal regulations. This region has become a leader in virtual care due to the presence of top virtual care providers such as Teladoc Health, Amwell, and MDLIVE, and a number of investments in telehealth technology. The need for more remote care combined with government initiatives and reimbursement frameworks, such as Medicare and Medicaid telehealth coverage in the U.S. and Canada, expanding virtual care, has only made adoption of these technologies happen faster. Widespread smartphone penetration and high-speed internet access across urban and rural populations also ensure rapid virtual consultations.
According to a Deloitte survey, just over half (53%) of consumers believe generative AI will improve access to healthcare, and 46% think AI will reduce the costs of medications and treatments to make healthcare more affordable to everyday Americans.
The virtual care market in Asia Pacific is rapidly rising as the fastest growing region with a 30.27% CAGR over the forecast period due to the rapid development of technology, growing demand for healthcare, as well as the expansion of internet connectivity. Vast populations and rising chronic disease prevalence, coupled with a dearth of in-person healthcare access in rural areas, across top countries, such as China, India, Japan, and South Korea, are fueling sky-high virtual care usage. The expansion of domestic and international players, government support for digital health infrastructure, and the rapidly expanding use of mobile-health apps all support accelerated virtual care market trends in the region. Telehealth as a strategic response to closing healthcare access gaps continues to attract attention in the Asia Pacific as a high-potential market.
The virtual care market in Europe is witnessing substantial growth due to the growing elderly population and increasing burden of chronic diseases. Strong investments in basic infrastructure, alongside supportive policies (expanded insurance reimbursements, eased regulations on virtual consultations), have facilitated widespread adoption of telehealth across the region’s governments. Better internet and high smartphone penetration, and the quick adoption of AI-based diagnostics, the cloud, rapid point-of-care devices, wearables, and remote monitoring tools, are changing the way care is delivered.
Moderate growth is projected for the virtual care market in Latin America, driven by the proliferation of digital health solutions, the increasing prevalence of chronic diseases, and the growing mobile and internet penetration. Virtual care is slowly becoming a part of the healthcare fabric, particularly if there are national programs in place from the public and/or private sectors to enhance access to care in remote and otherwise underserved areas.
Virtual care adoption is also steadily moving in the Middle East & Africa (MEA). For instance, as part of wider attempts to modernise health systems, governments in the UAE and Saudi Arabia are now ramping up investments in digital health infrastructure and telehealth platforms. Increasing penetration of smartphones and rising awareness of the benefits of telemedicine services are aiding demand, especially in urban areas.
Get Customized Report as per Your Business Requirement - Enquiry Now
Key Virtual Care Market Players:
The key virtual care companies are Teladoc Health, Amwell, MDLIVE, Doctor on Demand, Cerner Corporation, Philips Healthcare, Babylon Health, eVisit, Siemens Healthineers, Included Health, and other players.
Recent Developments in the Virtual Care Market:
-
March 2025 – Teladoc Health, the world's largest provider of virtual care, today released improved capabilities within its care delivery platform, Prism. The new capabilities enhance coordination of care by integrating better with digital health partners and community-based care providers.
-
September 2024 – Cigna launched a new feature called E-Treatment through its MDLIVE platform. Through this service, members can receive urgent care without having to undergo a phone or video consultation by responding to an online questionnaire, making it easier to have access to treatment for everyday conditions.
| Report Attributes | Details |
|---|---|
| Market Size in 2024 | USD 13.57 Billion |
| Market Size by 2032 | USD 114.85 Billion |
| CAGR | CAGR of 29.27% From 2025 to 2032 |
| Base Year | 2024 |
| Forecast Period | 2025-2032 |
| Historical Data | 2021-2023 |
| Report Scope & Coverage | Market Size, Segments Analysis, Competitive Landscape, Regional Analysis, DROC & SWOT Analysis, Forecast Outlook |
| Key Segments | • By Component (Software & Services, Hardware) • By Consultation Type (Video Consultation, Audio Consultation, Kiosks, Messaging) • By Application (Allergy & Immunology, Pediatrics, Family Medicine, Internal Medicine, Dermatology, Cardiology, Others) • By End User (Hospitals & Clinics, Pharmacies, Others) |
| Regional Analysis/Coverage | North America (US, Canada, Mexico), Europe (Germany, France, UK, Italy, Spain, Poland, Turkey, Rest of Europe), Asia Pacific (China, India, Japan, South Korea, Singapore, Australia, Rest of Asia Pacific), Middle East & Africa (UAE, Saudi Arabia, Qatar, South Africa, Rest of Middle East & Africa), Latin America (Brazil, Argentina, Rest of Latin America) |
| Company Profiles | Teladoc Health, Amwell, MDLIVE, Doctor on Demand, Cerner Corporation, Philips Healthcare, Babylon Health, eVisit, Siemens Healthineers, Included Health, and other players. |
Get in Touch
