Virtual Desktop Infrastructure Market Report Scope & Overview:
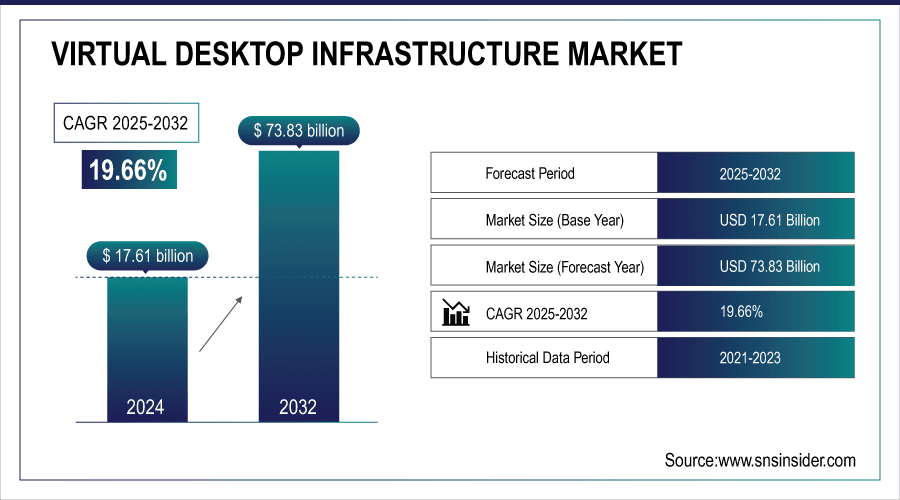
The virtual desktop infrastructure market size was valued at USD 17.61 Billion in 2024 and is projected to reach USD 73.83 Billion by 2032, growing at a CAGR of 19.66% during 2025-2032.
The global market includes a comprehensive virtual desktop infrastructure market analysis with valuable insights on key market dynamics, segmental analysis, and regional dynamics punctuates the shifting role of virtualization technologies. The industry is witnessing exponential growth, fueled by an increase in demand for digital transformation, the growing need for secure work-from-home solutions, and increased adoption of Desktop-as-a-Service (DaaS). Alongside this, enterprises are focusing on optimizing costs, increase data security, and improve IT management which is leading to global adoption of Virtual Desktop Infrastructure (VDI) solutions in numerous industries.
-
Over 60% of businesses leverage cloud-hosted VDI for scalability and faster provisioning of desktops.
-
Over 70% of enterprises are expected to adopt some form of virtualization or DaaS for remote work environments by 2026.
Virtual Desktop Infrastructure Market Trends:
-
Rising adoption of remote and hybrid workspace models is a major growth driver for the Virtual Desktop Infrastructure (VDI) market.
-
Organizations are prioritizing secure, cost-effective, and flexible remote access through centralized desktop and application management.
-
VDI reduces hardware dependency, strengthens endpoint security, and improves workforce productivity across industries such as IT, BFSI, and healthcare.
-
Governments and enterprises in emerging economies (Asia Pacific, Latin America, Middle East) are upgrading IT infrastructure for mobility, compliance, and cybersecurity.
-
Cloud services adoption and expanding enterprise mobility in BFSI, healthcare, and education sectors are accelerating market demand.
-
Local enterprises in high-growth markets are turning to VDI to enhance productivity, efficiency, and IT system simplification.
Virtual Desktop Infrastructure Market Report Highlights:
The U.S. virtual desktop infrastructure market size was valued at USD 6.02 Billion in 2024 and is projected to reach USD 25.09 Billion by 2032, growing at a CAGR of 19.56% during 2025-2032. The U.S. is growing fast and is mostly driven by hybrid work adoption, increasing need for secure remote access, and the presence of big cloud and virtualization players. Larger enterprises are spending on scalable virtual desktop infrastructure (VDI) solutions to enhance worker productivity, ensure compliance, and simplify it complexities. Over the years, this increasing dependence on more agile, secured, and cost-effective solutions is driving the growth of the market across various end-use verticals.
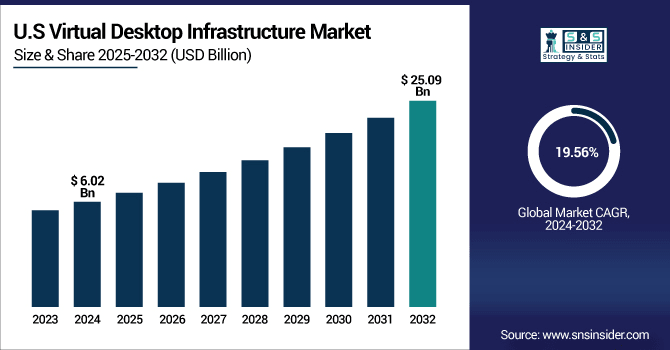
Virtual desktop infrastructure market trends are propelled by hybrid work, increasing adoption of DaaS solutions for secure remote access, and global cloud-based Desktop-as-a-Service (DaaS) solutions market growing stronger.
Virtual Desktop Infrastructure Market Growth Drivers:
-
Growing Remote Workforce and Adoption of Hybrid Work Models Across Enterprises Boost the Demand for Virtual Desktop Infrastructure Solutions
Increasing trend towards remote and hybrid workspace is one of the major growth driving factors for virtual desktop infrastructure market growth. Organizations are prioritizing secure, easy, and cheap remote access to employees who work in various areas by entering applications and desktops for use. VDI solutions offer centralized management, reduced hardware dependency, and improved flexibility, which employees may need consistent and reliable performance, so organizations are increasing their expenditure on VDI due to these advantages. IT, BFSI, healthcare, and other enterprises are increasingly implementing these solutions across the globe to save resources, secure endpoints, and maximize workforce productivity.
Over 80% of global enterprises now support hybrid or remote work, making VDI a critical enabler.
Nearly 75% of companies cite stronger endpoint security and data compliance as the top reason for adopting VDI.
Virtual Desktop Infrastructure Market Restraints:
-
Performance Challenges Due to Network Latency and Bandwidth Limitations Hinder Large-Scale Virtual Desktop Infrastructure Implementations
Virtual desktop infrastructure is quite sensitive to network stability, bandwidth, and latency. This makes it difficult for users to notice and suffer from lag or lack of responsiveness, and even dropped virtual desktop access in situations where connectivity is poor or traffic congestion becomes significant. These problems have a huge impact on both employee productivity and the user experience and leads organizations to avoid scaling VDI deployments. These limitations in turn hinder industries that need real-time processing, such as design, healthcare imaging, or manufacturing. Performance consistency is the miracle of VDI that is yet to happen for the masses, as the major lacking in performance reliability can only be improved when the network infrastructures globally get better.
Virtual Desktop Infrastructure Market Opportunities:
-
Growing Digital Transformation and IT Modernization Initiatives in Emerging Economies Fuel Virtual Desktop Infrastructure Growth Opportunities
The demand for Virtual Desktop Infrastructure solutions along with the digital transformation of nations across emerging economies in Asia Pacific, Latin America, and the Middle East. Today, Governments and enterprises are upgrading their IT infrastructure to accommodate mobility, cybersecurity, and regulatory compliance. Owing to the wider use of cloud services and growing enterprise mobility across sectors including BFSI, healthcare and education, needs for the market are being driven higher. High potential growth markets as local enterprises move towards VDI to drive productivity, operational efficiency and reduce complexity of IT systems.
Over 94% of enterprises globally now use cloud services in some form, boosting reliance on virtual desktops.
More than 60% of public sector bodies globally have invested in digital workplace initiatives, aligning with VDI adoption.
Virtual Desktop Infrastructure Market Segmentation Analysis:
-
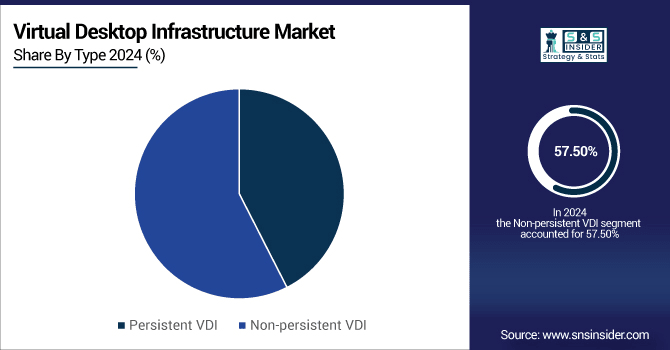
By Type, Non-persistent VDI led with ~57.50% share in 2024 and also fastest growing (CAGR 19.76%)
-
By Application, IT & telecom dominated ~19.80% in 2024; Healthcare fastest growing (CAGR 22.53%)
-
By Deployment Model, Cloud led ~53.80% in 2024 and aslo fastest growing (CAGR 19.73%)
-
By Component, Software led with ~36.78% in 2024; Services fastest growing (CAGR 19.95%)
By Type, Non-persistent VDI Leads Market and Also Registers Fastest Growth
In 2024, non-persistent VDI segment captured a major revenue share of roughly 57.50% in the virtual desktop infrastructure market owing to its scalability and lower storage requirement, and cost effectiveness that attracts enterprises with large workforce. Companies, such as Citrix Systems are pushing these adoptions with session-based desktop virtualization products for vertical industries, such as education and retail. The segment is also projected to witness the highest CAGR of approximately 19.76% over 2024-2032, owing to the growing adoption of session-based workloads and cloud-native deployments.
By Application, IT & telecom Dominate While Healthcare Shows Rapid Growth
The IT & telecom segment accounted for over 19.80% revenue share in 2024, dominating the virtual desktop infrastructure market due to their dependence on remote access, scalability and cloud integration to manage distributed workforce. VMware further consolidates this leadership by providing enterprises globally with the high-performing, secure, and flexible virtualization platforms required to take full advantage of these capabilities. On the other hand, the healthcare segment shows fastest-growing CAGR of nearly 22.53% during the forecasted period of 2024-2032, due to the high adoption rate of telemedicine, electronic health record among organizations, and high need of an organizational data to comply with standards and regulatory requirement.
By Deployment Model, Cloud Lead and Also Registers Fastest Growth
The virtual desktop infrastructure market was dominated by the Cloud segment, holding around 53.80% in terms of revenue in 2024, primarily due to increasing demand for Desktop-as-a-Service (DaaS), lower capital expenditures, and frictionless IT management. As enterprises transition workloads to public and hybrid cloud systems, they are prominent with Microsoft Azure Virtual Desktop at the forefront of the shift. The cloud model is also expected to record the highest CAGR, over 19.73% during the period of 2024–2032 as more businesses are focusing on scalability, cost efficiency, and remote access.
By Component, Software Lead While Services Grows the Fastest
The software segment held the highest revenue share of approximately 36.78% in 2024 due to the innovation of virtualization platforms, enhanced security functions, and centralized IT management features. Availability of Desktop-as-a-Service platforms is no way limited to only direct service providers and players, such as Amazon Web Services (AWS) also play an instrumental role in this market. The services segment is also set to register the highest CAGR of nearly 19.95% during 2024–2032, owing to the growing reliance on consulting, managed services, and technical support by organizations to expand and optimize their VDI deployments.
Asia Pacific Virtual Desktop Infrastructure Market Insights
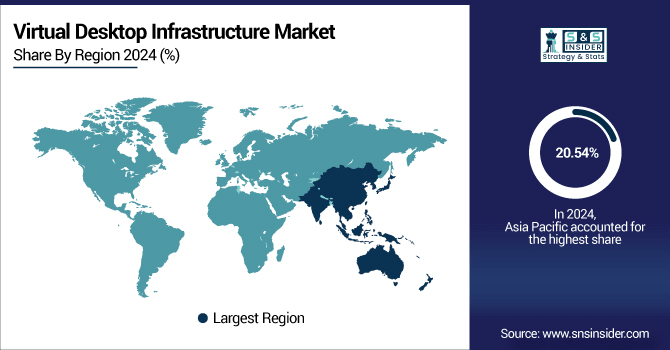
Asia Pacific is estimated to register the highest CAGR of around 20.54% during the forecast period of 2024–2032, due to the digital transformation, increasing cloud adoption, and rising IT spending in emerging nations, such as India and China. The growing population of the workforce, rising requirement of mobility, and government-supported digitization are projected to drive the adoption of virtual desktop infrastructure solutions in the region.
North America Virtual Desktop Infrastructure Market Insights
In 2024, North America accounted for around 34.20% of the revenue share in virtual desktop infrastructure market, driven by high adoption of advanced technologies, robust demand in IT, BFSI, and healthcare sectors, and a matured digital infrastructure. Global demand for secure remote work solutions and scalable virtualization platforms continue to solidify the region as a leading market position.
Europe Virtual Desktop Infrastructure Market Insights:
Europe accounts for a significant share in the virtual desktop infrastructure market share owing to stringent data protection rules, high demand for secure and reliable remote access, and rapid industry-level digital transformation. Countries, such as Germany, U.K., and France are on top of the adoption leads with a strong IT infrastructure. Increased focus on compliance, sustainability and cost optimization in the region is another factor driving steady market growth.
Latin America (LATAM) and Middle East & Africa (MEA) Virtual Desktop Infrastructure Market Insights
The virtual desktop infrastructure market in the Middle East & Africa is expected to grow owing to booming digital transformation in the UAE, Saudi Arabia, Qatar, and South Africa with soaring need for secure remote access across multiple verticals, according to TechSci Research. Brazil and Argentina are leading adoption among the Latin American countries, driven by the increasing trend of enterprise mobility, management of cloud migration and economical IT architecture initiatives.
Virtual Desktop Infrastructure Market Competitive Landscape:
VMware is a global leader in virtualization and cloud infrastructure, enabling enterprise customers to simplify IT and facilitate hybrid work to enable delivery of services to customers. VMware Horizon, the company's flagship product, offers secure, highly scalable virtual desktops and apps with centralized management features. VMware App Volumes augments this application delivery by streamlining lifecycle management and lowering storage costs. Collectively, they allow organizations to maximize resource utilization, maintain security, and increase end-user efficiency, and this tier of capabilities is what has cemented VMware as an enterprise-level VDI powerhouse.
-
In January 2025, the latest release of Omnissa Horizon 8 (formerly VMware Horizon) arrived with version 2412, marking a major update in desktop and app virtualization aligned with the VDI ecosystem’s evolution.
Citrix is a leader in digital workspace and virtualization technologies and has been providing enterprise customers with proven solutions for secure and flexible remote access. Citrix Virtual Apps and Desktops: Centralizes delivery of apps and desktops to users on any device, with a consistent experience. Citrix DaaS also provides cloud hosted desktops with easier deployment and lower cost. Together, these offerings help enterprises streamline IT complexity, fortify endpoint security, and seamlessly enable hybrid work models to make Citrix a trusted global player in the VDI market.
-
In May 2025, Citrix released Virtual Apps and Desktops 2305, introducing Actionable Insights for Auto Scale, a modernized Web Studio homepage, and optimized storage load balancing, further enhancing performance, admin UI, and cost efficiency.
Virtual Desktop Infrastructure Market Key Players:
Some of the Virtual Desktop Infrastructure Market Companies are:
-
VMware
-
Citrix Systems
-
Microsoft
-
Amazon Web Services (AWS)
-
IBM
-
Cisco Systems
-
Hewlett Packard Enterprise (HPE)
-
Dell Technologies
-
Oracle
-
Huawei Technologies
-
Nutanix
-
Red Hat
-
Parallels International
-
NComputing
-
IGEL Technology
-
Teradici
-
Stratodesk
-
V2 Cloud
-
Fujitsu
-
Centerm
Report Attributes | Details |
---|---|
Market Size in 2024 | USD 17.61 Billion |
Market Size by 2032 | USD 73.83 Millon |
CAGR | CAGR of 19.66% From 2025 to 2032 |
Base Year | 2024 |
Forecast Period | 2025-2032 |
Historical Data | 2021-2023 |
Report Scope & Coverage | Market Size, Segments Analysis, Competitive Landscape, Regional Analysis, DROC & SWOT Analysis, Forecast Outlook |
Key Segments | • By Type (Persistent VDI and Non-persistent VDI) • By Application (BFSI, IT & telecom, Aerospace & defense, Government, Manufacturing, Education, Retail, Transportation, Healthcare and Others) • By Deployment Model (On-premise and Cloud) • By Component (Hardware, Software and Services) |
Regional Analysis/Coverage | North America (US, Canada, Mexico), Europe (Germany, France, UK, Italy, Spain, Poland, Turkey, Rest of Europe), Asia Pacific (China, India, Japan, South Korea, Singapore, Australia, Taiwan, Rest of Asia Pacific), Middle East & Africa (UAE, Saudi Arabia, Qatar, South Africa, Rest of Middle East & Africa), Latin America (Brazil, Argentina, Rest of Latin America) |
Company Profiles | VMware, Citrix Systems, Microsoft, Amazon Web Services (AWS), IBM, Cisco Systems, Hewlett Packard Enterprise (HPE), Dell Technologies, Oracle, Huawei Technologies, Nutanix, Red Hat, Parallels International, NComputing, IGEL Technology, Teradici, Stratodesk, V2 Cloud, Fujitsu and Centerm. |
Table Of Contents
1. Introduction
1.1 Market Definition & Scope
1.2 Research Assumptions & Abbreviations
1.3 Research Methodology
2. Executive Summary
2.1 Market Snapshot
2.2 Market Absolute $ Opportunity Assessment & Y-o-Y Analysis, 2021–2032
2.3 Market Size & Forecast, By Segmentation, 2021–2032
2.3.1 Market Size By Type
2.3.2 Market Size By Application
2.3.3 Market Size By Deployment Model
2.3.4 Market Size By Component
2.4 Market Share & Bps Analysis By Region, 2024
2.5 Industry Growth Scenarios – Conservative, Likely & Optimistic
2.6 Industry CxO’s Perspective
3. Market Overview
3.1 Market Dynamics
3.1.1 Drivers
3.1.2 Restraints
3.1.3 Opportunities
3.1.4 Key Market Trends
3.2 Industry PESTLE Analysis
3.3 Key Industry Forces (Porter’s) Impacting Market Growth
3.4 Industry Supply Chain Analysis
3.4.1 Raw Material Suppliers
3.4.2 Manufacturers
3.4.3 Distributors/Suppliers
3.4.4 Customers/End-Users
3.5 Industry Life Cycle Assessment
3.6 Parent Market Overview
3.7 Market Risk Assessment
4. Statistical Insights & Trends Reporting
4.1 Technology Performance Metrics
4.1.1 Average latency (ms) for VDI sessions across leading providers
4.1.2 Virtual machine density per server (VMs per host)
4.1.3 Average uptime/availability (%) of enterprise VDI deployments
4.1.4 Bandwidth consumption per VDI session (MB/hr)
4.2 Adoption & Application Trends
4.2.1 Percentage share of VDI adoption by industry vertical (BFSI, healthcare, education, government, IT & telecom, etc.)
4.2.2 Growth rate of cloud-hosted vs. on-premise VDI deployments (%)
4.2.3 Average number of end-users per enterprise VDI deployment
4.2.4 Share of VDI adoption for remote work, security compliance, and cost efficiency (%)
4.3 Deployment & Usage Statistics
4.3.1 Average deployment cost per user (USD)
4.3.2 Average time to scale VDI infrastructure (weeks/months)
4.3.3 Percentage of enterprises using hybrid VDI (cloud + on-prem)
4.3.4 Device type distribution for accessing VDI (desktops, laptops, tablets, smartphones, thin clients)
4.4 Security & Compliance Data
4.4.1 Average number of security incidents prevented per VDI deployment per year
4.4.2 Percentage of enterprises adopting VDI for regulatory compliance (GDPR, HIPAA, etc.)
4.4.3 Share of VDI deployments with integrated multi-factor authentication (%)
4.5 Cost & Efficiency Metrics
4.5.1 Average cost savings per user compared to traditional desktop setups (USD/year)
4.5.2 Reduction in IT helpdesk tickets (%) post VDI deployment
4.5.3 Average power consumption savings (%) using thin clients vs. traditional desktops
4.6 Future Outlook Statistics
4.6.1 Projected percentage of enterprises moving fully to cloud-based VDI by 2030
4.6.2 Expected increase in AI/ML-driven VDI resource optimization (%)
4.6.3 Share of VDI supporting immersive workloads (AR/VR, 3D applications) by 2032
5. Virtual Desktop Infrastructure Market Segmental Analysis & Forecast, By Type, 2021 – 2032, Value (Usd Billion)
5.1 Introduction
5.2 Persistent VDI
5.2.1 Key Trends
5.2.2 Market Size & Forecast, 2021 – 2032
5.3 Non-persistent VDI
5.3.1 Key Trends
5.3.2 Market Size & Forecast, 2021 – 2032
6. Virtual Desktop Infrastructure Market Segmental Analysis & Forecast, By Application, 2021 – 2032, Value (Usd Billion)
6.1 Introduction
6.2 BFSI
6.2.1 Key Trends
6.2.2 Market Size & Forecast, 2021 – 2032
6.3 IT & telecom
6.3.1 Key Trends
6.3.2 Market Size & Forecast, 2021 – 2032
6.4 Aerospace & defense
6.4.1 Key Trends
6.4.2 Market Size & Forecast, 2021 – 2032
6.5 Government
6.5.1 Key Trends
6.5.2 Market Size & Forecast, 2021 – 2032
6.6 Manufacturing
6.6.1 Key Trends
6.6.2 Market Size & Forecast, 2021 – 2032
6.7 Education
6.7.1 Key Trends
6.7.2 Market Size & Forecast, 2021 – 2032
6.8 Retail
6.8.1 Key Trends
6.8.2 Market Size & Forecast, 2021 – 2032
6.9 Transportation
6.9.1 Key Trends
6.9.2 Market Size & Forecast, 2021 – 2032
6.10 Healthcare
6.10.1 Key Trends
6.10.2 Market Size & Forecast, 2021 – 2032
6.11 Others
6.11.1 Key Trends
6.11.2 Market Size & Forecast, 2021 – 2032
7. Virtual Desktop Infrastructure Market Segmental Analysis & Forecast, By Deployment Model, 2021 – 2032, Value (Usd Billion)
7.1 Introduction
7.2 On-premise
7.2.1 Key Trends
7.2.2 Market Size & Forecast, 2021 – 2032
7.3 Cloud
7.3.1 Key Trends
7.3.2 Market Size & Forecast, 2021 – 2032
8. Virtual Desktop Infrastructure Market Segmental Analysis & Forecast, By Component, 2021 – 2032, Value (Usd Billion)
8.1 Introduction
8.2 Hardware
8.2.1 Key Trends
8.2.2 Market Size & Forecast, 2021 – 2032
8.3 Software
8.3.1 Key Trends
8.3.2 Market Size & Forecast, 2021 – 2032
8.4 Services
8.4.1 Key Trends
8.4.2 Market Size & Forecast, 2021 – 2032
9. Virtual Desktop Infrastructure Market Segmental Analysis & Forecast By Region, 2021 – 2025, Value (Usd Billion)
9.1 Introduction
9.2 North America
9.2.1 Key Trends
9.2.2 Virtual Desktop Infrastructure Market Size & Forecast, By Type, 2021 – 2032
9.2.3 Virtual Desktop Infrastructure Market Size & Forecast, By Application, 2021 – 2032
9.2.4 Virtual Desktop Infrastructure Market Size & Forecast, By Deployment Model, 2021 – 2032
9.2.5 Virtual Desktop Infrastructure Market Size & Forecast, By Component, 2021 – 2032
9.2.6 Virtual Desktop Infrastructure Market Size & Forecast, By Country, 2021 – 2032
9.2.6.1 USA
9.2.6.1.1 Virtual Desktop Infrastructure Market Size & Forecast, By Type, 2021 – 2032
9.2.6.1.2 Virtual Desktop Infrastructure Market Size & Forecast, By Application, 2021 – 2032
9.2.6.1.3 Virtual Desktop Infrastructure Market Size & Forecast, By Deployment Model, 2021 – 2032
9.2.6.1.4 Virtual Desktop Infrastructure Market Size & Forecast, By Component, 2021 – 2032
9.2.6.2 Canada
9.2.6.2.1 Virtual Desktop Infrastructure Market Size & Forecast, By Type, 2021 – 2032
9.2.6.2.2 Virtual Desktop Infrastructure Market Size & Forecast, By Application, 2021 – 2032
9.2.6.2.3 Virtual Desktop Infrastructure Market Size & Forecast, By Deployment Model, 2021 – 2032
9.2.6.2.4 Virtual Desktop Infrastructure Market Size & Forecast, By Component, 2021 – 2032
9.3 Europe
9.3.1 Key Trends
9.3.2 Virtual Desktop Infrastructure Market Size & Forecast, By Type, 2021 – 2032
9.3.3 Virtual Desktop Infrastructure Market Size & Forecast, By Application, 2021 – 2032
9.3.4 Virtual Desktop Infrastructure Market Size & Forecast, By Deployment Model, 2021 – 2032
9.3.5 Virtual Desktop Infrastructure Market Size & Forecast, By Component, 2021 – 2032
9.3.6 Virtual Desktop Infrastructure Market Size & Forecast, By Country, 2021 – 2032
9.3.6.1 Germany
9.3.6.1.1 Virtual Desktop Infrastructure Market Size & Forecast, By Type, 2021 – 2032
9.3.6.1.2 Virtual Desktop Infrastructure Market Size & Forecast, By Application, 2021 – 2032
9.3.6.1.3 Virtual Desktop Infrastructure Market Size & Forecast, By Deployment Model, 2021 – 2032
9.3.6.1.4 Virtual Desktop Infrastructure Market Size & Forecast, By Component, 2021 – 2032
9.3.6.2 UK
9.3.6.2.1 Virtual Desktop Infrastructure Market Size & Forecast, By Type, 2021 – 2032
9.3.6.2.2 Virtual Desktop Infrastructure Market Size & Forecast, By Application, 2021 – 2032
9.3.6.2.3 Virtual Desktop Infrastructure Market Size & Forecast, By Deployment Model, 2021 – 2032
9.3.6.2.4 Virtual Desktop Infrastructure Market Size & Forecast, By Component, 2021 – 2032
9.3.6.3 France
9.3.6.3.1 Virtual Desktop Infrastructure Market Size & Forecast, By Type, 2021 – 2032
9.3.6.3.2 Virtual Desktop Infrastructure Market Size & Forecast, By Application, 2021 – 2032
9.3.6.3.3 Virtual Desktop Infrastructure Market Size & Forecast, By Deployment Model, 2021 – 2032
9.3.6.3.4 Virtual Desktop Infrastructure Market Size & Forecast, By Component, 2021 – 2032
9.3.6.4 Italy
9.3.6.4.1 Virtual Desktop Infrastructure Market Size & Forecast, By Type, 2021 – 2032
9.3.6.4.2 Virtual Desktop Infrastructure Market Size & Forecast, By Application, 2021 – 2032
9.3.6.4.3 Virtual Desktop Infrastructure Market Size & Forecast, By Deployment Model, 2021 – 2032
9.3.6.4.4 Virtual Desktop Infrastructure Market Size & Forecast, By Component, 2021 – 2032
9.3.6.5 Spain
9.3.6.5.1 Virtual Desktop Infrastructure Market Size & Forecast, By Type, 2021 – 2032
9.3.6.5.2 Virtual Desktop Infrastructure Market Size & Forecast, By Application, 2021 – 2032
9.3.6.5.3 Virtual Desktop Infrastructure Market Size & Forecast, By Deployment Model, 2021 – 2032
9.3.6.5.4 Virtual Desktop Infrastructure Market Size & Forecast, By Component, 2021 – 2032
9.3.6.6 Russia
9.3.6.6.1 Virtual Desktop Infrastructure Market Size & Forecast, By Type, 2021 – 2032
9.3.6.6.2 Virtual Desktop Infrastructure Market Size & Forecast, By Application, 2021 – 2032
9.3.6.6.3 Virtual Desktop Infrastructure Market Size & Forecast, By Deployment Model, 2021 – 2032
9.3.6.6.4 Virtual Desktop Infrastructure Market Size & Forecast, By Component, 2021 – 2032
9.3.6.7 Poland
9.3.6.7.1 Virtual Desktop Infrastructure Market Size & Forecast, By Type, 2021 – 2032
9.3.6.7.2 Virtual Desktop Infrastructure Market Size & Forecast, By Application, 2021 – 2032
9.3.6.7.3 Virtual Desktop Infrastructure Market Size & Forecast, By Deployment Model, 2021 – 2032
9.3.6.7.4 Virtual Desktop Infrastructure Market Size & Forecast, By Component, 2021 – 2032
9.3.6.8 Rest of Europe
9.3.6.8.1 Virtual Desktop Infrastructure Market Size & Forecast, By Type, 2021 – 2032
9.3.6.8.2 Virtual Desktop Infrastructure Market Size & Forecast, By Application, 2021 – 2032
9.3.6.8.3 Virtual Desktop Infrastructure Market Size & Forecast, By Deployment Model, 2021 – 2032
9.3.6.8.4 Virtual Desktop Infrastructure Market Size & Forecast, By Component, 2021 – 2032
9.4 Asia-Pacific
9.4.1 Key Trends
9.4.2 Virtual Desktop Infrastructure Market Size & Forecast, By Type, 2021 – 2032
9.4.3 Virtual Desktop Infrastructure Market Size & Forecast, By Application, 2021 – 2032
9.4.4 Virtual Desktop Infrastructure Market Size & Forecast, By Deployment Model, 2021 – 2032
9.4.5 Virtual Desktop Infrastructure Market Size & Forecast, By Component, 2021 – 2032
9.4.6 Virtual Desktop Infrastructure Market Size & Forecast, By Country, 2021 – 2032
9.4.6.1 China
9.4.6.1.1 Virtual Desktop Infrastructure Market Size & Forecast, By Type, 2021 – 2032
9.4.6.1.2 Virtual Desktop Infrastructure Market Size & Forecast, By Application, 2021 – 2032
9.4.6.1.3 Virtual Desktop Infrastructure Market Size & Forecast, By Deployment Model, 2021 – 2032
9.4.6.1.4 Virtual Desktop Infrastructure Market Size & Forecast, By Component, 2021 – 2032
9.4.6.2 India
9.4.6.2.1 Virtual Desktop Infrastructure Market Size & Forecast, By Type, 2021 – 2032
9.4.6.2.2 Virtual Desktop Infrastructure Market Size & Forecast, By Application, 2021 – 2032
9.4.6.2.3 Virtual Desktop Infrastructure Market Size & Forecast, By Deployment Model, 2021 – 2032
9.4.6.2.4 Virtual Desktop Infrastructure Market Size & Forecast, By Component, 2021 – 2032
9.4.6.3 Japan
9.4.6.3.1 Virtual Desktop Infrastructure Market Size & Forecast, By Type, 2021 – 2032
9.4.6.3.2 Virtual Desktop Infrastructure Market Size & Forecast, By Application, 2021 – 2032
9.4.6.3.3 Virtual Desktop Infrastructure Market Size & Forecast, By Deployment Model, 2021 – 2032
9.4.6.3.4 Virtual Desktop Infrastructure Market Size & Forecast, By Component, 2021 – 2032
9.4.6.4 South Korea
9.4.6.4.1 Virtual Desktop Infrastructure Market Size & Forecast, By Type, 2021 – 2032
9.4.6.4.2 Virtual Desktop Infrastructure Market Size & Forecast, By Application, 2021 – 2032
9.4.6.4.3 Virtual Desktop Infrastructure Market Size & Forecast, By Deployment Model, 2021 – 2032
9.4.6.4.4 Virtual Desktop Infrastructure Market Size & Forecast, By Component, 2021 – 2032
9.4.6.5 Australia
9.4.6.5.1 Virtual Desktop Infrastructure Market Size & Forecast, By Type, 2021 – 2032
9.4.6.5.2 Virtual Desktop Infrastructure Market Size & Forecast, By Application, 2021 – 2032
9.4.6.5.3 Virtual Desktop Infrastructure Market Size & Forecast, By Deployment Model, 2021 – 2032
9.4.6.5.4 Virtual Desktop Infrastructure Market Size & Forecast, By Component, 2021 – 2032
9.4.6.6 ASEAN Countries
9.4.6.6.1 Virtual Desktop Infrastructure Market Size & Forecast, By Type, 2021 – 2032
9.4.6.6.2 Virtual Desktop Infrastructure Market Size & Forecast, By Application, 2021 – 2032
9.4.6.6.3 Virtual Desktop Infrastructure Market Size & Forecast, By Deployment Model, 2021 – 2032
9.4.6.6.4 Virtual Desktop Infrastructure Market Size & Forecast, By Component, 2021 – 2032
9.4.6.7 Rest of Asia-Pacific
9.4.6.7.1 Virtual Desktop Infrastructure Market Size & Forecast, By Type, 2021 – 2032
9.4.6.7.2 Virtual Desktop Infrastructure Market Size & Forecast, By Application, 2021 – 2032
9.4.6.7.3 Virtual Desktop Infrastructure Market Size & Forecast, By Deployment Model, 2021 – 2032
9.4.6.7.4 Virtual Desktop Infrastructure Market Size & Forecast, By Component, 2021 – 2032
9.5 Latin America
9.5.1 Key Trends
9.5.2 Virtual Desktop Infrastructure Market Size & Forecast, By Type, 2021 – 2032
9.5.3 Virtual Desktop Infrastructure Market Size & Forecast, By Application, 2021 – 2032
9.5.4 Virtual Desktop Infrastructure Market Size & Forecast, By Deployment Model, 2021 – 2032
9.5.5 Virtual Desktop Infrastructure Market Size & Forecast, By Component, 2021 – 2032
9.5.6 Virtual Desktop Infrastructure Market Size & Forecast, By Country, 2021 – 2032
9.5.6.1 Brazil
9.5.6.1.1 Virtual Desktop Infrastructure Market Size & Forecast, By Type, 2021 – 2032
9.5.6.1.2 Virtual Desktop Infrastructure Market Size & Forecast, By Application, 2021 – 2032
9.5.6.1.3 Virtual Desktop Infrastructure Market Size & Forecast, By Deployment Model, 2021 – 2032
9.5.6.1.4 Virtual Desktop Infrastructure Market Size & Forecast, By Component, 2021 – 2032
9.5.6.2 Argentina
9.5.6.2.1 Virtual Desktop Infrastructure Market Size & Forecast, By Type, 2021 – 2032
9.5.6.2.2 Virtual Desktop Infrastructure Market Size & Forecast, By Application, 2021 – 2032
9.5.6.2.3 Virtual Desktop Infrastructure Market Size & Forecast, By Deployment Model, 2021 – 2032
9.5.6.2.4 Virtual Desktop Infrastructure Market Size & Forecast, By Component, 2021 – 2032
9.5.6.3 Mexico
9.5.6.3.1 Virtual Desktop Infrastructure Market Size & Forecast, By Type, 2021 – 2032
9.5.6.3.2 Virtual Desktop Infrastructure Market Size & Forecast, By Application, 2021 – 2032
9.5.6.3.3 Virtual Desktop Infrastructure Market Size & Forecast, By Deployment Model, 2021 – 2032
9.5.6.3.4 Virtual Desktop Infrastructure Market Size & Forecast, By Component, 2021 – 2032
9.5.6.4 Colombia
9.5.6.4.1 Virtual Desktop Infrastructure Market Size & Forecast, By Type, 2021 – 2032
9.5.6.4.2 Virtual Desktop Infrastructure Market Size & Forecast, By Application, 2021 – 2032
9.5.6.4.3 Virtual Desktop Infrastructure Market Size & Forecast, By Deployment Model, 2021 – 2032
9.5.6.4.4 Virtual Desktop Infrastructure Market Size & Forecast, By Component, 2021 – 2032
9.5.6.5 Rest of Latin America
9.5.6.5.1 Virtual Desktop Infrastructure Market Size & Forecast, By Type, 2021 – 2032
9.5.6.5.2 Virtual Desktop Infrastructure Market Size & Forecast, By Application, 2021 – 2032
9.5.6.5.3 Virtual Desktop Infrastructure Market Size & Forecast, By Deployment Model, 2021 – 2032
9.5.6.5.4 Virtual Desktop Infrastructure Market Size & Forecast, By Component, 2021 – 2032
9.6 Middle East & Africa
9.6.1 Key Trends
9.6.2 Virtual Desktop Infrastructure Market Size & Forecast, By Type, 2021 – 2032
9.6.3 Virtual Desktop Infrastructure Market Size & Forecast, By Application, 2021 – 2032
9.6.4 Virtual Desktop Infrastructure Market Size & Forecast, By Deployment Model, 2021 – 2032
9.6.5 Virtual Desktop Infrastructure Market Size & Forecast, By Component, 2021 – 2032
9.6.6 Virtual Desktop Infrastructure Market Size & Forecast, By Country, 2021 – 2032
9.6.6.1 UAE
9.6.6.1.1 Virtual Desktop Infrastructure Market Size & Forecast, By Type, 2021 – 2032
9.6.6.1.2 Virtual Desktop Infrastructure Market Size & Forecast, By Application, 2021 – 2032
9.6.6.1.3 Virtual Desktop Infrastructure Market Size & Forecast, By Deployment Model, 2021 – 2032
9.6.6.1.4 Virtual Desktop Infrastructure Market Size & Forecast, By Component, 2021 – 2032
9.6.6.2 Saudi Arabia
9.6.6.2.1 Virtual Desktop Infrastructure Market Size & Forecast, By Type, 2021 – 2032
9.6.6.2.2 Virtual Desktop Infrastructure Market Size & Forecast, By Application, 2021 – 2032
9.6.6.2.3 Virtual Desktop Infrastructure Market Size & Forecast, By Deployment Model, 2021 – 2032
9.6.6.2.4 Virtual Desktop Infrastructure Market Size & Forecast, By Component, 2021 – 2032
9.6.6.3 Qatar
9.6.6.3.1 Virtual Desktop Infrastructure Market Size & Forecast, By Type, 2021 – 2032
9.6.6.3.2 Virtual Desktop Infrastructure Market Size & Forecast, By Application, 2021 – 2032
9.6.6.3.3 Virtual Desktop Infrastructure Market Size & Forecast, By Deployment Model, 2021 – 2032
9.6.6.3.4 Virtual Desktop Infrastructure Market Size & Forecast, By Component, 2021 – 2032
9.6.6.4 Egypt
9.6.6.4.1 Virtual Desktop Infrastructure Market Size & Forecast, By Type, 2021 – 2032
9.6.6.4.2 Virtual Desktop Infrastructure Market Size & Forecast, By Application, 2021 – 2032
9.6.6.4.3 Virtual Desktop Infrastructure Market Size & Forecast, By Deployment Model, 2021 – 2032
9.6.6.4.4 Virtual Desktop Infrastructure Market Size & Forecast, By Component, 2021 – 2032
9.6.6.5 South Africa
9.6.6.5.1 Virtual Desktop Infrastructure Market Size & Forecast, By Type, 2021 – 2032
9.6.6.5.2 Virtual Desktop Infrastructure Market Size & Forecast, By Application, 2021 – 2032
9.6.6.5.3 Virtual Desktop Infrastructure Market Size & Forecast, By Deployment Model, 2021 – 2032
9.6.6.5.4 Virtual Desktop Infrastructure Market Size & Forecast, By Component, 2021 – 2032
9.6.6.6 Rest of Middle East & Africa
9.6.6.6.1 Virtual Desktop Infrastructure Market Size & Forecast, By Type, 2021 – 2032
9.6.6.6.2 Virtual Desktop Infrastructure Market Size & Forecast, By Application, 2021 – 2032
9.6.6.6.3 Virtual Desktop Infrastructure Market Size & Forecast, By Deployment Model, 2021 – 2032
9.6.6.6.4 Virtual Desktop Infrastructure Market Size & Forecast, By Component, 2021 – 2032
10. Competitive Landscape
10.1 Key Players' Positioning
10.2 Competitive Developments
10.2.1 Key Strategies Adopted (%), By Key Players, 2024
10.2.2 Year-Wise Strategies & Development, 2021 – 2025
10.2.3 Number Of Strategies Adopted By Key Players, 2024
10.3 Market Share Analysis, 2024
10.4 Product/Service & Application Benchmarking
10.4.1 Product/Service Specifications & Features By Key Players
10.4.2 Product/Service Heatmap By Key Players
10.4.3 Application Heatmap By Key Players
10.5 Industry Start-Up & Innovation Landscape
10.6 Key Company Profiles
10.6.1 VMware
10.6.1.1 Company Overview & Snapshot
10.6.1.2 Product/Service Portfolio
10.6.1.3 Key Company Financials
10.6.1.4 SWOT Analysis
10.6.2 Citrix Systems
10.6.2.1 Company Overview & Snapshot
10.6.2.2 Product/Service Portfolio
10.6.2.3 Key Company Financials
10.6.2.4 SWOT Analysis
10.6.3 Microsoft
10.6.3.1 Company Overview & Snapshot
10.6.3.2 Product/Service Portfolio
10.6.3.3 Key Company Financials
10.6.3.4 SWOT Analysis
10.6.4 Amazon Web Services (AWS)
10.6.4.1 Company Overview & Snapshot
10.6.4.2 Product/Service Portfolio
10.6.4.3 Key Company Financials
10.6.4.4 SWOT Analysis
10.6.5 IBM
10.6.5.1 Company Overview & Snapshot
10.6.5.2 Product/Service Portfolio
10.6.5.3 Key Company Financials
10.6.5.4 SWOT Analysis
10.6.6 Cisco Systems
10.6.6.1 Company Overview & Snapshot
10.6.6.2 Product/Service Portfolio
10.6.6.3 Key Company Financials
10.6.6.4 SWOT Analysis
10.6.7 Hewlett Packard Enterprise (HPE)
10.6.7.1 Company Overview & Snapshot
10.6.7.2 Product/Service Portfolio
10.6.7.3 Key Company Financials
10.6.7.4 SWOT Analysis
10.6.8 Dell Technologies
10.6.8.1 Company Overview & Snapshot
10.6.8.2 Product/Service Portfolio
10.6.8.3 Key Company Financials
10.6.8.4 SWOT Analysis
10.6.9 Oracle
10.6.9.1 Company Overview & Snapshot
10.6.9.2 Product/Service Portfolio
10.6.9.3 Key Company Financials
10.6.9.4 SWOT Analysis
10.6.10 Huawei Technologies
10.6.10.1 Company Overview & Snapshot
10.6.10.2 Product/Service Portfolio
10.6.10.3 Key Company Financials
10.6.10.4 SWOT Analysis
10.6.11 Nutanix
10.6.11.1 Company Overview & Snapshot
10.6.11.2 Product/Service Portfolio
10.6.11.3 Key Company Financials
10.6.11.4 SWOT Analysis
10.6.12 Red Hat
10.6.12.1 Company Overview & Snapshot
10.6.12.2 Product/Service Portfolio
10.6.12.3 Key Company Financials
10.6.12.4 SWOT Analysis
10.6.13 Parallels International
10.6.13.1 Company Overview & Snapshot
10.6.13.2 Product/Service Portfolio
10.6.13.3 Key Company Financials
10.6.13.4 SWOT Analysis
10.6.14 NComputing
10.6.14.1 Company Overview & Snapshot
10.6.14.2 Product/Service Portfolio
10.6.14.3 Key Company Financials
10.6.14.4 SWOT Analysis
10.6.15 IGEL Technology
10.6.15.1 Company Overview & Snapshot
10.6.15.2 Product/Service Portfolio
10.6.15.3 Key Company Financials
10.6.15.4 SWOT Analysis
10.6.16 Teradici
10.6.16.1 Company Overview & Snapshot
10.6.16.2 Product/Service Portfolio
10.6.16.3 Key Company Financials
10.6.16.4 SWOT Analysis
10.6.17 Stratodesk
10.6.17.1 Company Overview & Snapshot
10.6.17.2 Product/Service Portfolio
10.6.17.3 Key Company Financials
10.6.17.4 SWOT Analysis
10.6.18 V2 Cloud
10.6.18.1 Company Overview & Snapshot
10.6.18.2 Product/Service Portfolio
10.6.18.3 Key Company Financials
10.6.18.4 SWOT Analysis
10.6.19 Fujitsu
10.6.19.1 Company Overview & Snapshot
10.6.19.2 Product/Service Portfolio
10.6.19.3 Key Company Financials
10.6.19.4 SWOT Analysis
10.6.20 Centerm Information Co. Ltd.
10.6.20.1 Company Overview & Snapshot
10.6.20.2 Product/Service Portfolio
10.6.20.3 Key Company Financials
10.6.20.4 SWOT Analysis
11. Analyst Recommendations
11.1 SNS Insider Opportunity Map
11.2 Industry Low-Hanging Fruit Assessment
11.3 Market Entry & Growth Strategy
11.4 Analyst Viewpoint & Suggestions On Market Growth
12. Assumptions
13. Disclaimer
14. Appendix
14.1 List Of Tables
14.2 List Of Figures
Key Segments:
By Type
-
Persistent VDI
-
Non-persistent VDI
By Application
-
BFSI
-
IT & telecom
-
Aerospace & defense
-
Government
-
Manufacturing
-
Education
-
Retail
-
Transportation
-
Healthcare
-
Others
By Deployment Model
-
On-premise
-
Cloud
By Component
-
Hardware
-
Software
-
Services
Request for Segment Customization as per your Business Requirement: Segment Customization Request
Regional Coverage:
North America
-
US
-
Canada
Europe
-
Germany
-
UK
-
France
-
Italy
-
Spain
-
Russia
-
Poland
-
Rest of Europe
Asia Pacific
-
China
-
India
-
Japan
-
South Korea
-
Australia
-
ASEAN Countries
-
Rest of Asia Pacific
Middle East & Africa
-
UAE
-
Saudi Arabia
-
Qatar
-
South Africa
-
Rest of Middle East & Africa
Latin America
-
Brazil
-
Argentina
-
Mexico
-
Colombia
-
Rest of Latin America
Request for Country Level Research Report: Country Level Customization Request
Available Customization
With the given market data, SNS Insider offers customization as per the company’s specific needs. The following customization options are available for the report:
-
Detailed Volume Analysis
-
Criss-Cross segment analysis (e.g. Product X Application)
-
Competitive Product Benchmarking
-
Geographic Analysis
-
Additional countries in any of the regions
-
Customized Data Representation
-
Detailed analysis and profiling of additional market players
An accurate research report requires proper strategizing as well as implementation. There are multiple factors involved in the completion of good and accurate research report and selecting the best methodology to compete the research is the toughest part. Since the research reports we provide play a crucial role in any company’s decision-making process, therefore we at SNS Insider always believe that we should choose the best method which gives us results closer to reality. This allows us to reach at a stage wherein we can provide our clients best and accurate investment to output ratio.
Each report that we prepare takes a timeframe of 350-400 business hours for production. Starting from the selection of titles through a couple of in-depth brain storming session to the final QC process before uploading our titles on our website we dedicate around 350 working hours. The titles are selected based on their current market cap and the foreseen CAGR and growth.
The 5 steps process:
Step 1: Secondary Research:
Secondary Research or Desk Research is as the name suggests is a research process wherein, we collect data through the readily available information. In this process we use various paid and unpaid databases which our team has access to and gather data through the same. This includes examining of listed companies’ annual reports, Journals, SEC filling etc. Apart from this our team has access to various associations across the globe across different industries. Lastly, we have exchange relationships with various university as well as individual libraries.

Step 2: Primary Research
When we talk about primary research, it is a type of study in which the researchers collect relevant data samples directly, rather than relying on previously collected data. This type of research is focused on gaining content specific facts that can be sued to solve specific problems. Since the collected data is fresh and first hand therefore it makes the study more accurate and genuine.
We at SNS Insider have divided Primary Research into 2 parts.
Part 1 wherein we interview the KOLs of major players as well as the upcoming ones across various geographic regions. This allows us to have their view over the market scenario and acts as an important tool to come closer to the accurate market numbers. As many as 45 paid and unpaid primary interviews are taken from both the demand and supply side of the industry to make sure we land at an accurate judgement and analysis of the market.
This step involves the triangulation of data wherein our team analyses the interview transcripts, online survey responses and observation of on filed participants. The below mentioned chart should give a better understanding of the part 1 of the primary interview.

Part 2: In this part of primary research the data collected via secondary research and the part 1 of the primary research is validated with the interviews from individual consultants and subject matter experts.
Consultants are those set of people who have at least 12 years of experience and expertise within the industry whereas Subject Matter Experts are those with at least 15 years of experience behind their back within the same space. The data with the help of two main processes i.e., FGDs (Focused Group Discussions) and IDs (Individual Discussions). This gives us a 3rd party nonbiased primary view of the market scenario making it a more dependable one while collation of the data pointers.
Step 3: Data Bank Validation
Once all the information is collected via primary and secondary sources, we run that information for data validation. At our intelligence centre our research heads track a lot of information related to the market which includes the quarterly reports, the daily stock prices, and other relevant information. Our data bank server gets updated every fortnight and that is how the information which we collected using our primary and secondary information is revalidated in real time.

Step 4: QA/QC Process
After all the data collection and validation our team does a final level of quality check and quality assurance to get rid of any unwanted or undesired mistakes. This might include but not limited to getting rid of the any typos, duplication of numbers or missing of any important information. The people involved in this process include technical content writers, research heads and graphics people. Once this process is completed the title gets uploader on our platform for our clients to read it.
Step 5: Final QC/QA Process:
This is the last process and comes when the client has ordered the study. In this process a final QA/QC is done before the study is emailed to the client. Since we believe in giving our clients a good experience of our research studies, therefore, to make sure that we do not lack at our end in any way humanly possible we do a final round of quality check and then dispatch the study to the client.