VPX SBC Market Report Scope & Overview:
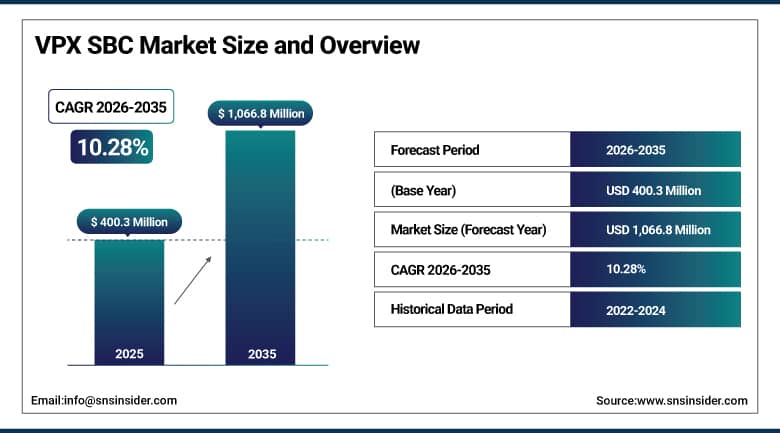
The VPX SBC Market was valued at USD 400.3 Million in 2025 and is expected to reach USD 1,066.8 Million by 2035, growing at a CAGR of 10.28% from 2026–2035.
The market for global VPX SBCs is growing at an alarming rate owing to the increased preference for small, light, and efficient rugged computers that are critical in industries such as defense, aviation, and industrial automation that require small, light, and sturdy computers capable of functioning efficiently under harsh operating conditions. Miniaturization in VPX SBCs refers to the process of making smaller the various components of a computer such as processors, memory chips, and connectors without compromising on performance. The segment that is driving the aerospace and defense market includes the need for rugged computers with real-time computing capabilities and high speeds, as exemplified by the use of VPX SBCs in applications such as EW, radar, C4ISR, and avionics through the initiative of the DoD's MODSAP.
In June 2024, Abaco Systems introduced the SBC3901, a 3U VPX single-board computer featuring Nvidia’s Jetson AGX Orin GPU, designed for autonomous and embedded edge computing.
Market Size and Forecast:
-
Market Size in 2026E: USD 441.7 Million
-
Market Size by 2035: USD 1,066.8 Million
-
CAGR: 10.28% from 2026 to 2035
-
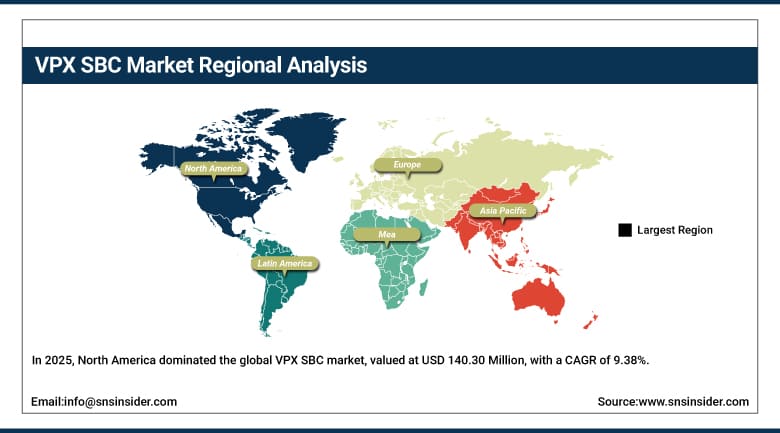
Fastest Growing Region: Asia Pacific
-
Largest Region: North America
To Get More Information On VPX SBC Market - Request Free Sample Report
VPX SBC Market Trends:
-
AI-ready VPX computing solutions are emerging for multi-domain, autonomous, and sensor-fusion defense applications globally.
-
MOSA and SOSA standard adoption is boosting interoperability, modularity, and AI acceleration across VPX system architectures.
-
Global military expenditure reaching USD 2.71 trillion in 2024 is sustaining strong rugged embedded computing procurement.
-
Integration complexity with legacy VME and CompactPCI systems continues to increase development time and engineering expenses.
-
6U VPX systems are gaining share for high-performance computing needs in radar, AI missions, and naval applications.
U.S. VPX SBC Market Outlook:
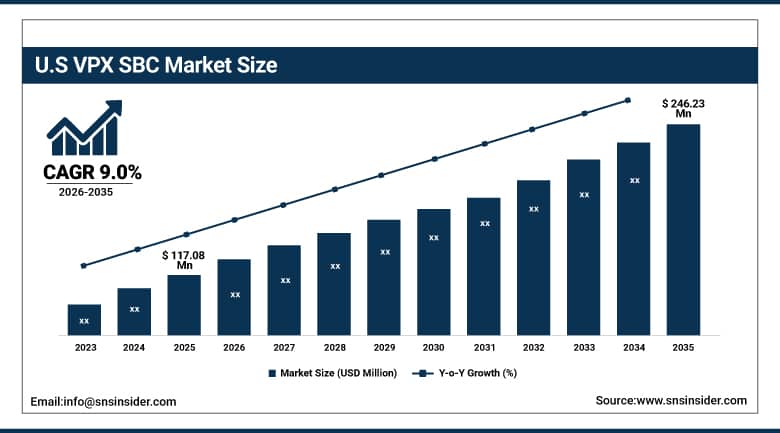
The United States leads the North American VPX SBC Market, valued at USD 117.08 Million in 2025 and projected to reach USD 246.23 Million by 2035 at a 9.0% CAGR.
The market for the VPX SBC (VPX Single Board Computer) of the United States is expanding due to rising requirements for high-performance embedded computing solutions. Increasing investments into military modernization projects, implementation of AI-based edge computing solutions, as well as adoption of advanced radar, electronic warfare, and surveillance systems is contributing towards market growth. In addition, the demand for reliable computing devices that provide real-time performance capabilities in difficult conditions is rising. Lastly, advancements in open architecture standards and adoption of autonomous systems are further aiding VPX SBC adoption.
In September 2024, Connect Tech joined the Gigabit Multimedia Serial Link Ecosystem by Analog Devices as a design partner, strengthening its edge AI and robotics solutions with products like the Anvil Embedded System and Sentry-X2 MIL-Rugged supporting advanced vision and AI computing.
VPX SBC Market Segment Analysis:
-
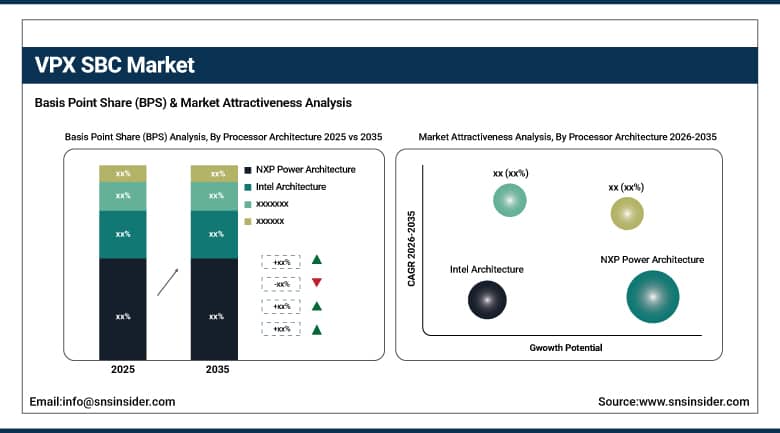
By Processor Architecture, NXP Power Architecture leads the market, projected to grow from USD 109.30 Million in 2025 at a 9.78% CAGR, while Intel Architecture is the fastest-growing segment through AI and edge computing advancements.
-
By Application, Electronic Warfare led the market in 2025 at USD 81.25 Million, at a 10.15% CAGR, while Radar Systems is the fastest-growing application at a 10.97% CAGR.
-
By End User, Defense dominated the market in 2025 at USD 147.78 Million at a 10.41% CAGR, while Aerospace is the fastest-growing end-user segment at a 10.43% CAGR.
By Processor Architecture, NXP Power Architecture dominates, Intel Architecture grows fastest
The leader in the market of VPX SBCs is NXP Power Architecture, expected to reach USD 109.30 Million in revenue growth with a compound annual growth rate of 9.78%. The growth will be driven by the proven reliability, security, and robust performance of NXP architecture that is well-suited for use in aerospace and defense systems. The extensive track record of NXP in mission-critical embedded computing and qualification across a wide range of defense programme platforms have contributed to its leadership in VPX SBC architecture.
The rapid growth in this segment will come from advancements in technologies such as artificial intelligence (AI), edge computing, and energy-efficient processors such as the Xeon-D and Core Ultra processors. With its strong ecosystem, backward compatibility, and focus on providing AI-powered military and industrial automation solutions, Intel Architecture will be one of the fastest growing segments in the future VPX SBC market.
By Application, electronic warfare dominates, radar systems grow fastest
The Electronic Warfare application segment emerged as the leading revenue contributor to the worldwide VPX SBC market with revenue estimated at USD 81.25 Million in 2025, representing a CAGR of 10.15% for the forecast period, owing to the increasing importance of AI-powered threat detection, signals intelligence, and mission computing. This indicates the high-performance nature of electronic warfare application segment, which happens to be one of the most computationally intensive applications, thus necessitating real-time signal processing.
The Radar Systems application segment was the fastest-growing in terms of revenue during the review period and will continue to dominate during the forecast period, with growth rates pegged at 10.97% in 2025. The growth of this segment can be attributed to advanced technologies such as AESA, AEW&C, and maritime radars, which need data fusion and artificial intelligence-based situational awareness, making the computational throughput requirements of modernized radars higher than that of previous radar processing systems.
By End User, defense dominates, aerospace grows fastest
Segment-wise analysis reveals that Defense accounted for the highest revenue share, worth USD 147.78 Million in the year 2025, growing with a CAGR of 10.41%. Increasing need for rugged and advanced computing systems for applications like electronic warfare, radar, C4ISR, and unmanned vehicles are propelling growth. The structural nature of defense procurements in multi-year programmes ensures steady VPX SBC demand which is budgeted far more than commercial computing applications.
The fastest-growing segment is Aerospace, growing at a CAGR of 10.43% from 99.75 million in 2025, powered by innovations in Avionics, satellite applications, and AI-based flight computing. Together, these segments have made VPX SBC indispensable in modernization initiatives for future defense and aerospace applications around the globe, as indicated by HENSOLDT’s development of avionics mission computers in Europe, and VPX SBC purchases by DRDO in India.
Regional Analysis:
|
Region |
Major Country |
Share within Region, 2025 (%) |
|---|---|---|
|
North America |
United States |
83.4% |
|
Europe |
Germany |
27.8% |
|
Asia Pacific |
China |
29.7% |
|
Latin America |
Brazil |
36.4% |
|
Middle East & Africa |
Saudi Arabia |
31.5% |
North America VPX SBC Market Insights
In 2025, North America dominated the global VPX SBC market, valued at USD 140.30 Million, with a CAGR of 9.38%. The dominant position held by North America can be attributed to the significant efforts put into defense modernization and innovations in the aerospace industry and adoption in AI-based industries. The adoption of various programmes, such as MOSA, NGAD, and F-35 avionics, fuels demand for high-performing VPX solutions for applications in radar, electronic warfare, and command control. The cooperation within the SOSA consortium makes the solution more interoperable, along with investment in space research, autonomous vehicles, and edge AI.
Approximately 83.4% of North American revenue comes from the United States via Abaco Systems, Mercury Systems, and Northrop Grumman. Canada holds the title for being responsible for the fastest growing sub-region within North America due to its NORAD renewal program and digitalization in the aerospace sector.
Get Customized Report as Per Your Business Requirement - Enquiry Now
Europe VPX SBC Market Insights
In 2025, the VPX SBC market was a sizable portion of the global market, which stood at USD 95.83 Million with a CAGR of 9.50%. This was fueled by military modernization, aerospace industry developments, and automation in industries, including programmes such as FCAS, which includes France, Germany, and Spain, and Tempest from the United Kingdom, which uses VPX systems to enable AI-powered aircrafts and radar processing. The leading player in the European VPX SBC market in 2025 was Germany, accounting for USD 26.68 Million due to modernization in the Bundeswehr and advanced aerospace technologies from Airbus and Diehl Aerospace.
Firms such as Airbus, Leonardo, and Thales are incorporating VPX modules into their aircraft and satellites, thanks to support from the European Defense Fund and VITA-Europe.
Asia Pacific VPX SBC Market Insights
The Asia-Pacific is the most rapidly developing region in the VPX SBC market with a value of USD 80.40 Million by 2025 with the highest CAGR of 12.93%. The rapid growth in this market is owing to defense modernization, increased expansion in aerospace and industries, and increased digitization in the countries like China, India, Japan, and South Korea as defense forces are incorporating VPX SBCs in their C4ISR, radar, and electronic warfare systems, whereas space mission organizations like ISRO, CNSA, and JAXA are using them in their space ventures.
China, with a value of USD 23.86 Million by 2025 with the highest CAGR of 13.54%, is a leader in VPX SBC market because of its focus on defense modernization and its ability to become a semiconductor nation with its Made in China 2025 program. India, which is also witnessing the highest growth in this market, has a CAGR of 13.98%.
MEA & Latin America VPX SBC Market Insights
The Middle East and Africa VPX SBC market worth USD 22.69 Million at a 8.14% CAGR, will be propelled by investments in national defense upgrades, growth in aerospace sector, and digitization in industries. Saudi Arabia, under Vision 2030, uses VPX SBCs for integration in its radar, C4ISR, and electronic warfare systems by SAMI, whereas UAE, Israel, and South Africa have deployed rugged VPX SBCs in their respective defense, avionics, and energy industries through their innovative capabilities and collaborations.
Latin America VPX SBC market had worth of USD 23.78 Million in 2025 at CAGR of 10.49%. Brazil dominated the Latin American region, worth USD 8.66 Million in 2025, due to advancements in defense and aerospace industry such as SISFRON programs and Embraer collaboration, whereas Colombia is showing highest regional CAGR of 11.28% due to use of VPX SBCs in defense, telecommunication, and energy sectors.
Market Dynamics:
Growth Drivers: Defense modernization and rising military expenditure fueling rugged VPX embedded systems demand
Globally increasing trends of defense modernization programs and escalating expenditure towards the procurement of advanced military electronics are propelling the market growth for VPX SBCs. Today’s modern defense systems such as radar, electronic warfare, and unmanned systems require reliable, robust, and compact computing systems to operate efficiently and effectively in real-time, which is being fulfilled by VPX SBC based on OpenVPX and SOSA standards. With increasing global military expenditure expected to touch an impressive figure of USD 2.71 trillion in 2024, companies such as Curtiss-Wright and Mercury Systems have launched AI-enabled VPX SBCs.
Significant defense budget for research and development activities, presence of leading aerospace OEMs including Lockheed Martin, Boeing, Northrop Grumman, etc., and growing adoption of OpenVPX and SOSA standards are encouraging extensive use of VPX SBCs for applications such as avionics, C4ISR, and unmanned defense systems. Defense projects such as F-35, MQ-9 Reaper, AN/TPY-2 Radar, and CV90 vehicles exemplify the significance of VPX SBCs in powering next-generation robust and interoperable computing platforms.
Restraints: High development and integration costs limiting broader VPX SBC adoption beyond core defense applications
The VPX SBC market is plagued by various problems owing to the high cost involved in designing, customizing, and integrating these products. The cost associated with adding rugged computing capabilities and certifications to the board increases drastically because of compliance issues, testing, and certification requirements for aerospace PCBs, which fall under rugged computing components. On average, certification and ruggedization of a circuit board in such applications adds a cost between USD 300 and over USD 2,500, depending on specific applications.
The VPX SBCs designed for harsh conditions need certification and ruggedization as well as testing for signal integrity and thermal stability among other rigorous tests and validation procedures. In addition, VPX systems can require customization of backplane, chassis, and power supplies, hence increasing non-recurring engineering costs. Moreover, many defense contractors and OEMs, especially smaller organizations, have difficulty justifying the return on investment in light of limited volume and funding restrictions from governments. This is coupled with higher costs related to integration.
Opportunities: MOSA and interoperability standards adoption creating expanded modular VPX system market opportunities
Increasingly, the implementation of the Modular Open Systems Approach is changing the VPX SBC market. In its directive, the Department of Defense of the USA recommends the use of OpenVPX and SOSA standards in accordance with MOSA guidelines. The release of SOSA Technical Standard 1.1 in 2024 incorporated AI processing capabilities and better heat management, thus enabling further VPX advancements, while examples such as MOSA-compliant VPX SBC solutions developed jointly by Elma Electronic and Kontron AG enable faster development and lower integration costs.
As modular, standard-compliant VPX systems become the foundation of modernization projects in the defense sector, there arises a considerable business opportunity for companies whose product lines meet the MOSA and SOSA standards. Each defense project involving mandatory compatibility with open systems architectures translates into VPX SBC procurement that favors multi-vendor-compatible solutions over closed legacy systems.
Recent Developments:
-
2024: Abaco Systems introduced the SBC3901, a 3U VPX single-board computer featuring Nvidia’s Jetson AGX Orin GPU, delivering 248 TOPS of AI performance and meeting MIL-STD-810 standards for autonomous and embedded edge computing applications.
-
2024: Connect Tech joined the Gigabit Multimedia Serial Link Ecosystem by Analog Devices as a design partner, strengthening edge AI and robotics solutions through products like the Anvil Embedded System and Sentry-X2 MIL-Rugged.
-
2024: Elma Electronic launched the portable FlexVNX+ development chassis designed to accelerate testing and development of VNX+ PICs, offering high-speed communications and flexible interfaces for defense mission control and surveillance applications.
VPX SBC Market Key Players are:
-
Abaco Systems
-
Extreme Engineering Solutions
-
Connect Tech Inc.
-
Kontron AG
-
Aitech Defense Systems
-
Curtiss-Wright Corporation
-
Mercury Systems Inc.
-
Acromag Inc.
-
Advantech Co. Ltd.
-
Concurrent Technologies Inc.
-
GE Aviation Systems
-
Ecrin Systems
-
ADLINK Technology Inc.
-
Mistral Solutions Pvt. Ltd.
-
Cornet Technology Inc.
-
Elma Electronic Inc.
-
General Micro Systems Inc.
-
Pixus Technologies Inc.
-
General Dynamics Mission Systems Inc.
-
Wolf Advanced Technology
VPX SBC Market Report Scope:
| Report Attributes | Details |
|---|---|
| Market Size in 2025 | USD 400.3 Million |
| Market Size by 2035 | USD 1,066.8 Million |
| CAGR | CAGR of 10.28% From 2026 to 2035 |
| Base Year | 2025 |
| Forecast Period | 2026-2035 |
| Historical Data | 2022-2024 |
| Report Scope & Coverage | Market Size, Segments Analysis, Competitive Landscape, Regional Analysis, DROC & SWOT Analysis, Forecast Outlook |
| Key Segments | • By Processor Architecture (NXP Power Architecture, Intel Architecture, ARM Architecture, FPGA-Based Computing Modules, GPU-Accelerated Platforms, Others) • By Application (Electronic Warfare, Radar Systems, Mission Computers, Intelligence Surveillance & Reconnaissance, Command Control Communications Computers & Intelligence, Avionics Systems, Space Systems, Others) • By End User (Defense, Aerospace, Naval, Space Agencies, Commercial Industrial) |
| Regional Analysis/Coverage | North America (US, Canada), Europe (Germany, UK, France, Italy, Spain, Russia, Poland, Rest of Europe), Asia Pacific (China, India, Japan, South Korea, Australia, ASEAN Countries, Rest of Asia Pacific), Middle East & Africa (UAE, Saudi Arabia, Qatar, South Africa, Rest of Middle East & Africa), Latin America (Brazil, Argentina, Mexico, Colombia, Rest of Latin America). |
| Company Profiles | Abaco Systems, Extreme Engineering Solutions, Connect Tech Inc., Kontron AG, Aitech Defense Systems, Curtiss-Wright Corporation, Mercury Systems Inc., Acromag Inc., Advantech Co. Ltd., Concurrent Technologies Inc., GE Aviation Systems, Ecrin Systems, ADLINK Technology Inc., Mistral Solutions Pvt. Ltd., Cornet Technology Inc., Elma Electronic Inc., General Micro Systems Inc., Pixus Technologies Inc., General Dynamics Mission Systems Inc., Wolf Advanced Technology. |
Frequently Asked Questions
The VPX SBC Market is expected to grow at a CAGR of 10.28% from 2026 to 2035.
The VPX SBC Market was valued at USD 400.3 Million in 2025.
Global defense modernization with military expenditure reaching USD 2.71 trillion in 2024, rising demand for rugged real-time computing in electronic warfare and radar systems, and MOSA and SOSA standards adoption enhancing interoperability are the primary growth factors.
Defense dominated the market in 2025 at USD 147.78 Million, driven by rising demand for rugged, high-performance computing in mission-critical applications, while Aerospace is the fastest-growing end-user segment.
North America led the market in 2025, valued at USD 140.30 Million, driven by extensive defense modernization and aerospace innovation, while Asia-Pacific is the fastest-growing region at a 12.93% CAGR.
Get in Touch
