Wearable Materials Market Report Scope & Overview:
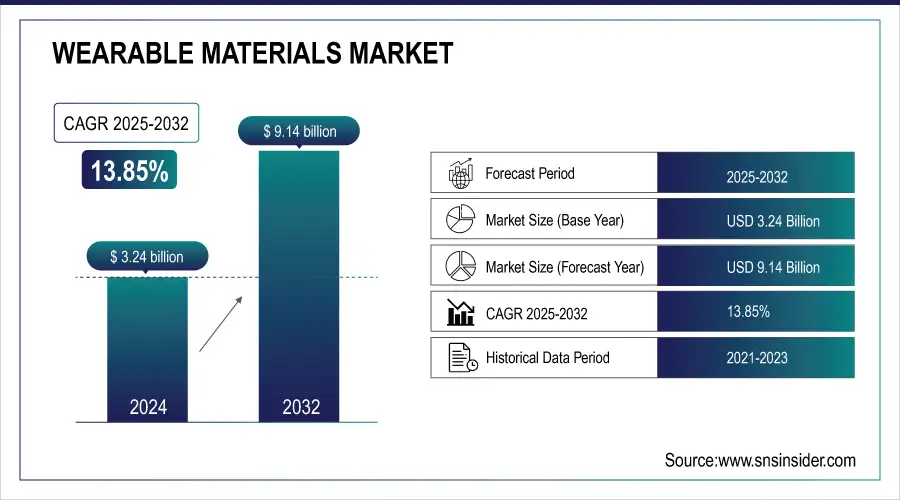
The Wearable Materials Market size was valued at USD 3.24 billion in 2024 and is expected to reach USD 9.14 billion by 2032, growing at a CAGR of 13.85% over the forecast period of 2025-2032.
The wearable materials market size is growing due to the development of wearable electronics materials and the increasing adoption of products such as fitness trackers, smartwatches, and smart clothing with biosensors. Materials such as TPEs, silicones, and polyurethanes are transforming the wearable materials market, allowing for the production of flexible, lightweight, and biocompatible devices.The FDA announced fast-track approvals for 2023, indicating timely support from the regulator to wearable health devices. Eastman partnered up with players in the wearable technology space to deliver sustainable polymers for flexible electronics.
Market Size and Forecast
-
Market Size in 2024: USD 3.24 Billion
-
Market Size by 2032: USD 9.14 Billion
-
CAGR: 13.85% from 2025 to 2032
-
Base Year: 2024
-
Forecast Period: 2025–2032
-
Historical Data: 2021–2023
To Get more information on Wearable Materials Market - Request Free Sample Report
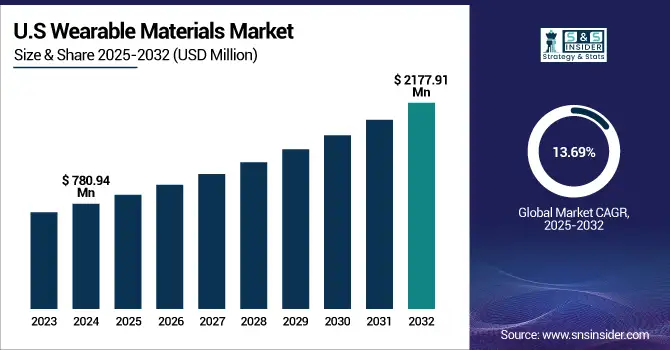
The U.S. leads with a market size of USD 780.94 million in 2024 and is projected to reach a market size of USD 2177.91 million in 2032, contributing over 65% of North America’s wearable materials market share and a CAGR of 13.69% during the forecast period of 2025 - 2032.
Wearable Materials Market Trends
-
Rising demand for smart textiles and wearable electronics is driving the wearable materials market.
-
Increasing adoption in healthcare, fitness, sports, and military applications is boosting growth.
-
Integration of conductive fibers, sensors, and flexible polymers is enhancing functionality and comfort.
-
Advancements in lightweight, breathable, and durable materials are improving user experience.
-
Expansion of IoT-enabled and AI-driven wearable devices is shaping market trends.
-
Focus on sustainable, washable, and skin-friendly materials is fueling adoption.
-
Collaborations between textile manufacturers, electronics firms, and research institutions are accelerating innovation and commercialization.
Wearable Materials Market Growth Drivers:
-
Surge in remote patient monitoring devices drives regulatory approvals of wearable sensors
A rise in government support for health-monitoring devices is driving the wearable sensors market growth. The FDA has approved, prioritized approval for materials for wearable electronics based on biosensor-equipped devices, and track-approved this in the U.S. Thermoplastic elastomers and medical-grade silicones are key to this trend. Wearable materials companies gain as biosensors become increasingly pliable, bolstering growth and share in the wearable materials market. Such regulations back up the traction of these chemicals in the wearables market and wearable materials market trends analysis is poised to receive a boost.
-
Integration of biodegradable polymers in wearable electronics enhances eco-conscious consumer appeal
The wearable materials are rising as firms turn to biodegradable polymers in order to remain in line with their sustainability ambitions. Thermoplastic elastomers and recycled copolyesters are emerging as the material of wearable electronics. Eastman’s $1 billion recycling plant in France is expected to recycle 160 million kg of plastic every year by 2025. Helped by eco-aware consumers, demand for these projects is growing, and the merchandise size of the wearables is growing. Wearable material companies are capitalizing on these trends to grow their share in the wearable materials market and match with emerging wearable materials market trends toward circular and green alternatives.
Wearable Materials Market Restraints:
-
Limited recycling infrastructure restricts the adoption of sustainable wearable materials
Despite the interest in sustainable materials, the majority of the regions do not have a recycling system for wearable electronics materials. Eastman’s French plant will produce 160 million kg annually, but global infrastructure is limited. This raises the market potential for recycled TPE and other green materials. End-of-life challenges can be a disincentive for brands to embrace green wearables. This limitation hinders the growth of the wearable materials market and curtails trends in the wearable materials market towards sustainability, thus curbing the market share for circular innovations.
Wearable Materials Market Segmentation Analysis:
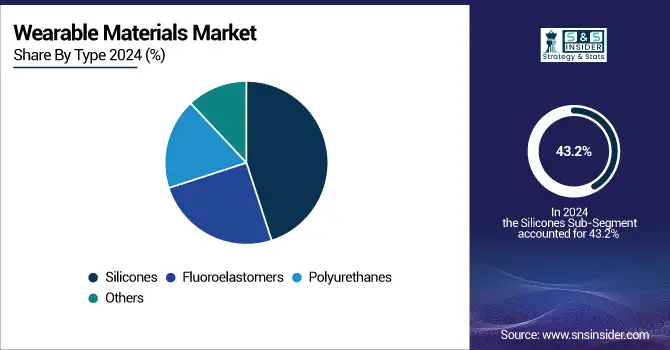
By Type, Silicones dominate with 43.2% share in 2024 due to biocompatibility, flexibility, skin-contact suitability, and FDA-compliant applications.
Silicones segment dominated the wearable materials market, due to their biocompatible nature, offering skin-contact application, and accounted for a share of 43.2% in 2024. This material is common in fitness bands and wearable medical products because it resists heat and is flexible to the touch. Companies such as Momentive, Wacker Chemie, and others have broadened their offerings of silicone-based materials for wearable electronics. Regulatory compliance of silicones according to ISO 10993 reinforces its dominance, thereby driving the wearable materials market, trends, and adoption.
On the other hand, driven by factors such as sustainability and comfort, polyurethanes are expected to witness the highest growth in the wearable materials market at a CAGR of 14.39% by 2024. They had an elastic and robust property which would be useful in the materials of wearable electronics, including sportswear and a health monitor. Companies such as Eastman have focused on eco-conscious thermoplastic elastomers, driving developments in polyurethane-based materials.
By Application, Fitness trackers lead with 39% share, while smart clothing grows fastest at 14.43% CAGR, driven by embedded sensors and wearable technology.
The fitness trackers held a substantial share in the wearable materials market by application, driven by the increase in individual health monitoring, and accounted for a value of 39.0% in 2024. Such devices use softer touch and skin-friendly materials such as silicones and thermoplastic elastomers. Fast-track approvals by the FDA for fitness-focused wearable electronics materials have also aided adoption.
However, Smart clothing is the fastest-growing segment in the wearable materials market, advancing with a CAGR of 14.43% in 2024, fueled by rising demand for embedded sensors and responsive fabrics. Companies such as Eastman and collaborations with the likes of Patagonia are also part of a trend toward sustainable, wearable clothing with built-in sensors. These advances are translating into the wearable technology market, with materials such as flexible polyurethanes and elastomers driving the sector’s growth. Smart Textiles are playing an ever-increasing role in health, fitness, and defence industries.
Wearable Materials Market Regional Analysis
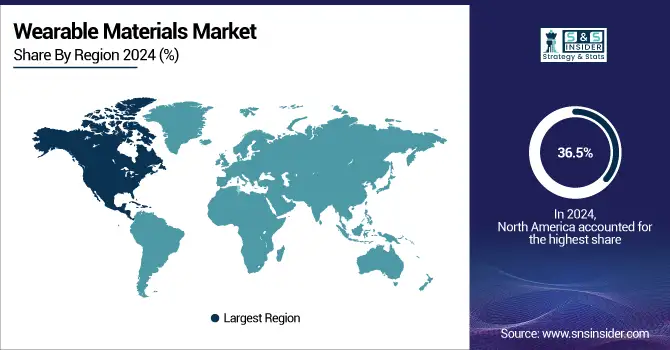
North America Wearable Materials Market Insights
North America dominated the wearable materials market in 2024 with a 36.5% market share, driven by strong innovation and regulatory support. The U.S. FDA has made it easier to obtain approvals for skin-friendly silicones and thermoplastic elastomers in fitness and medical wearable devices. Both DuPont and Eastman have rolled out new product lines targeting flexible wearable electronics. Multi-university and tech company partnerships are advancing super-sensitive wearable sensors. These reinforce the continued robustness and leadership of the region in the wearable materials market, which already has the largest market share and innovation power.
Fast-track approvals from the F.D.A. for remote biosensors and for skin-safe silicones set a favorable climate. For instance, in 2023, the FA approved silicone-based heart-rate monitors as safe and effective. Companies such as Momentive have created medical-grade silicones engineered specifically for U.S. healthcare wearables. Strong collaboration in NIH-funded studies of thermoplastic elastomer patches.
Get Customized Report as per Your Business Requirement - Enquiry Now
Asia Pacific Wearable Materials Market Insights
Asia Pacific is the second leading region in the wearable materials market in 2024, with 28% market share and the fastest growing region, registering a 14.4% CAGR. The Chinese government has explicitly established the trend of silicones and thermoplastic elastomers by advocating that domestic production shall be guaranteed under the “Made in China 2025” plan. Elastic Polymer Patches for Health Wearables in India to be Funded by the Department of Science & Technology. Japan’s METI is promoting the incorporation of biocompatible materials in sensors. Such efforts mirror the Asia Pacific’s fast acceptance of smart textiles and make it a player of significance in the trends and growth of wearable materials.
China accounts for a major share of Asia Pacific’s wearable materials market, becoming a production hub. Government programs under “Made in China 2025” focus on self-sufficiency in silicones and thermoplastic elastomers, according to official ministry papers. Wacker’s Shanghai plant produces medical-grade elastomers for health-care products, the company said in corporate statements.
Europe Wearable Materials Market Insights
Europe in the wearable materials market is experiencing steady growth, driven by rising demand for smart textiles, medical wearables, and connected devices. Technological advancements in electronic textiles, lightweight composites, and sustainable materials are enhancing product performance. Strong presence of research institutions, innovation hubs, and established textile manufacturers supports market expansion. Increasing adoption in healthcare, sports, and fashion sectors, coupled with government initiatives promoting wearable technology, is further accelerating regional market growth.
Middle East & Africa and Latin America Wearable Materials Market Insights
The Middle East & Africa and Latin America wearable materials markets are witnessing gradual growth, fueled by rising interest in fitness, healthcare, and smart wearable devices. Increasing consumer awareness, adoption of connected technologies, and expanding e-commerce platforms are supporting demand. Investments in research, collaborations with global wearable technology firms, and government initiatives promoting digital health and smart textiles are enhancing regional market penetration, driving the adoption of innovative and sustainable wearable materials.
Wearable Materials Market Competitive Landscape:
DuPont
DuPont, founded in 1802 and headquartered in Wilmington, Delaware, USA, is a global leader in advanced materials, chemicals, and safety solutions. The company focuses on innovations in protective apparel, high-performance polymers, and electronics materials, serving industries ranging from construction to healthcare. DuPont emphasizes integrating smart technologies and wearable solutions to improve worker safety, efficiency, and operational performance, while leveraging partnerships to accelerate adoption of cutting-edge innovations in monitoring, protection, and performance-enhancing materials.
-
May 2025: DuPont partnered with Epicore Biosystems to integrate wearable hydration management technology with protective garments, providing real-time physiological data such as hydration levels to prevent heat stress in high-risk environments.
Wacker Chemie AG
Wacker Chemie, founded in 1914 and headquartered in Munich, Germany, is a global chemical company specializing in silicone, polymer, and biotechnological solutions. The company focuses on advanced materials for electronics, healthcare, construction, and wearable applications. Wacker emphasizes research and collaboration to develop innovative solutions that transform everyday products, including textiles, into high-tech applications. Its initiatives in smart fabrics integrate sensors to monitor physiological parameters, supporting safety, health, and interactive wearable technologies.
-
2024: Wacker Chemie supported Danish start-up LEAP Technology in developing smart fabrics with integrated sensors that monitor breathing and map movements, turning clothing into high-tech wearables.
Shin-Etsu Chemical Co., Ltd.
Shin-Etsu Chemical, founded in 1926 and headquartered in Tokyo, Japan, is a leading global chemical company specializing in silicones, polyvinyl chloride (PVC), and electronic materials. The company invests in innovative materials for electronics, healthcare, and wearable devices, enabling advanced monitoring and data collection. Shin-Etsu focuses on developing technologies that improve remote health diagnostics, safety, and human performance by integrating bio-signal sensing capabilities into wearable materials, enhancing early detection and continuous monitoring of vital signs.
-
December 2021: Shin-Etsu Chemical developed new materials for wearable devices capable of remotely measuring and transmitting electrical bio-signals, including heart rate and ECG waveforms, aiming to improve health monitoring and early diagnosis of chronic diseases.
Key Players
Some of the Wearable Materials Market Companies
-
DuPont de Nemours, Inc.
-
Wacker Chemie AG
-
Koninklijke DSM N.V.
-
Arkema S.A.
-
Shin-Etsu Chemical Co., Ltd.
-
Elkem ASA
-
Momentive Performance Materials
-
The Lubrizol Corporation
-
Toray Industries
-
Teijin Limited
-
Lydall Performance Materials
-
Bally Ribbon Mills
-
Avery Dennison
-
Nano Dimension
-
Loomia
-
Embro-Tex
-
Ganni
-
Vollebak
| Report Attributes | Details |
|---|---|
| Market Size in 2024 | USD 3.24 billion |
| Market Size by 2032 | USD 9.14 billion |
| CAGR | CAGR of 13.85% From 2025 to 2032 |
| Base Year | 2024 |
| Forecast Period | 2025-2032 |
| Historical Data | 2021-2023 |
| Report Scope & Coverage | Market Size, Segments Analysis, Competitive Landscape, Regional Analysis, DROC & SWOT Analysis, Forecast Outlook |
| Key Segments | •By Type (Silicones, Fluoroelastomers, Polyurethanes, Others) •By Application (Fitness Trackers, Smart Glass, Wearable Camera, Smart Clothing, Others) |
| Regional Analysis/Coverage | North America (US, Canada, Mexico), Europe (Germany, France, UK, Italy, Spain, Poland, Turkey, Rest of Europe), Asia Pacific (China, India, Japan, South Korea, Singapore, Australia, Rest of Asia Pacific), Middle East & Africa (UAE, Saudi Arabia, Qatar, South Africa, Rest of Middle East & Africa), Latin America (Brazil, Argentina, Rest of Latin America) |
| Company Profiles | BASF SE, DuPont de Nemours, Inc., Wacker Chemie AG, Koninklijke DSM N.V., Arkema S.A., Eastman Chemical Company, Shin-Etsu Chemical Co., Ltd., Elkem ASA, Momentive Performance Materials, and The Lubrizol Corporation |
Get in Touch
